1
When and how China’s real exchange rate affects African industry?
Sylviane GUILLAUMONT JEANNENEY and Ping HUA*
Université Clermont Auvergne, CNRS, IRD, CERDI, F-63000 Clermont-Ferrand, France
Tel: 00 33473177405; Fax: 00 33473177428 Email : [email protected]; [email protected]
A paraitre dans le Journal of Economic Development
*This work was supported by the Agence Nationale de la Recherche of the French government through the program ‘Investissements d’avenir’ ‘ANR-10-LABX-14-01’ and by La Fondation pour les Etudes et Recherches sur le Développement International (Ferdi).
2
When and how China’s real exchange rate affects African industry?
Abstract
African countries suffer from a low rate of growth of manufacturing production. Many economists consider that it is due to an overvaluation of their currency. Indeed, several African countries have known an appreciation of their currency, notably against the Chines currency. Moreover, Chinese exports of manufactured goods rose between 2000 and 2015 at the astronomic annual rate of 26% (versus 10% for the rest of the world). This article tries to answer the following questions: what is the impact of the real exchange rates of African countries relative to China on African manufacturing? Is it specific?
We estimated a manufacturing function by using a panel data of 44 African countries over the period from 2000 to 2015 and GMM estimator. We built an original set of real exchanges rates, weighted by the share of imports of manufactured goods from the ten main partners, globally and by categories of goods.
Contrary to the common opinion, we show that African real appreciation of exchange rates relative to China exerts a positive and specific effect on African manufacturing, despite a traditional negative effect through the competition of China’s exports. We assume that this positive effect is due to productivity improvement. First, we reassure this assumption by several theoretical arguments relative to Schumpeterian “creative destruction,” improvement of labor efficiency, increase of capital-labor ratio. Second, by some specificities of imports from China, which are both consumption goods cheap and bottom of the range covering daily needs, and machines and transport equipment easily bought by medium and small enterprises. Naturally, this positive effect disappears with too strong appreciations. By contrast, we do not find the same positive effect for the rest of the world.
Our work has clear political implication, as it does not speak in favor of systematic depreciations of African currencies.
3
Highlights
- We argue two theoretical opposite effects of real exchange rates on manufacturing;
- We empirically find a specific positive effect of the real appreciation of African currencies vis-à-vis the renminbi on African manufacturing, despite a traditional negative effect through the competition of China’s exports; we do not find the same positive effect for the rest of the world.
- We suggest that this positive effect of the real appreciation of African countries relative to the renminbi is due to an improvement of manufacturing productivity.
4
1. Introduction
Developing manufacturing industry has been the main way for developing countries to attain a high level of income, to create employment and to reduce poverty. The backwardness of many African economies seems linked to the low level of their manufacturing. Indeed the share of the real manufacturing value added of all African countries (in 2005 US dollars) in the world total is only 1.9% in 2015 against 23% for China who is the biggest producer of manufactured goods. Moreover, African countries are producing a few kinds of manufactured goods and selling them principally in domestic markets, on contrary to China, which produces many kinds of manufactured goods and exports them to everywhere in the world. The share of exports of manufactured goods of African countries in their total exports is on average low (23% in 2015) while China’s share of manufactured goods in its total exports is 94% in 2015. The low level of production of manufactured goods and the low share of exports of manufactured goods of African countries are the two faces of the same phenomenon as production for local markets generally acts as a learning process before exporting.
There is a sharp contrast between the low rate of growth of manufacturing value added of African countries and the rapid growth of foreign exports of manufactured goods to their markets. This is particularly striking as far as China’s exports are concerned. While Africa’s manufacturing value added (in real terms) increased at an annual average growth rate of 4.2 % over the period 2000-2015, China’s exports of manufactured goods to African countries rose at an average annual growth rate of 26%, which was much higher than that of the exports by the rest of the world (10%). Thus, China’s share of manufactured goods to Africa in the total of world exports of manufactured goods1 to Africa increased from 5% in 2000 to 30% in 2015.
5
China became the most important import partner of manufactured goods for 24 African countries, the second one for 14 African countries and the third one for six countries.2
We can associate two striking facts to the rapid growth of China’s exports of manufactured goods to Africa. First, the real depreciations of the renminbi relative to many African currencies have stimulated China’s exports, as shown in Guillaumont Jeanneney and Hua (2015).3 Therefore, we expect a negative effect of the appreciation of African currencies
against the renminbi on African manufactured production. Second, even that the average annual growth of manufacturing value added of African countries during the 2000-2015 period (4.2%) was very low relative to that of China’s exports to these countries, it is much higher than that of the precedent period 1980-1999 (only 1.4%), during which China’s exports of manufactured goods to African countries were very low4. This last observation leads us to expect on contrary
that the real appreciation of African currencies relative to the renminbi may have exerted a positive effect on African manufactured production.
Therefore, this article tries to answer the following questions: what are the impacts of the real exchange rates of China relative to African countries on their manufacturing? Are they specific or comparable to those of the rest of the world?
Our econometric analysis focuses on value added of manufactured goods rather than on exports. Indeed African exports of manufactured goods represent a small share of African manufacturing production and a still smaller share of the demand in the world market: it results that competition from foreign suppliers is likely to exert its effects on African manufacturing
2 See table A1 in Appendix entitled “Shares of the three biggest import partners of manufactured goods
in the total of the ten biggest import partners of African countries, on average 2008-2012”.
3 The authors use the panel data from 49 African countries over the period 2000 to 2011. 4 Bräutigam and Tang (2014) did the same observation.
6
mostly in domestic markets rather than in foreign ones. The focus on the impact of the exports of manufactured goods by China on African exports as Giovannetti and Sanfilippo (2009) do, among others, may underestimate China’s effect.
The real effective exchange rates of African countries published by the International Monetary Fund (International Financial Statistics) are not convenient to investigate their impact on manufacturing because of the weak shares of manufactured goods in African exports. For the objective of this study, we have especially calculated real effective exchange rates suitable to the sector of manufactured goods. For each African country, the weights given to foreign countries depend on the share of their exports of manufactured goods to this African country in its imports from its ten biggest import partners of manufactured goods. These real effective exchange rates are more relevant to analyse the impact of exchange rates on manufactured production than the usual ones, which consider the main commercial partners (for imports and often exports) whatever the natures of traded goods are.
Contrary to the common opinion, we show that African real appreciation of exchange rates relative to China exerts a specific positive effect on Africa’s manufacturing, besides traditional negative effect through a strong increase of China’s exports of manufactured goods and a lower profitability of manufactured production, inciting resource reallocation into the non-tradable sector. This positive effect is probably due to productivity improvement and is higher than the negative effect. It leads a total positive effect of real exchange rates of African countries relative to China on African manufacturing, except for strong appreciations. By contrast, we do not find the same positive effect for the rest of the world. We propose several assumptions relative to Schumpeterian “creative destruction,” improvement of labor efficiency, increase of capital-labor ratio to explain this specific and positive effect.
7
The remainder of the paper is organised as follows. Section 2 presents the channels through which real exchange rates may affect manufactured production, with a special focus on China’s impacts. Section 3 details the econometric strategy (model, dataset, estimation methodology). Section 4 elaborates on the estimation results. Section 5 concludes and provides policy implications.
2. Why real exchange rates of African countries relative to China may exert specific actions on African manufacturing?
Usually, several structural factors explain manufacturing. They include the size of the domestic market, the level of infrastructure, financial development, political stability and absence of violence, human capital and remoteness from foreign markets, all of which are relevant for the manufacturing sector in Africa (Carey et al, 2007; Collier et Gunning, 1999; Cadot et al, 2015; Mijiyawa, 2017).
Besides these structural factors, we must consider relative prices captured by real exchange rates. In this section, we argue that real exchange rates between African countries and foreign competitors may theoretically exert two opposite kinds of effects on manufacturing production. We furthermore explain that the effects of real exchange rates of African countries vis-à-vis China may be specific because of the strong growth of China’s exports of manufactured goods to African countries, their particular contents and low prices.
2.1 Negative effects of real appreciation of African currencies on manufacturing Traditional negative effect through foreign exports volume
According to the traditional theoretical view of international trade, the increase of the relative price between African countries and foreign competitors (e.g. a real appreciation of the
8
exchange rates of African countries) stimulates foreign exports to African countries, as the rise of the price of domestic goods reduces the competitiveness of local businesses relative to foreign competitors. The more plentiful the manufactured goods exported by foreign countries, the more significant the potential negative effect on the manufacturing of African countries is likely to be.
Negative resource allocation effect
The appreciation of real exchange rates exerts detrimental effects well beyond the stimulation of imports (or foreign exports), even if this channel is the most obvious and the most studied. An appreciation of a country’s currency may reduce its manufactured exports to the world and therefore reduce the incentives to produce manufactured goods. In a more general way, a real appreciation not only implies a rise in domestic prices relative to foreign prices, but also a change in the internal structure of prices or a rise in the price of non-tradable goods relative to the price of tradable goods. Therefore, a currency appreciation increasing the cost of labor (expressed in tradable goods), the profitability of manufacturing is damaged and the incentive to produce and to innovate is reduced; resources are thus allocated to non-tradable sectors (McMillan et al., 2014). Rodrick (2008) advises the governments in low-income countries to undervalue systematically their exchange rates in order to compensate for the handicaps they face due to market failures, especially crippling manufacturing. If not, the countries may suffer from premature deindustrialization because of resource allocation to non-tradable sector (Rodrik, 2015).
2.2 Positive effects of real appreciation of African currencies on manufacturing
However, some arguments are in the other direction (Guillaumont Jeanneney and Hua, 2011). The basic one is that appreciation makes the producers (managers and workers) to increase their productivity through three effects.
9
Effect of Schumpeterian “creative destruction”
First, facing a stronger foreign competition, managers are pushed to improve the efficiency of their enterprises. Some firms are obliged to close their worst performing factories. This is a kind of Schumpeterian “creative destruction”, which benefits the best-performing businesses. Lacovone et al (2013), using sector-firm data and OLS/IV estimation, showed that China’s competition has led an engine of creative destruction in Mexico’s manufacturing.
“X-efficiency” effect
Second, in a low-income country, an appreciation of real exchange rate, increasing the real remuneration for unskilled workers expressed in tradable goods, would induce an improvement in the efficiency of workers in countries where the wages of unskilled workers are still very low (Guillaumont and Guillaumont Jeanneney, 1991). As early as 1957, Leibenstein stressed that in developing countries, labor remuneration that is too low, may negatively impacts workers' health and their working capacity. He also showed that the motivation of workers affects efficiency – what he referred to as “X-efficiency” (Leibenstein, 1957, 1966). This hypothesis appears relevant to the context of Africa, where workers’ wages are particularly low.
We do not have information on the remuneration of workers in the manufacturing sector for all African countries. However, Gelb et al. (2013) have calculated the annual cost of manufacturing labor including wages, bonuses and social payments for full-time workers for 12 African countries in 2006 or 2007 (in the middle of our study period) using the data of the World Bank's Enterprise Surveys. The manufacturing cost was less than or close to a thousand dollars in eight of 12 countries in the sample, and sometimes much less ($ 461 in Ethiopia and $ 568 in Ghana), which corresponds to a daily income close to the World Bank poverty line of $ 1.25 in 2005 dollars. We can explain this weakness in the average remuneration of workers by the dominance of micro and small enterprises whose share in the total of companies is greater
10
than 60% in the manufacturing sector of these same countries. Using the same data, Clake (2012) found that manufacturing wages in sub-Saharan Africa, which are relatively high compared to other countries at the same level of development, are also associated with relatively high productivity.
Capital intensity effect
Third, a real appreciation reduces the relative cost of imported capital goods and increases wages relative to the cost of capital. This induces a more capital-intensive production system, encourages technological innovations, and so increases labor productivity and manufacturing competiveness (Hua, 2007). Therefore, it is possible that the decrease of the price of certain types of imported manufactured goods, such as machines and transport equipment, is favorable to the manufacturing competiveness of African countries.
In brief, real appreciation of exchange rates may theoretically exert two opposite effects on manufacturing, favorable or detrimental (Fig. 1).
2.3 Potential specific roles of real exchange rates of African countries relative to China We expect that the real exchange rates of African countries relative to China exert peculiar impacts on Africa’s manufacturing, due to the specific evolution of these real exchange rates and to the level and the composition of China’s exports of manufactured goods to these countries.
Evolution of real exchange rates of African countries relative to China
First, the real exchange rates of African countries relative to China varied higher than that relative to the rest of the world. From 2000 to 2007, on average, the bilateral real exchange rate of African countries relative to China rose (or appreciated) rapidly and more than their effective real exchange rates relative to the rest of the world, and then it strongly depreciated contrary to the last ones (Fig. 2).
11
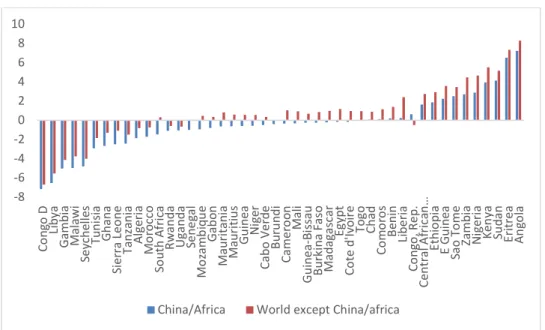
Moreover, the changes in the real exchange rates of individual African countries relative to China exhibit a great diversity and they are different from the changes in the real exchange rates relative to other import partners (Fig. 3).
Negative impact via China’s exports of manufactured goods
As already noted, the strong export growth of manufactured goods by China to African countries lead to imagine a negative impact of real appreciation of African currencies against the renminbi on their manufactured production through the stimulation of China’s exports to African countries. Indeed many studies have specifically shown the damaging effect of Chinese exports on African production or exports of manufactured goods5. If Giovannetti and Sanfilippo
(2009) consider 48 African countries, the other studies consider only some countries or a specific one. It is the case of Power (2008) and Golub et al (2018) who consider six African countries, while other papers analyze specifically the relationship between China and an African country such as South Africa (Morris and Einhorn 2008; Edwards and Jenkins 2015), Ethiopia (Gebre-Egziabher 2007, 2009; Redi 2009; Sonobe et al. 2009) or Nigeria (Gabriel and Ahiuma-Young 2008), among others. Even if these studies have a limited geographical coverage and do not include an econometric investigation (with the exception of Giovannetti and Sanfilippo, 2009), the diagnostic is clear as for the negative impact of Chinese exports6.
5 Recently, several studies analyzed the impact of the Chinese competition on the industry elsewhere.
Jenkin (2015) argued that China’s competition is present in Brazil’s domestic and foreign markets and a Dutch Disease effect is observed, but without empirical analysis. Other papers have focused on labor market: Autor et al (2013, 2016) and Acemoglu et al (2016) have analyzed the impact of China competition on the labor market of the United-States.
6 Eichengreen et al. (2007) and Greenway et al. (2008) have a similar diagnostic for Chinese exports to
12
Figure 4 effectively shows the negative statistical relationships between the manufacturing value added of African countries and the exports of manufactured goods by China, both relative to the real GDP of African countries. It appears that the elasticity of manufactured production to the exports of manufactured goods by China is higher than that relative to the exports by other foreign countries. Moreover, as the exports of manufactured goods by China to African countries, stimulated by the appreciation of African currencies, have grown much faster than the exports by the rest of the world, we can imagine that the negative effect of China’s exports of manufactured goods on African manufacturing is higher than that from the rest of the world.
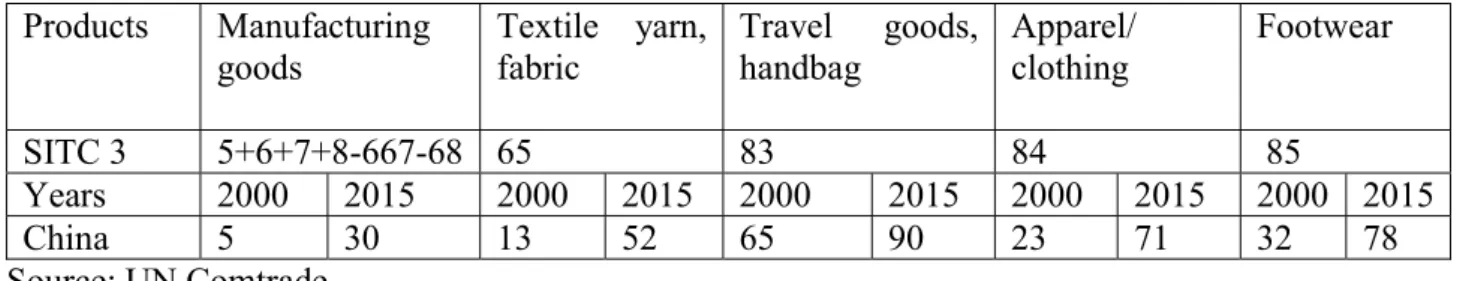
Moreover, exports are all the more detrimental to manufacturing that they are the same kinds of goods than those locally produced. In the case of African countries, it concerns low cost labor-intensive goods in which China’s presence is higher than the rest of the world. The shares of China’s exports of labor-intensive goods to Africa in the total of the world exports of the same goods are very high and increased from 10% in 2000 to 44% in 20157. They increased
from 13% in 2000 to 52% in 2015 for textile and clothing (SITC 65), from 65% to 90% for travel goods and handbag (SITC 83), from 23% to 71% for apparel and clothing (SITC 84) and from 33% to 78% for footwear (SITC 85) (Table 1). These kinds of Chinese goods and their strong varieties are in direct competition with the local goods (Kaplinsky and Morris, 2009).
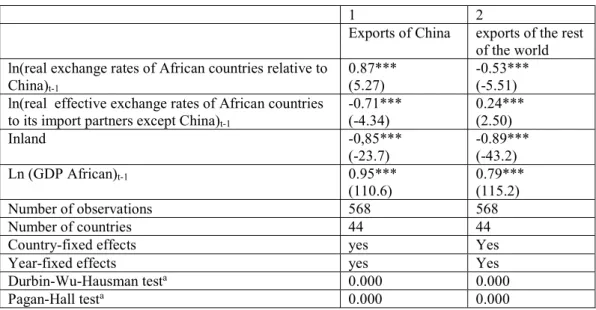
Finally, the exports by China and by the rest of the world to African countries depend on the relative real exchange rates vis-à-vis China and vis-à-vis other countries, as there are potential substitution effects between the origins of African imports. Indeed an appreciation of African currencies against the renminbi increases China’s exports to African countries (positive
13
elasticity) and reduces those by other countries (negative elasticity); an appreciation of African currencies against foreign countries (except China) exerts an inverse effect (Table 2).
Now, the absolute value of the elasticity of China’s exports of manufactured goods to African countries relative to their real exchange rates relative to China is higher than the absolute value of the elasticity of these same exports to the effective exchange rates relative to other countries (+0.87 against -0.71 in column 1). It is the contrary for the absolute values of the elasticities of the exports of the rest of the world to the two types of real exchange rates (+0.24 against -0.53 in column 2). It results that an uniform appreciation of African currencies vis-à-vis the renminbi and vis-à-vis the other currencies increases China’s exports to African countries at the expense of the exports of other countries and this effect is rising with the part of China’s exports in the total of world exports to African countries8.
Positive impact via productivity improvement
On the contrary, it is possible that an appreciation of African currencies relative to the renminbi leads to an improvement of African manufacturing productivity.
First, the real appreciation of African countries relative to the renminbi reinforces China’s competition, which obliged local enterprises to close down inefficient enterprises. Many small and often informal labor-intensive factories in Africa have thus succumbed to the Chinese competition as what happened in China (Zhang and Puman, 2018). For example, Gabriel & Ahiuma-Young (2008) observed that 17 Nigerian fabric factories were closed between 2004 and 2008. Other enterprises, which are able to innovate, may compete with Chinese goods and even became for the first time exporters, which are more productive. It seems to have been the case of the Ethiopian shoe industry (Gebre-Egziabher, 2009; Redi, 2009;
8 If we suppose that African real exchange rates increase by 10%, China’s exports to African countries
14
Sonobe et al, 2009). From 2000 to 2008, Birr's real appreciation of 35% was followed by the closure of many small non-performing enterprises in favor of larger and more competitive companies in terms of price and quality of goods. In general, the real appreciation of the currency exerts a constraint on business owners that pushes them to improve the efficiency of their management.
Second, Chinese consumption goods are very competitively priced. Real appreciation further reduces the price of current consumption goods bought by poor people, as the Chinese manufactured goods are cheap or bottom of the range and provide large kinds of goods covering the daily needs, and therefore it contributes to the well-being of workers. China is the first exporter of consumption goods to Africa since 2005. In 2015, the share of consumption goods exported by China to African countries in the total of consumption goods exported by the world is 52%.
Third, the exports of China’s manufactured goods diversified. China became the first partner country from which Africa imports capital goods since 2006. The share of machines and transport equipment in China’s exports of manufactured goods to Africa has increased from 30% in 2000 to 35% in 2015 and the share of China in the total of world exports of machines and transport equipment to African countries has increased from 3% in 2000 to 23% in 2015. The strong implication of the Chinese government in economic cooperation with African countries and Chinese private investments explains the important exports of machine and equipment towards African countries (Shen, 2015). A large part of these goods is not in direct competition with African manufacturing, on contrary it may contribute to African manufacturing production (Bräutigam and Tang, 2014). The appreciation of African countries vis-à-vis the renminbi thus reduces the relative cost of capital goods largely imported from China by medium and small firms and tends to increase capital-labor ratio, and thus the productivity.
15
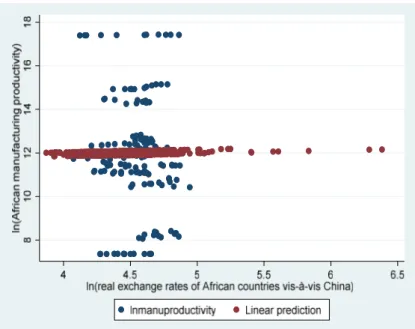
We have calculated the manufacturing labor productivity as the ratio of manufacturing value added expressed in constant national currency (2005) to the number of manufacturing employees for 13 African countries9 during the 2000-2012 periodusing the database from
Groningen Growth at Development Center. A positive statistical relationship between the labor productivity and their real exchange rates relative to China (with an elasticity of 0.13, significant at 0.04 level) seems to support the above arguments (Fig. 5).
3. Empirical strategy
3.1. Estimating four kinds of regressions
The precedent theoretical framework leads us to estimate an equation with three kinds of explanatory variables: structural factors of manufacturing, exports of manufactured goods to African countries and real exchange rates of African countries.
The basic equation is then the following:
𝑙𝑛𝑀𝑉𝐴 = 𝑎 + 𝑏𝑙𝑛𝑃𝐶 + 𝑐 ln 𝐼𝑁𝐹 + 𝑑𝑙𝑛𝐹 + 𝑒𝐺 + 𝑓𝑙𝑛𝐸 + 𝑔𝑙𝑛𝑋 + ℎ𝑙𝑛𝑅𝐸𝐸𝑅 + 𝜇 + 𝜏 + 𝜀 (Equation 1) Where MVAis manufactured value added, PC is private consumption (which captures the size of the domestic market), INF is level of infrastructure, F is financial development, G is level of political stability and absence of violence and E level of education.10 X is real exports of
manufactured goods of the world to African countries and REER is real effective exchange rate of African countries, Finally i represents an African country, t the year, ln natural logarithm, µ unobserved individual effect, 𝜏 time effects and 𝜀 error terms.
9 Data are available only for 13 countries (Botswana, Egypt, Ethiopia, Ghana, Kenya, Malawi,
Mauritius, Morocco, Nigeria, Senegal, South Africa, Tanzania and Zambia).
16
In order to shed light on the potential specific role of China, we separate the exports of manufactured goods by China from by other countries, as well as the bilateral real exchange rates of African countries vis-à-vis China from the real effective exchange rates of African countries vis-à-vis the other exporting countries.
𝑙𝑛𝑀𝑉𝐴 = 𝑎 + 𝑏𝑙𝑛𝑃𝐶 + 𝑐 ln 𝐼𝑁𝐹 + 𝑑𝑙𝑛𝐹 + 𝑒𝐺 + 𝑓𝑙𝑛𝐸 + 𝑔 𝑙𝑛𝑋𝐶 + 𝑔 𝑙𝑛𝑋𝑅 +
ℎ 𝑙𝑛𝑅𝐸𝑅𝐶 + ℎ 𝑙𝑛𝑅𝐸𝐸𝑅1 + +𝜇 + 𝜏 + 𝜀 (Equation 2) Where XC is real exports of China to African countries, XR real exports of the rest of the world
(without China) to African countries. RERC is real exchange rates of African countries vis-à-vis China, REER1 real effective exchange rates of African countries relative to the ten biggest import partners (without China).
In order to estimate the global effect of the real exchange rates, we drop the exports variables from the equations 1 and 2.
𝑙𝑛𝑀𝑉𝐴 = 𝑎 + 𝑏𝑙𝑛𝑃𝐶 + 𝑐 ln 𝐼𝑁𝐹 + 𝑑𝑙𝑛𝐹 + 𝑒𝐺 + 𝑓𝑙𝑛𝐸 + 𝑔𝑙𝑛𝑅𝐸𝐸𝑅𝑖𝑡 + 𝜇 + 𝜏 + 𝜀 (Equation 3) 𝑙𝑛𝑀𝑉𝐴 = 𝑎 + 𝑏𝑙𝑛𝑃𝐶 + 𝑐 ln 𝐼𝑁𝐹 + 𝑑𝑙𝑛𝐹 + 𝑒𝐺 + 𝑓𝑙𝑛𝐸 + 𝑔 𝑙𝑛𝑅𝐸𝑅𝐶𝑖𝑡 + 𝑔 𝑙𝑛𝑅𝐸𝐸𝑅1𝑖𝑡 + +𝜇 + 𝜏 + 𝜀 (Equation 4) We have assumed that the impact of the appreciation of real exchange rates of African currencies on manufacturing may be positive. Nevertheless, there is a time when it is likely that improvement in firm productivity no longer compensates the rise of the relative cost of labor. The elasticity of manufactured value added relative to RER may be positive, but decreasing and even reversed as appreciation is rising. In order to test this hypothesis we introduce the square of the RER if the elasticity is positive and statistically significant. We suppose here that it is the case of the real exchange rate vis-à-vis China.
17
𝑙𝑛𝑀𝑉𝐴 = 𝑎 + 𝑏𝑙𝑛 𝑙𝑛𝑃𝐶 + 𝑐𝑙𝑛𝐼𝑁𝐹 + 𝑑𝑙𝑛𝐹 + 𝑒𝐺 + 𝑓𝑙𝑛𝐸 + +𝑓 𝑅𝐸𝑅𝑐𝑖𝑡 +
𝑓 𝑙𝑛𝑅𝐸𝑅𝑟𝑖𝑡 + 𝑔𝑙𝑛𝑅𝐸𝑅 𝑐𝑖𝑡 + +𝜇 + 𝜏 + 𝜀 (Equation 5)
3.2 Dataset
We apply econometric analysis to a panel data for 44 African countries over the period 2000 to 2015. The first year corresponds to the first China/Africa Cooperation Forum and the choice of African countries depends on data availability. We were obliged to remove nine African countries (Botswana, Carbo Verde, Djibouti, Equatorial Guinea, Eritrea, Lesotho, Namibia, Somalia, South Soudan, Swaziland and Zimbabwe) because of lack of data11.
Real manufacturing value added
The manufacturing value added is the net output of manufacturing industries belonging to the International Standard Industrial Classification (ISIC) divisions 15-37 after summing all outputs and subtracting intermediate inputs. The data originate from the World Bank’s World
11 Either for the manufactured value added (Djibouti, Equatorial Guinea, Eritrea) or for the origin of the
imports used for the calculation of real effective exchange rates (Botswana, Lesotho, Namibia, Swaziland, Zimbabwe), or both of them (Somalia).
18
Development Indicators and the National Accounts Main Aggregates Database of the United Nations12 and are in 2005 national currencies13.
Figure 6 shows the high diversity of situations of African countries: the annual average growth of manufactured value added is 4.2% between 2000 and 2015, ranging from -6.2 % in Libya to +14% in Angola.
The control variables
Private consumption is real household expenditure in 2005 national currencies, taken from the United Nations Statistical Division. It represents the size of the domestic market and allows us to control for the various size of each African economy14.
12 It would be relevant to separate manufactured production into intermediate or capital goods from final
goods, but the data are unavailable. UNIDO INDSTAT published some data on sectorial manufacturing output, but available only for six African countries (Eritrea, Kenya, Malawi, Morocco, Senegal and South Africa) over the period from 2000 to 2011. World Development Indicators publishes also the share in manufacturing value added of textile and clothing sector and of machine and transport equipment sector, but it is only available for some countries and for a few years. These data unfortunately are not permitting econometric investigation.
13 The data of the World Bank are in 2005 constant dollars, obtained by dividing MVA in 2005 local
currency by the exchange rates relative to dollar in 2005. Here we come back to local currencies. Therefore, MVA is expressed, as well as private consumption, in local currency. If we had expressed MVA and private consumption both in 2005 dollars, this would not change the coefficients of explanatory variables, except for the constant terms.
14 We prefer this formulation to a division of manufacturing value added and imports by GDP or by
19
The level of infrastructure is measured by the African infrastructure development index calculated by the African Development Bank (2013, 2016), which includes transport, electricity, ICT, water and sanitation.
Financial development is the ratio of liquid liabilities (M3) relative to GDP; this comes from Financial Development and Structure Dataset and Global Financial Development (the World Bank). We have also tried the ratio of private sector credit to GDP, which is the other usual indicator of financial development, but it was not significant, probably because banks’ loans to small or medium-sized businesses are few. In fact, deposit accounts are more widespread. This result is consistent with that of Guillaumont and Kpodar (2011) on the impact of financial development on the reduction of poverty.
The variable “political stability and absence of violence” is taken from Kaufmann et al (2010) and is calculated each year by the World Bank.15 This variable has estimated values
ranging from -2.5 to +2.5, with a higher value indicating better governance. Kaufmann et al (2010) did not report the data for 2001; we approximate it as the average of the political stability and absence of violence in 2000 and 2002.
15 Kaufmann et al (2010) propose six measures of governance quality: voice and accountability, political
stability and absence of violence or terrorism, government effectiveness, regulatory quality, rule of law
and control of corruption (for detailed data, see
http://info.worldbank.org/governance/wgi/pdf/wgidataset.xls). It seems to us that political stability and absence of violence or terrorism is particularly relevant in the African context marked by political instability and civil wars. In any case, the results of the estimations are similar with the six measures, which in reality are co-related.
20
Education is the ratio of secondary school pupil enrolment to population, using data from UNESCO.16 We used forward and backward extrapolation to fill in the missing
observations.
Exports of manufactured goods to African countries
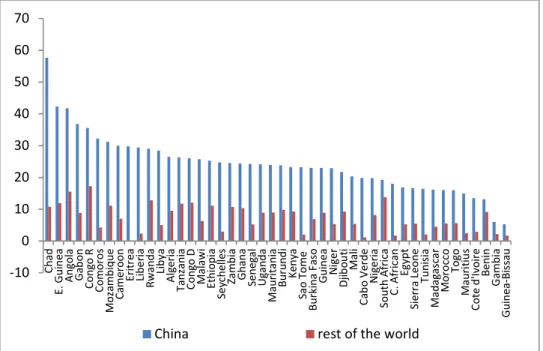
The volume of the exports of manufactured goods are equal to the exports of manufactured goods by China and by the rest of the world to African countries in US dollars provided by UN COMTRADE statistics, deflated by import unit value of African countries and converted in 2005 national currencies. Figure 7 shows again the great diversity of African countries as for the rates of growth of the exports of manufactured goods by China and by the rest of the world, and everywhere China’s exports dominate.
Real exchange rates
Real exchange rates are nominal exchange rates of African countries against their import partners (price of the national currency expressed in foreign currency) multiplied by the relative consumer prices between African countries and their import partners, using the data issued from IMF International Financial Statistics. An increase means a real appreciation of African currencies. As for real effective exchange rates of African countries, we consider the ten main import partners of manufactured goods to each African country. We have measured the weights as the shares of the imports of manufactured goods from each import partner in the total imports
16Barro-Lee’s data on educational attainment would be a better measure of the level of education, but
these data are only available for 20 countries and the years 2000, 2005 and 2010 during the studied period. Even though the data on secondary enrolment are more complete, they still have many missing values.
21
of the ten most important import partners of manufactured goods of African countries on average over the 2008-2012 period.
The great diversity of variations of African real exchange rates, as well as manufactured values added, is conducive to an econometric estimation (cf. Fig. 4 and 5 above). As all the variables, except political stability, are in logarithms, their coefficients represent elasticities. The means and standard deviations of the variables are in Table A2, and the definitions and sources of all the variables in Table A3 in the Appendix.
3.3 Estimation method and econometric tests
The principal potential econometric problem is the endogeneity of explanatory variables. All estimations on macroeconomic data meet this difficulty, due to simultaneity bias, to measurement errors of variables, which are a particularly serious problem in African countries, and to the risk of omitted variables. The obtained results of Durbin-Wu-Hausman test do not allow us to accept the null hypothesis of exogeneity of Africa’s real exchange rates and exports, as well as the private consumption; but not infrastructure, political stability and absence of violence. As the results of Pagan-Hall test do not allow us to accept the null hypothesis of homoscedasticity, the system estimator of the one-step Generalized Moment Model (GMM) of Blundel & Bond (1998) which is more efficient than IV/2SLS estimator is chosen17. The GMM system estimation approach combines an equation in levels in which
lagged first-difference variables are used as instruments and a first-difference equation in which
22
the instruments are lagged variables in levels18. We complete these lagged variables by the
addition of a dummy variable when country currency is pegged to the euro and a dummy variable when it is pegged to the dollar, which are used in Guillaumont Jeanneney and Hua (2015) to explain real exchange rates of African countries. We have tested the validity of the instruments by using the Sargan over-identification test, and by verifying the sensitivity of estimated coefficients to reductions in the number of instruments (Roodman 2009a, b). The results do not allow us to reject the hypothesis on their validity. The instruments are therefore independent of error terms.
Moreover as a precaution against the risk of simultaneity of the dependant and explanatory variables, we have lagged one-year real exchange rates, foreign exports to African countries and the other determinants of manufactured value added in the estimations19.
Before performing the econometric regressions, we need to know if the variables are stationary at an absolute level to avoid spurious results. We apply panel data unit root tests (Choi, 2001 and Im et al 2003) in which time trend and panel-specific means (fixed effects) options were used; the variables are lagged by one period. We subtract the mean of the series across panels from the series to mitigate the impact of cross-sectional dependence (Levin et al 2002). The results, reported in Table A4 of the Appendix, allow us to reject the null hypothesis that all the panels contain a unit root, so we can accept the hypothesis that the variables are
18 Blundel and Bond (1998) showed that this estimator is more powerful than the first-differences
estimators, derived from Arellano and Bond (1991), are, which give biased results in small samples with weak instruments.
19 As we have no clear theoretical arguments to suppose a one-year lag for the impact of real exchange
rate variations, we also estimate the same regressions without lags: the result are near even if some elasticities are lower, which is on line with the reality of some delay. The results are available on request.
23
stationary at an absolute level. The results of Chudik and Pesaran (2015) CD test of cross sectional dependence reported in table 3 suggest to accept the null hypothesis that the errors are weakly cross sectional dependent.
4. Results of estimation
We firstly use the panel data of 44 African countries over the period from 2000 to 2015 and GMM estimators to estimate the above equations. We then propose several kinds of robustness tests to check the stability of the obtained baseline results.
4.1 Baseline estimations
Table 3 presents the baseline econometric results. Domestic variables of African countries are the key factors that affect manufacturing value added. A rise of 1% in household consumption, infrastructure and financial development increases manufacturing value added by 0.23 %, 0.35%, and 0.15 % respectively (column 2 of Table 2). A political stability and absence of violence or terrorism exert significant positive effects on manufacturing value added. The effect of education is not statistically significant, probably due to the low quality of the data due to the extrapolation of many missing data.
The results confirm the assumption that the exports of manufactured goods by China and by the rest of the world are detrimental to African manufacturing. The estimated coefficient is higher (-0.07) for China’s exports than for that of the rest of the world (-0.05, column 2 of Table 2) as expected according to Fig. 1. The growth of China’s exports of manufactured goods to African countries (26%) was more than double the growth of exports by the rest of the world (12%) during the period from 2000 to 2015. The negative impacts on African manufacturing are thus much higher for China (with an annual average rate of decrease of manufacturing value added of -1.8% [-0.07 x 26%]) than that for the rest of the world (-0.6% [-0.05 x 12%]). The
24
total negative effect of foreign exports on African manufactured value added is -2.4% per year on average, which is more than the half of the annual average growth rate during the same period (4%).
Besides the above negative effects, the real exchange rates of African countries are positive and statistically significant (column 1 of Table 2). This positive effect comes from the real exchange rates of African countries vis-à-vis the renminbi. An appreciation of the real exchange rates of African countries relative to China is favorable to manufacturing while the change of African real exchange rates relative to the rest of the world is not significant (column 2 of Table 1). This positive and expected “renminibi effect” is explained by the fact that the appreciation of African currencies relative to the renminbi pushed inefficient enterprises to close down in favor of other enterprises more productive. It is also explained by the fact it reduced the price of current consumption goods, particularly those bought by the poor workers and then increases their wellbeing and their productivity. Indeed China became the first exporter of consumption goods to Africa since 2005. In 2015, more than a half of consumption goods exported by foreign countries to African countries is by China (52%). This positive effect could finally be due to the reduced cost of capital goods due to the strong growth of China’s exports of machines and transport equipment significantly less expensive than those exported by the rest of the world. China became the first exporter of capital goods to Africa since 2006. The resulting increasing capita labor ratio improved thus manufacturing productivity.
In the case of the relationship of African countries with other countries, it seems that the potential positive effect on productivity is not enough to compensate a traditional negative effect of a real appreciation of the currency on the competiveness of tradable sector.
In order to estimate the total impact of the change in African-China real exchange rates, we drop down the exports by China and by the rest of the world from the estimation (column 3 in Table 2). The coefficient of the real exchange rates of African countries against China
25
remains significant and slightly decreases (from 0.22 in column 2 to 0.19 in column 3 in Table 2). We expected this slight decrease (equal to -0.03), according to the positive elasticity of China’s exports and the negative elasticity of the exports of the rest of the world relative to the real appreciation of African currencies vis-à-vis the renminbi20. In brief, the direct positive
effect of the real appreciation of African currencies relative to the renminbi on manufacturing is slightly compensated by its positive impact on the volume of China’s exports to African countries, which are detrimental to African production. Simultaneously the positive effect of the real appreciation on manufacturing is reinforced by its negative impact of the volume of the exports of the rest of the world the decrease of which is favorable to African manufacturing activities. Therefore, the total impact of a real appreciation of African currencies against the renminbi is positive.
We have also tested if the significant positive impact of the real exchange rate of African currencies relative to the renminbi is decreasing and eventually reversed. When the appreciation of real exchange rate is strong, the rise of the cost of labor is no longer compensated by an improvement in the firm productivity. This appears when we introduce the real exchange rate and its square simultaneously into the regression (column 4 of Table 2)21. The turning point of
the real exchange rate is 124, suggesting that a high appreciation of African currencies
20 These elasticity are respectively respectively 0.87 and -0.53 (columns 1 et 2 Table 1). As the elasticity
of manufactured value added relative to China’s exports is -0.07 and relative to exports of the other foreign countries is -0,5 (column 2 Table 2), the indirect effect (through African imports) of African real exchange rate relative to the renminbi on its manufacturing is -0.06 [= -0.07 x 0.87] and 0.03 =[(-0.05)*(-0,53)], then -0.03.
21 The square of the real exchange rates of African countries relative to the rest of the world is also not
26
vis the renminbi exerts a negative effect on manufacturing, while a lower appreciation of the currencies has a positive effect. During the studied period from 2000 to 2015, 11 African countries (Angola, Egypt, Eritrea, Ethiopia, Guinea, Gambia, Kenya, Madagascar, Sudan, Congo D. R. and Zambia) had their currencies appreciated relative to the renminbi more than 24% compared to 2005, at least one year and on average 3.5 years.
4.2 Robustness tests
Besides structural variables, exports and real exchange rates used in the baseline estimations, other elements may also have an impact on manufacturing. To test the stability of the obtained results, we do several kinds of robustness tests. First, as the renminbi was pegged to the US dollar from 2000 to 2007, the evolution of the real exchange rates of African countries relative to China and to the United-States is very similar during this period (Figure 7). Then we distinguish the real exchange rates vis-à-vis China and vis-à-vis the United-States and their respective exports in order to be sure of capturing a renminbi effect and not a dollar effect. Second, we search to capture the competition of foreigners at a disaggregated level and calculate new (micro) real effective exchange rates. Third, external commercial policies can influence relative prices besides exchange rate policy. We introduce in the regression some trade policy variables. Fourthly, to make sure that some peculiar countries with very small or high manufacturing sector or North African countries are not driving the results, we drop several countries from the sample. .
Impacts of real exchange rates of African countries relative to the US dollar
The evolution of the average real exchange rates of African countries vis-à-vis China and vis-à-vis the United States was similar from 2000 to 2007 when the renminbi was pegged to the US dollar, but was different after 2007 (See Fig. 8). According to equation 6, we introduce
27
separately the real exchange rates vis-à-vis China and vis-à-vis the United States and their respective exports in order to distinguish the renminbi effect from a potential dollar effect.
𝑙𝑛𝑀𝑉𝐴 = 𝑎 + 𝑏𝑙𝑛𝑃𝐶 + 𝑐 ln 𝐼𝑁𝐹 + 𝑑𝑙𝑛𝐹 + 𝑒𝐺 + 𝑓𝑙𝑛𝐸 + 𝑔 𝑙𝑛𝑋𝑐 +
𝑔 𝑙𝑛𝑋𝑢𝑠 + +𝑔 𝑙𝑛𝑋𝑟2 + ℎ 𝑙𝑛𝑅𝐸𝑅𝑐 + ℎ 𝑙𝑛𝑅𝐸𝑅𝑢𝑠 + ℎ 𝑙𝑛𝑅𝐸𝐸𝑅𝑟2 + 𝜇 + 𝜏 + 𝜀 (Equation 6)
Where Xc are the exports of manufactured goods by China to African countries: Xus are the exports of manufactured goods by the United Statesto African countries; Xr2 are the exports from the rest of the world except China and the United-States. RERc is the real exchange rate vis-à-vis China, RERus is the real exchange rate vis-à-vis the US dollar, REERr2 is the real effective exchange rate vis-à-vis ten main import partners without China and the United-States.
The results are given in Table 4 columns 1 and 2. Neither the real exchange rates against the dollar nor the American exports to African countries have significant impact on African manufacturing. The coefficients of the exports of China and of its bilateral real exchange rates vis-à-vis African countries remain identical. We found that the impact of the exports of the rest of the world is negative and significant, but not for the real effective exchange rate of the rest of the world.
Impacts of micro real exchange rates of African countries
We have now calculated real effective exchange rates at the level of four digits of Comtrade according to the classification of HS4. For each type of manufactured goods imports, the weights are the shares of African imports from one partner in the total imports from the ten most important partners of this type of manufactured goods. We have aggregate these sectoral real effective exchange rates in function of the relative importance of each type of manufactured goods in the imports of each African country.
28
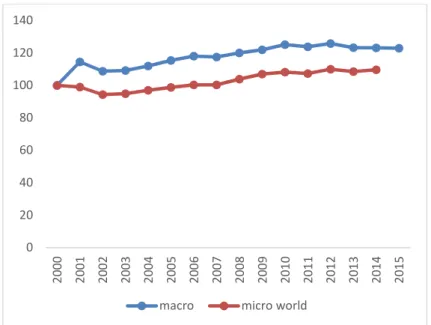
These new (micro) real effective exchange rates of African countries have on average appreciated lesser than the previous (macro) real effective exchange rates. (See Fig. 9). The columns 3 and 4 of Table 4 give the results, which are similar to those of columns 1 and 2, of Table 3.
Impacts of extern commercial policies22
Beside exchange rate policy, external commercial policies can influence relative prices. Some African countries have signed agreements to boost their exports. First, The African Growth and Opportunity Act (AGOA) signed with the United States, facilitates exports from sub-Saharan African countries to the US market by exempting the exported goods from customs duties. About thirty countries are beneficiaries of AGOA, the United-States revise the list each year, which adds and excludes countries23. De Melo and Portugal-Perez (2014) showed a
positive effect of AGOA on clothing exports from African countries to the United States.
Second, The Everything But Arms (EBA) Initiative proposed by the European Union allows all goods from 48 least developed countries (LDCs) including 33 sub-Saharan African
22 African states use customs duties and sometimes quotas to protect their national production. The
amount of imports takes into account these practices. Moreover, most of African countries belong to customs unions, which can stimulate imports as well as exports with neighboring countries. The impact of these agreements on intra-union trade remains de facto weak as African intra trade is very low (Giovannetti and Sanfilippo, 2009). We expect that the impact of these trade policy variables on manufactured value added is marginal as manufactured goods are essentially sold on domestic markets. Their effects are captured by individual fixed effects as the geographical coverage of unions (notably WAEMU and CEMAC, the most achieved unions) is globally stable during the period of estimation.
29
countries to enter the European Union (EU) duty free, rights and quota-free, with the exception of weapons. The impact of this agreement is limited for the manufacturing production of African, Caribbean and Pacific (ACP) countries since many industrial goods were already exempt from European customs duties under the Generalized System of Preferences and the Cotonou Convention (Vahl, 2001). Since the Everything But Arms Initiative (EBA) also applies to fifteen non-ACP LDCs, it may exert a negative effect on exports of manufactured goods from ACP countries now competing with goods from non-ACP countries. The share of exports of manufactured goods from ACP LDC countries to the EU in total LDC exports decreased from 16% in 2001 to 6% in 2015, while those of Asian LDCs grew by 84% to 95%. Gradeva and Martinez-Zarzoso (2015) found a negative effect of the EBA Initiative on exports of industrial goods from ACP and LDC countries to the European Union, a result consistent with ours.
Finally, since January 2005, China has applied a zero tariff to certain products. It imports from 25 African countries with little developed and diplomatic relations with China. The list of beneficiary countries has increased over time as well as the number of products (Temitayo, 2017).
We add three dummy variables named AGOA, EBA and CET, which are equal to one respectively for the years in which the African countries have received AGOA beneficiary status from the United States, for the 34 African Least developing countries (LDCs)24 and for
beneficiary countries of China’s zero tariffs, and equal to zero for the rest.
24 LDCs are defined by the United Nations and the composition of the category is quite stable. For the
moment LDCs are: Angola, Benin, Burkina Faso, Burundi, Cape-Verde, Central African Rep., Chad, Comoros, Congo Dem Rep, Djibouti, Equatorial Guinea, Eritrea, Ethiopia, Gambia, Guinea, Guinea-Bissau, Lesotho, Liberia, Madagascar, Malawi, Mali, Mauritania, Mozambique, Niger, Rwanda, Sao Tome and Principe, Senegal, Sierra Leone, Somalia, Sudan, Tanzania, Togo, Uganda and Zambia.
30
It appears (column 5 of Table 4) a significant impact of the agreements with United States, European Union and China impact, which is positive for AGOA but negative for EBA, and insignificant for China’s zero tariff policies. The introduction of these three tariff variables did not modify the other results.
Impact of extreme values and Nord Africa
The countries having the most or the least important manufacturing production may also affect the baseline results. On the one hand, we exclude two major manufactures countries (South Africa and Mauritius) in the sample. South Africa is the largest and the most developed economy with the most advanced manufactured sector on the African continent. It is the largest importer of China’s goods. Mauritius is also a strong manufactures producer. Rodrik (2016) found that the fact of including and excluding Mauritius greatly changed his results. On the other hand, we removed two small manufactures countries (Seychelles and Gambia) from the sample. These two countries have few manufacturing activities. The results are not modified (columns 6 and 7 of Table 3). Finally, Egypt, Morocco and Tunisia are three major manufactures in North Africa. We move the three countries from the sample. Once again, the obtained results are very similar.
In conclusion, the five robustness tests have confirmed the specific “renminbi” effect.
5. Conclusion
In this paper, we focus on the impacts of the real exchange rates between African countries and China on African manufacturing value added to compare them to those of the rest of the world. To this end, we use a panel data of 44 African countries over the period from 2000 to 2015.
31
domestic market, improvements in domestic infrastructure and in financial development, political stability and absence of violence are positive factors of African manufacturing industry while the volume of China’s exports have a negative impact which is higher than that of the rest of the world.
Although a real appreciation of African currencies increases exports of China and of the rest of the world to African countries, a moderate real appreciation of African currencies relative to the renminbi influences manufactured value added positively. This positive effect does not exist for the real exchange rates of African countries relative to the others foreign countries.
We explain the positive manufacturing effect of an appreciation of African currencies against the renminibi by several factors that lead to an increase of firm’s productivity higher than the negative effect. Firstly, African enterprises are pushed to decrease or even close the less productive units of production to the benefit of the most efficient. Secondly, the reduced price of imported consumer goods from China raises the standard of living of poor workers and therefore improves their productivity. Finally, the reduced cost of imported machine and transport equipment from China rises the capital/labor ratio.
A systematic real depreciation of African exchange rates relative to the renminbi would probably not be appropriate, as it would have a negative impact on the productivity of local firms. However, a big real appreciation, which pushes the real exchange rate index beyond 124 (2005=100) could exert a negative effect on African manufacturing, as predicted by the traditional theory. We observe that during the studied period 2000-2015, 11 African countries had their currencies appreciated more than 80% relative to the renminbi compared to 2005 at least one year.
These results disapprove some overvaluations of African currencies but, for all that, they do not support in favor of a systematic depreciation of African currencies. As well as exchange
32
rate policies, the improvements in infrastructure, financial development, education and political stability and absence of violence, in which African governments should play a leading role, seem essential for the development of manufacturing in African countries.
References
Acemoglu, D., Autor, D., Dorn, D., Hanson, G. H., & Price, B. (2016). Import competition and the great US employment sag of the 2000s. Journal of Labor Economics, 34(S1): S141-S198.
African Development Bank (2013). The Africa Infrastructure AIDI Development Index (AIDI). AfDB Economic Brief, Abidjan, Côte d'Ivoire, www.afdb.org.
African Development Bank (2016). The Africa Infrastructure AIDI Development Index (AIDI). AfDB Economic Brief, Abidjan, Côte d'Ivoire, www.afdb.org.
Autor, D. H., Dorn, D., & Hanson, G. H. (2013). The China syndrome: Local labor market effects of import competition in the United States. American Economic Review, 103(6), 2121-2168.
Autor, D. H., Dorn, D., & Hanson, G. H. (2016). The China shock: Learning from labor market adjustment to large changes in trade. Annual Review of Economics; 2016, 8, 205-240. Bräutigam D. and X. Y. Tang (2014) “Going Global in Groups”: Structural Transformation and
China’s Special Economic Zones Overseas, World Development, 63, November, 78-91. Cadot O., De Melo J., Plane P., Wagner L. & Woldemichael M. T. (2016). Industrialisation et
transformation structurelle: l’Afrique Sub-saharienne peut-elle se développer sans usines? Revue d’Economie du Développement 24(2).
Carey. K., Gupta S. & Jacoby U. (2007). Sub-Saharan Africa: Forging New Trade Links with Asia. Washington DC: International Monetary Fund.
33
Choi I. (2001). Unit root tests for panel data. Journal of International Money and Finance, 20(2), April, 249-272.
Eichengreen B., Yeongseop R. & Tong H. (2007). China and the Exports of Other Asian Countries. Review of World Economics / Weltwirtschaftliches Archiv. 143(2), 201-226. Edwards L. & Jenkins R. (2015). The Impact of Chinese Import Penetration on the South
African Manufacturing Sector. The Journal of Development Studies. 51(4), 447-463. Gabriel O. & Ahiuma-Young V. (2008). How Nigerian textiles failed to tap into the $31bn US
booming export garment market. Vanguard (Lagos), April 14.Gebre-Egziabher T. (2007). Impacts of Chinese imports and coping strategies of local producers: the case of small-scale footwear enterprises in Ethiopia”, The Journal of Modern African Studies. 45 (04), December, 647-649, Cambridge University Press.
Gebre-Egziabher T. (2009). “The developmental impact of Asian drivers on Ethiopia with emphasis on small-scale footwear producers”. The World Economy 32(11): 1613–1637. Gelb A., C. Meyer et V. Ramachandran (2013), “Does Poor Mean Cheap? A comparative Look at Africa’s industrial Labor Costs”, Center for Global Development, Working Paper 325.
Giovannetti G. & Sanfilippo M. (2009). Do Chinese Exports Crowd-Out African Goods? An econometric analysis by country and sector. European Journal of Development Research Special Issue. 21(4), 506-530.
Golub S., Ceglowski J., Mbaye A. & Prasad V. (2018). Can Africa compete with China in manufacturing? The role of relative Unit Labor costs. The World Economy, 41 (6), June, pp. 1508-1528.
Greenaway D., Mahabir A. & Milner C. (2008). Has China displaced other Asian countries' exports? China Economic Review, 19 (2), June 152–169.
34
Guillaumont. P. & Guillaumont Jeanneney S. (1991). Exchange Rate Policies and the Social Consequences of Adjustment in Africa. in A. Chhibber and S. Fischer (eds). Economic Reform in Sub-Saharan Africa. Washington. DC: The World Bank. 13-24.
Guillaumont Jeanneney. S. & Hua P. (2011). How Does Real Exchange Rate Influence China’s Labour Productivity? China Economic Review 22 (4): 628-645.
Guillaumont Jeanneney. S. & Hua P. (2015). China’s African Financial Engagement. Real Exchange Rates and Trade between China and Africa. Journal of African Economies 24(1): 1–25.
Guillaumont Jeanneney, S. & Kpodar K. (2011). Financial Development and Poverty Reduction: Can There be a Benefit without a Cost? Journal of Development Studies, vol. 47(1), 143-163.
Hausman. J. A. and Taylor W. E. (1981). Panel data and unobservable individual effects. Econometrica 49(6): 1377–1398.
Hua P. (2007). Real exchange rate and manufacturing employment in China. China Economic Review, 18, 3, 335-353.
Im. K. S., Pesaran M. H. & Shin Y. (2003). Testing for Unit Roots in Heterogeneous Panels. Journal of Econometrics 115: 53–74.
Jenkins R. (2015). Is Chinese Competition causing Deindustrialization in Brazil?. Latin American Perspectives, 205, 42 (6), November, 42-63.
Kaplinsky, R., & Morris, M. (2009). The Asian drivers and SSA: Is there a future for export-oriented African industrialisation? The World Economy, 32(11), 1638–1655.
Kaufmann.D.. Kraay A. & Mastruzzi M. (2010). The Worldwide Governance Indicators: A Summary of Methodology. Data and Analytical Issues. World Bank Policy Research Working Paper No. 5430. Washington. DC.
35
Lacovone L., Rauch F. & Winters L. A. (2013). Trade as an engine of creative destruction: Mexican experience with Chinese competition. Journal of International Economics, 89, 379-392.
Leibenstein.H. (1957). Economic Backwardness and Economic Growth. New York: Wiley. Leibenstein.H. (1966). Allocative Efficiency versus X-Efficiency. American Economic Review
56(3): 392-415.
Levin. A. Lin C. F. & Chu C. S. J. (2002). Unit Root Tests in Panel Data: Asymptotic and Finite-Sample Properties. Journal of Econometrics 108: 1–24.
Mcmillan M. Rodrik D. & Verduzco-Gallo I. (2014). Globalization, Structural Change, and Productivity Growth with an Update on Africa. World Development, 63, 11-32.
de Melo J. & Portugal-Perez A. (2012). Preferential Market Access Design: Evidence and Lessons from African Apparel Exports to the US and to the E.U. World Bank Policy Research Working Paper No. 6357.February.
Mijiyawa A. G. (2017). Drivers of Structural Transformation: The case of the manufacturing Sector in Africa, World Development, 99, 141-159.
Morris M. and Einhorn (2008). Globalisation, welfare and competitiveness: The impacts of Chinese imports on the South African clothing and textile industry. Competition and Change. 12. 355-376.
Power R. (2008). What Does the Rise of China Do for Industrialisation in Sub-Saharan Africa?. Review of African Political Economy 35 (115).7-22.
Redi. O. (2009). From ashes, an industry reborn. Fortune (Addis Ababa). March 22.
Rodrik. D. (2008). The Real Exchange Rate and Economic Growth. Brookings Papers on Economic Activity 39(2): 365-412.
36
Sonobe. T., Akoten J. E. & Otsuka K. (2009). An exploration into the successful development of the leather-shoe industry in Ethiopia. Review of Development Economics 13(4): 719– 736.
Zhang T. and Puman O.Y. (2018). IS RMB appreciation a nightmare for the Chinese firms? An analysis on firm profitability and exchange rate, International Review of Economics and Finance, 54, 27-43.
37
Figure 1
Manufacturing impact of real exchange rate appreciation
Negative effect on manufacturing Positive effect on manufacturing
(Rise of the productivity)
Drop of the relative prices Shumpeterian rise of workers drop of price of of tradable goods creative destruction remuneration capital goods
38
Figure 2. Bilateral real exchange rate of African countries relative to China and their real effective exchange rates relative to their ten biggest import partners except China (weighted import average for African countries)
Note: A rise in the curve means an appreciation of the real exchange rates of African countries. See section 3.2 for the calculation of real effective exchange rates.
Source: IMF International Financial Statistics, and UN Comtrade 0 20 40 60 80 100 120 20 00 20 01 20 02 20 03 20 04 20 05 20 06 20 07 20 08 20 09 20 10 20 11 20 12 20 13 20 14 20 15 (2 00 5= 10 0)
39
Figure 3: Annual rates of variation of real appreciation of exchange rates of African countries vis-à-vis China and their other main partners on average over the 2000-2015 period
Note: A positive value means an appreciation of the real exchange rates of African countries. Source: IMF International Financial Statistics, and UN Comtrade.
-8 -6 -4 -2 0 2 4 6 8 10 Co ng o D Li by a G am bi a M al aw i Se yc he lle s Tu ni si a G ha na Si er ra L eo ne Ta nz an ia Al ge ria M or oc co So ut h Af ric a Rw an da U ga nd a Se ne ga l M oz am bi qu e G ab on M au rit an ia M au rit iu s G ui ne a N ig er Ca bo V er de Bu ru nd i Ca m er oo n M al i G ui ne a-Bi ss au Bu rk in a Fa so M ad ag as ca r Eg yp t Co te d 'Iv oi re To go Ch ad Co m or os Be ni n Li be ria Co ng o, R ep . Ce nt ra l A fr ic an … Et hi op ia E G ui ne a Sa o To m e Za m bi a N ig er ia Ke ny a Su da n Er itr ea An go la
40
Figure 4. Statistical relationships between real manufacturing values added of African countries and the exports of manufactured goods by China and by the rest of the world to African countries relative to their real GDP (expressed in 2005 national currencies) for the years 2000 to 2015
Note: The estimation is on the panel data for 44 African countries over the period 2000 to 2015, with individual and time period effects.
41
Figure 5. Statistical relationship between African manufacturing labor productivity and their real exchange rates relative to China during 2000-2012 period
Notes: estimation for 13 African countries with year and country effects. Source: Groningen Growth at Development Center.
42
Figure 6. Annual average growth rates of manufactured value added (2005 constant) of African countries (2000-2015)
Source: World Bank World Development Indicators and United Nations. -10 -5 0 5 10 15 L ib ya E ri tr ea B ur un di Se yc he lle s C ot e d' Iv oi re M au ri ta ni a B en in A lg er ia B ur ki na F as o G ui ne a M au ri ti us G ui ne a-B is sa u C ha d C am er oo n So ut h A fr ic a G am bi a C ab o V er de Se ne ga l C en tr al A fr ic an T un is ia M ad ag as ca r G ab on C om or os M or oc co Sw az ila nd K en ya Si er ra L eo ne T og o G ha na D jib ou ti E gy pt N ig er Sa o T om e P . L ib er ia C on go D R M oz am bi qu e Z am bi a M al aw i U ga nd a M al i R w an da T an za ni a C on go R E th io pi a N ig er ia A ng ol a
43
Figure 7. Annual average growth rates of the volumes of the exports of manufactured goods from China and the rest of the world to African countries (2000-2015)
Source: COMTRADE, the United Nations. -10 0 10 20 30 40 50 60 70 Ch ad E. G ui ne a An go la G ab on Co ng o R Co m or os M oz am bi qu e Ca m er oo n Er itr ea Li be ria Rw an da Li by a Al ge ria Ta nz an ia Co ng o D M al aw i Et hi op ia Se yc he lle s Za m bi a G ha na Se ne ga l U ga nd a M au rit an ia Bu ru nd i Ke ny a Sa o To m e Bu rk in a Fa so G ui ne a N ig er Dj ib ou ti M al i Ca bo V er de N ig er ia So ut h Af ric a C. A fr ic an Eg yp t Si er ra L eo ne Tu ni sia M ad ag as ca r M or oc co To go M au rit iu s Co te d 'Iv oi re Be ni n G am bi a G ui ne a-Bi ss au
44
Figure 8: Average exchange real exchange rates of African countries vis-à-vis China and vis-à-vis the United States
0 20 40 60 80 100 120 140 20 00 20 01 20 02 20 03 20 04 20 05 20 06 20 07 20 08 20 09 20 10 20 11 20 12 20 13 20 14 20 15 (2 00 5= 10 0) China/africa US/Africa
45
Figure 9. Evolution of macro and micro real effective exchange rates of African countries relative to the rest of the world except China
0 20 40 60 80 100 120 140 20 00 20 01 20 02 20 03 20 04 20 05 20 06 20 07 20 08 20 09 20 10 20 11 20 12 20 13 20 14 20 15