HAL Id: hal-02555475
https://hal.sorbonne-universite.fr/hal-02555475
Submitted on 27 Apr 2020
HAL is a multi-disciplinary open access
archive for the deposit and dissemination of
sci-entific research documents, whether they are
pub-lished or not. The documents may come from
teaching and research institutions in France or
abroad, or from public or private research centers.
L’archive ouverte pluridisciplinaire HAL, est
destinée au dépôt et à la diffusion de documents
scientifiques de niveau recherche, publiés ou non,
émanant des établissements d’enseignement et de
recherche français ou étrangers, des laboratoires
publics ou privés.
HIV-positive patients: A collaborative analysis of cohort
studies
Adam Trickey, Margaret May, M John Gill, Sophie Grabar, Janne
Vehreschild, Ferdinand W.N.M. Wit, Fabrice Bonnet, Matthias Cavassini,
Sophie Abgrall, Juan Berenguer, et al.
To cite this version:
Adam Trickey, Margaret May, M John Gill, Sophie Grabar, Janne Vehreschild, et al.. Cause-specific
mortality after diagnosis of cancer among HIV-positive patients: A collaborative analysis of cohort
studies. International Journal of Cancer, Wiley, 2020, 146 (11), pp.3134-3146. �10.1002/ijc.32895�.
�hal-02555475�
Cause-speci
fic mortality after diagnosis of cancer among
HIV-positive patients: A collaborative analysis of cohort studies
Adam Trickey 1, Margaret T. May1, M. John Gill2, Sophie Grabar 3,4, Janne Vehreschild5,6, Ferdinand W.N.M. Wit7,8,9, Fabrice Bonnet10,11, Matthias Cavassini12,13, Sophie Abgrall14,15,16, Juan Berenguer17, Christoph Wyen5, Peter Reiss7,8,9, Katharina Grabmeier-Pfistershammer18, Jodie L. Guest19,20, Leah Shepherd21, Ramon Teira22,
Antonella d’Arminio Monforte23, Julia del Amo24, Amy Justice25,26, Dominique Costagliola3and Jonathan A.C. Sterne1
1Population Health Sciences, University of Bristol, Bristol, United Kingdom 2Division of Infectious Diseases, University of Calgary, Calgary, Alberta, Canada
3Sorbonne Université, INSERM, Institut Pierre Louis d’Épidemiologie et de Santé Publique (IPLESP), Paris, France
4Unité de Biostatistique et d’Épidémiologie Groupe Hospitalier Cochin Broca Hôtel-Dieu, Assistance Publique Hôpitaux de Paris (AP-HP),
Université de Paris, Paris, France
5Department I for Internal Medicine, University Hospital of Cologne, Cologne, Germany 6German Centre for Infection Research, Partner Site Bonn-Cologne, Cologne, Germany 7Stichting HIV Monitoring, Amsterdam, The Netherlands
8Department of Global Health, Amsterdam University Medical Centers, University of Amsterdam, Amsterdam, The Netherlands 9Amsterdam Institute for Global Health and Development, Amsterdam, The Netherlands
10University of Bordeaux, ISPED, INSERM U1219, Bordeaux, France 11CHU de Bordeaux, Bordeaux, France
12Service of Infectious Diseases, Lausanne University Hospital, Lausanne, Switzerland 13University of Lausanne, Lausanne, Switzerland
14Department of Internal Medicine, Antoine Béclère Hospital, Clamart, France 15University of Paris Saclay, Paris-Sud University, UVSQ, Le Kremlin-Bicêtre, France 16CESP INSERM U1018, Le Kremlin-Bicêtre, France
17Hospital General Universitario Gregorio Marañón, Instituto de Investigación Sanitaria Gregorio Marañón (IiSGM), Madrid, Spain 18Medical University of Vienna, Vienna, Austria
19Rollins School of Public Health, Atlanta, GA 20Emory School of Medicine, Atlanta, GA
21Institute of Global Health, University College London, London, United Kingdom 22Unit of Infectious Diseases, Hospital Sierrallana, Torrelavega, Spain
23Clinic of Infectious Diseases and Tropical Medicine, San Paolo Hospital, University of Milan, Milan, Italy 24National Epidemiology Center, Carlos III Health Institute, Madrid, Spain
25Yale University School of Medicine and Public Health, New Haven, CT 26VA Connecticut Healthcare System, West Haven, CT
People living with HIV (PLHIV) are more likely than the general population to develop AIDS-defining malignancies (ADMs) and several non-ADMs (NADMs). Information is lacking on survival outcomes and cause-specific mortality after cancer diagnosis among PLHIV. We investigated causes of death within5 years of cancer diagnosis in PLHIV enrolled in European and North American HIV cohorts starting antiretroviral therapy (ART)1996–2015, aged ≥16 years, and subsequently diagnosed with cancer. Cancers were grouped: ADMs, viral NADMs and nonviral NADMs. We calculated cause-specific mortality rates (MR) after
Additional Supporting Informationmay be found in the online version of this article.
Key words:PLHIV, cohort, mortality, cancer, ADM, NADM
Abbreviations:ADMs: AIDS-defining malignancies; aMRR: adjusted mortality rate ratio; ART: antiretroviral therapy; ART-CC: Antiretroviral Therapy Cohort Collaboration; CoDe: coding of death in HIV; COHERE: Collaboration of Observational HIV Epidemiology Research in Europe; HICDEP: HIV Cohorts Data Exchange Protocol; IQR: interquartile range; LTFU: lost to follow-up; MRR: mortality rate ratio; NADMs: non-AIDS-defining malignancies; PLHIV: people living with HIV; SCC: squamous cell carcinoma
This is an open access article under the terms of the Creative Commons Attribution License, which permits use, distribution and reproduction in any medium, provided the original work is properly cited.
DOI:10.1002/ijc.32895
History:Received 1 Aug 2019; Accepted 20 Dec 2019; Online 31 Jan 2020
Correspondence to:Adam Trickey, E-mail: adam.trickey@bristol.ac.uk
International Journal of Cancer
Infectious
Causes
of
diagnosis of specific cancers and compared 5-year survival with the UK and France general populations. Among 83,856 PLHIV there were4,436 cancer diagnoses. Of 603 deaths after ADM diagnosis, 292 (48%) were due to an ADM. There were 467/847 (55%) and 74/189 (39%) deaths that were due to an NADM after nonviral and viral NADM diagnoses, respectively. MR were higher for diagnoses between1996 and 2005 versus 2006–2015: ADMs 102 (95% CI 92–113) per 1,000 years versus 88 (78–100), viral NADMs 134 (106–169) versus 111 (93–133) and nonviral NADMs 264 (232–300) versus 226 (206–248). Estimated5-year survival for PLHIV diagnosed with liver (29% [19–39%]), lung (18% [13–23%]) and cervical (75% [63–84%]) cancer was similar to general populations. Survival after Hodgkin’s lymphoma diagnosis was lower in PLHIV (75% [67–81%]). Among ART-treated PLHIV diagnosed with cancer, MR and causes of death varied by cancer type, with mortality highest for liver and lung cancers. Deaths within5 years of NADM diagnoses were more likely to be from cancer than AIDS.
What’s new?
People with HIV live longer than they used to, thanks to advances in antiretroviral therapy. These improvements reduced the incidence of AIDS-defining malignancies, such as Kaposi’s sarcoma, but the increased life expectancy has led to more diagnoses of cancers not traditionally associated with HIV. Here, the authors studied cause-specific mortality among people with HIV diagnosed with cancer. For those people, within5 years after a cancer diagnosis, cause of death was more likely to be cancer than AIDS. Survival rates after diagnosis varied by cancer type, but were similar to rates among the general population.
Background
People living with HIV (PLHIV) are more likely to develop cancer than those not infected with HIV.1This is the case not only for AIDS-defining malignancies (ADMs), such as Kaposi’s sarcoma and non-Hodgkin’s lymphoma2but also for some non-AIDS-defining malignancies (NADMs) such as anal cancer.3,4The introduction of effective combination antiretro-viral therapy (ART) in 1996 led to a large decrease in inci-dence of ADMs, because of control of HIV-replication and improvement of immune status.5 With further improvements in HIV care, particularly starting ART earlier in the course of HIV disease, the incidence of ADMs has continued to decline.6 Improvements treatment of HIV have resulted in PLHIV living longer,7increasing the risk of NADMs that are associated with age in the general population.8
The incidence of ADMs and NADMs among PLHIV has been well-studied2,9–11but there is a lack of information on sur-vival outcomes after specific cancer diagnoses. Few studies have analysed 5-year survival after specific cancer diagnoses among PLHIV12–20and they were limited to prognosis after diagnosis of ADMs,12,19 or included untreated PLHIV14,15 who have worse prognosis than those on ART.5 Little information is available on causes of death among PLHIV after diagnosis of cancer. Patterns of survival after cancer diagnosis are affected by several factors. Mortality rates vary considerably between different types of cancer and stages of cancer.21In the general population, a death after a diagnosis of cancer may be more likely due to that cancer than in PLHIV because of the compet-ing risks of death due to AIDS and other HIV-related condi-tions. There are also differences in the demographics of those diagnosed with cancer in the general population compared to PLHIV, which may explain differences in patterns of death.22,23
We studied cause-specific mortality after diagnosis of spe-cific cancers to answer the question: what do PLHIV diagnose with cancer die of? We also investigated changes over time in 5-year survival after cancer diagnosis in PLHIV and compared this with survival in the general population of the United Kingdom and France.
Materials and Methods
Participating cohorts
Data were combined from 10 HIV cohorts from Europe and North America that participate in the Antiretroviral Therapy Cohort Collaboration (ART-CC), which includes PLHIV aged ≥16 years who started ART after 1996.24
Ethics committees or institutional review boards approved the cohorts, which used standardised data collection methods, and followed-up patients at least every 6 months. Included cohorts (listed in the supplement) had information on diagnoses of both ADMs (Kaposi’s sarcoma, cervical cancer and non-Hodgkin’s lym-phoma) and NADMs (all other cancers) and had information on cause of death available on≥70% of deaths.
Data on cancer and mortality outcomes
Information on cancers was captured through medical records at routine follow-up and hospitalisation diagnostic codes. Cohorts validated cancer diagnoses, and provided dates of and reasons for hospitalisations, which were considered due to cancer if any of the reasons indicated cancer. Patients could be diagnosed with multiple types of cancer on the date of a hospitalisation. Available data on cancers was heterogeneous between cohorts. Six of the 10 cohorts included used medical records to gather information on cancer diagnoses, one cohort had linkage to a cancer registry, one provided treatment for
Infectious
Causes
of
both HIV and cancer in the same centre, one had cancer diag-noses reported to their database and verified by a clinician, and one had heterogeneous methods of collection across their sites (Supporting Information Table S1).
Cancer information in the form of ICD9 or ICD10 codes was translated to defined subcategories for cancers within HIV Cohorts Data Exchange Protocol (HICDEP) by AT, and then verified by a clinician (MJG). We classified oral cavity and pharynx squamous cell carcinoma (SCC), anal SCC, liver hepatocellular carcinoma, vagina SCC, vulva SCC, penis SCC and Hodgkin lymphoma as viral NADMs following Park et al.25(Supporting Information Table S2).
Information on mortality was gathered through linkage with vital statistics agencies and hospitals or physician report, and the active follow-up of participants. We used an adaptation of the Coding of Death in HIV (CoDe) project protocol (www. chip.dk/Tools-Standards/CoDe/About) to classify causes of death, as described previously.26 Deaths due to opportunistic infections secondary to complications of chemotherapy were classified as caused by cancer rather than infection or AIDS.
Eligibility of patients and definition of follow-up time
Eligible patients had a baseline CD4 cell count measured between 3 months before, and 2 weeks after, starting ART. Each cohort specified a date after which cancer data were deemed to be reliably collected: patients who initiated ART before then, or had cancer diagnoses before then, were excluded. Similarly, each cohort had a date before which cancer data were reliably col-lected: cancer diagnoses after this date, or patients starting ART following this, were excluded. Patients diagnosed with cancer before starting ART were excluded. Patients were followed up for a maximum of 5 years from the date of cancer diagnosis to the earliest of death, loss to follow-up or cohort-specific database administrative censoring. Patients with a gap of≥1 year between date last known to be alive and administrative censoring were considered lost to follow-up (LTFU) and were censored 6 months after their last recorded measurement. If a patient had multiple records of the same type of cancer, the second and sub-sequent records were assumed to be multiple instances of treat-ment or hospitalisations.
Statistical analysis
We compared characteristics at start of ART and at cancer diagnosis of patients who were diagnosed with an ADM, viral NADM and nonviral NADM. Because of the substantial improvements in life expectancy of PLHIV since the introduc-tion of ART, we stratified by period of cancer diagnosis (1996–2005 and 2006–2015).7
Individuals with diagnoses of multiple types of cancer could be in multiple groups. We tab-ulated the frequency of specific cancers by period of diagnosis. We investigated causes of death after diagnosis of ADMs, viral NADMs, nonviral NADMs and after the most frequent cancers with ≥30 diagnoses during each calendar period (cer-vical cancer, head and neck cancers, Hodgkin’s Lymphoma,
liver cancer, Kaposi’s Sarcoma, lung cancer and
non-Hodgkin’s Lymphoma). Patients diagnosed with multiple cancers or cancer groups were included in the analysis for each cancer or cancer group, from the corresponding date of diagnosis. However, if both cancers were the same type (e.g. both NADMs), the patient was included only once in the analysis for that group, from the date of diagnosis of thefirst cancer. A patient could be included in an analysis for cancer having been diagnosed with another type of cancer before or during the follow-up period: a sensitivity analysis included only patients diagnosed with one type of cancer. A sensitivity analysis also investigated excluding patients aged above 70 years of age at the time of cancer diagnosis.
For each cancer group, we used Cox survival regression models to estimate hazard ratios during the 5 years after can-cer diagnosis, by period of cancan-cer diagnosis (2006–2015 vs. 1996–2005) unadjusted and adjusted for CD4 count (0–99, 100–199, 200–349, 350–499, ≥500 cells/mm3
), HIV-1 RNA (0–499, 500–9,999, ≥10,000 copies/ml), and age (16–39, 40–49, 50–59, ≥60 years), all taken as the measurement closest to and before the date of cancer diagnosis, combined sex/transmission risk group, and stratified by cohort (ensuring that all comparisons are among patients in the same cohort).
For each cancer group and specific cancer, we used Poisson models to estimate mortality rates from all causes, AIDS, ADMs, NADMs, other causes (not cancer), and unclassifiable/ unknown causes during the 5 years after cancer diagnosis, separately for 1996–2005 and 2006–2015. Other causes of death included all of the other coded deaths that were not due to AIDS or cancers, for example, hepatitis, cardiovascular, sui-cide, and so on. NADM deaths were not split as viral or non-viral NADMs as often detailed enough coding information was not available. We estimated both crude and standardised mortality rates; standardised to the ART-CC population diag-nosed with cancer, by age, sex and HIV transmission risk group. In the analysis of liver cancer, we added viral hepatitis as a specific cause of death because the CoDe system classifies deaths from cancer associated with hepatitis under hepatitis rather than NADM. Separately for each cancer group and by calendar period of diagnosis, we used a competing risks framework to generate 5-year cause-of-death-specific cumula-tive incidence functions, which we plotted in a stacked graph.
We calculated 5-year survival after diagnosis of the seven most frequently occurring cancers between 2006 and 2015, and compared this to 5-year cancer survival in the general population in the United Kingdom (2009–2013) (https://www. cancerresearchuk.org/health-professional/cancer-statistics/survival) and France (2005–2010),27,28
standardised to the age and sex proportions of the ART-CC population diagnosed with the cancer. Kaposi’s sarcoma and non-Hodgkin’s lymphoma were excluded from this analysis as the burden among PLHIV drives the general population burden. For head and neck can-cers combined, detailed information on 5-year survival by age group was not available for the United Kingdom.
Infectious
Causes
of
Data availability
The data that support the findings of the study are property of the individual cohorts, which are listed on the ART-CC website (http://www.bristol.ac.uk/art-cc/whoswho/). For data availability, the individual cohorts should each be contacted and data will be made available upon reasonable request, where applicable.
Results
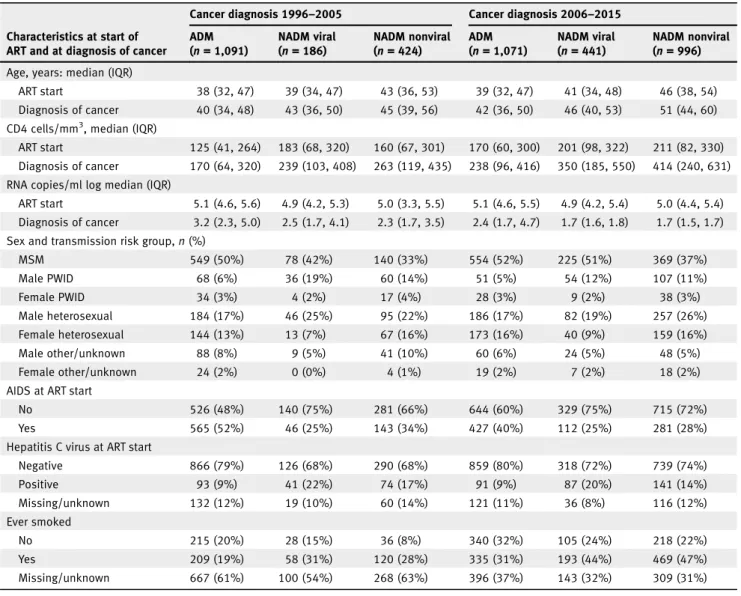
Records from 83,586 PLHIV providing 451,651 person-years of follow-up were analysed. We included 4,436 records of incident cancer for analysis, from 3,953 individual patients. Median follow-up time was 3.3 years fromfirst ADM diagno-sis (interquartile range [IQR]: 0.7–5.0), while from first non-viral NADM diagnosis it was 1.2 years (IQR: 0.3–3.6), and from first viral NADM diagnosis 2.3 years (IQR: 0.6–5.0). Table 1 shows the numbers of malignancies of different types recorded in 1996–2005 and 2006–2015, as well as characteris-tics of patients according to type of malignancy. Both median age and median CD4 count at cancer diagnosis were lower for individuals diagnosed with an ADM than with an NADM, and for viral NADM compared to nonviral NADM. Both median age and median CD4 count at cancer diagnosis increased between 1996 and 2005 and 2006–2015, in each cancer group. The viral load when starting ART was similar across cancer groups and the two time periods, but the viral load at diagnosis of cancer was higher for patients diagnosed with ADMs than for those diagnosed with NADMs. Patients diagnosed with ADMs were more likely to have AIDS when starting ART than those diagnosed with NADMs. The most fre-quently occurring cancers were the ADMs Kaposi’s sarcoma and non-Hodgkin’s lymphoma, while lung cancer and Hodgkin’s lymphoma were the commonest NADMs (Table 2). Supporting Information Table S3 shows how characteristics, numbers of cancers and deaths varies by cohort.
Prognosis after diagnoses of ADMs, viral NADMs and nonviral NADMs
Among 2,162 PLHIV who were diagnosed with an ADM 292/603 (48%) deaths were due to an ADM. Among 2,047 diagnosed with an NADM 467/847 (55%) deaths were due to an NADM. The proportions of deaths due to an NADM were 74/189 (39%) after a viral NADM diagnosis (n = 627) and 393/660 (60%) after a nonviral NADM diagnosis (n = 1,420).
Rates of mortality after ADM diagnosis were lower in the later period: the unadjusted mortality rate ratio (MRR) for 2006–2015 versus 1996–2005 was 0.73 (95% CI 0.61, 0.86) and the adjusted mortality rate ratio (aMRR) was 0.77 (0.65, 0.92). There was weaker evidence for such decrease for mor-tality after viral NADM diagnoses: MRR 0.75 (0.55, 1.02) and aMRR 0.76 (0.54, 1.07) and after nonviral NADM diagnoses: MRR 0.80 (0.68, 0.94) and aMRR 0.84 (0.70, 1.00)—seen in Table 3.
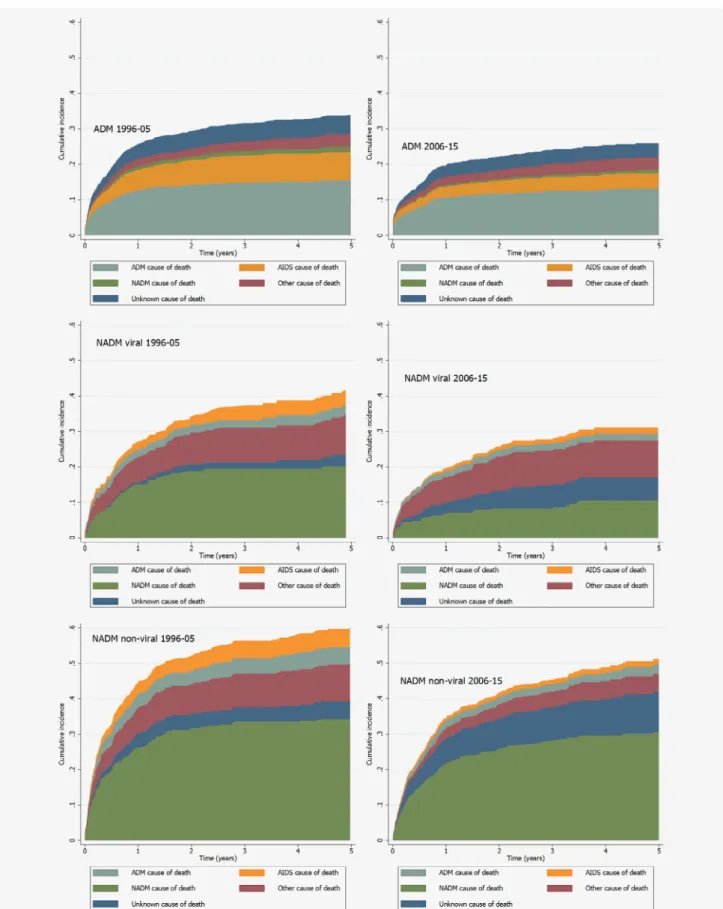
Table 3 shows crude and standardised rates of all-cause and cause-specific mortality during the 5 years after cancer diagnosis for the three cancer groups and by period of cancer diagnosis, with Supporting Information Table S4 giving more detailed information. Figure 1 shows patterns of 5-year cumu-lative cause-specific mortality according to type of cancer and calendar period. Among PLHIV diagnosed with an ADM, standardised rates and 5-year cumulative incidence were greater for mortality due to an ADM than for other causes of death. AIDS was the second commonest cause of death in this group for both periods. Similarly, mortality due to NADMs was the leading cause of death among PLHIV diagnosed with nonviral NADMs. The pattern of causes of death for PLHIV diagnosed with viral NADMs was less clear: the standardised rate of deaths coded as ‘other’ was nearly as great as the standardised rate of deaths due to NADMs, particularly dur-ing 2006–2015. Many of these deaths had a cause classified as related to viral hepatitis. The proportion of PLHIV lost to fol-low up in the 5-years after their cancer diagnosis was 16, 15 and 12% for those diagnosed with an ADM, viral NADM and nonviral NADM, respectively. Supporting Infor-mation Table S5 shows that there was little difference in mor-tality rates when patients diagnosed with more than one type of cancer were excluded from analyses, while Supporting Information Table S6 shows that there was also little differ-ence excluding those aged over 70 years at the time of cancer diagnosis.
Prognosis after diagnosis of specific cancers
Table 4 shows mortality rates for the seven most commonly diagnosed cancers: these were higher after diagnoses of NADMs than ADMs and were very high for lung, liver, non-Hodgkin’s lymphoma and head and neck cancers. For head and neck and lung cancer, the very high rates of NADM mor-tality suggest that cause of death was predominantly due to the diagnosed cancer. This was also the case for non-Hodgkin’s lymphoma, for which standardised rates of ADM mortality were high. A substantial proportion of deaths from liver cancer had been classified as due to viral hepatitis by our process for assigning CoDe cause of death classifications: these are shown as liver-related in Table 4. Table 4 also contains unadjusted and adjusted MRRs for cancers diagnosed between 2006 and 2015 compared to 1996–2005. Evidence of reduc-tions in MRRs between the two-calendar year periods was seen for liver cancer: MRR 0.61 (95% CI 0.38, 1.00) and aMRR 0.41 (95% CI 0.22, 0.76), and non-Hodgkin’s lym-phoma: MRR 0.62 (95% CI 0.51, 0.77) and aMRR 0.65 (95% CI 0.52, 0.81).
Estimated 5-year survival after diagnosis of cervical, head and neck, liver and lung cancer during 2006–2015 was similar in PLHIV to survival in people in the general population diag-nosed with these cancers in the United Kingdom and France (Fig. 2). Five-year survival for PLHIV diagnosed with
Infectious
Causes
of
Hodgkin’s lymphoma was lower than in the general popula-tion diagnosed with that cancer.
Discussion
Among PLHIV diagnosed with cancer, deaths due to an ADM were the leading cause of death after an ADM diagnosis while deaths due to an NADM were the leading cause of death after diagnosis of nonviral NADMs. Deaths after diagnosis with viral NADMs were most likely to be due to a NADM or due to other causes, many of which were classified as due to viral hepatitis. PLHIV diagnosed with nonviral NADMs had much higher mortality rates than those diagnosed with ADMs, or viral NADMs. Mortality rates after diagnosis of cancer were lower during 2006–2015 than 1996–2005: these declines were not explained by changes in CD4 count and viral load at can-cer diagnosis. Possible explanations are earlier cancan-cer stage at diagnosis due to improvements in screening,29improvements
in care among PLHIV,7,30 greater awareness of drug–drug interactions,31 availability of more effective treatment for cancer32 or patients with higher CD4 counts being able to withstand more doses of chemotherapy.33
The most common cancers reported were the ADMs Kaposi’s sarcoma, non-Hodgkin’s lymphoma, and cervical can-cer and the NADMs lung cancan-cer, Hodgkin’s lymphoma, anal cancer, head and neck cancers and liver cancer. For lung cancer, head and neck cancer and non-Hodgkin’s lymphoma most deaths were likely to have been caused by the diagnosed cancer. Five-year survival was low after diagnosis of liver cancer (as in the general population), but the underlying cause of death was often classified as viral hepatitis. Five-year survival among PLHIV diagnosed with liver, lung and cervical can-cers was similar to survival reported from general population cancer registries, but it was lower for PLHIV diagnosed with Hodgkin’s lymphoma.
Table 1.Numbers and characteristics of patients diagnosed with an AIDS-defining malignancy (ADM), viral non-AIDS defining malignancy (NADM) or a nonviral NADM, by calendar period of diagnosis
Characteristics at start of ART and at diagnosis of cancer
Cancer diagnosis 1996–2005 Cancer diagnosis 2006–2015 ADM (n = 1,091) NADM viral (n = 186) NADM nonviral (n = 424) ADM (n = 1,071) NADM viral (n = 441) NADM nonviral (n = 996) Age, years: median (IQR)
ART start 38 (32, 47) 39 (34, 47) 43 (36, 53) 39 (32, 47) 41 (34, 48) 46 (38, 54) Diagnosis of cancer 40 (34, 48) 43 (36, 50) 45 (39, 56) 42 (36, 50) 46 (40, 53) 51 (44, 60) CD4 cells/mm3, median (IQR)
ART start 125 (41, 264) 183 (68, 320) 160 (67, 301) 170 (60, 300) 201 (98, 322) 211 (82, 330) Diagnosis of cancer 170 (64, 320) 239 (103, 408) 263 (119, 435) 238 (96, 416) 350 (185, 550) 414 (240, 631) RNA copies/ml log median (IQR)
ART start 5.1 (4.6, 5.6) 4.9 (4.2, 5.3) 5.0 (3.3, 5.5) 5.1 (4.6, 5.5) 4.9 (4.2, 5.4) 5.0 (4.4, 5.4) Diagnosis of cancer 3.2 (2.3, 5.0) 2.5 (1.7, 4.1) 2.3 (1.7, 3.5) 2.4 (1.7, 4.7) 1.7 (1.6, 1.8) 1.7 (1.5, 1.7) Sex and transmission risk group,n (%)
MSM 549 (50%) 78 (42%) 140 (33%) 554 (52%) 225 (51%) 369 (37%) Male PWID 68 (6%) 36 (19%) 60 (14%) 51 (5%) 54 (12%) 107 (11%) Female PWID 34 (3%) 4 (2%) 17 (4%) 28 (3%) 9 (2%) 38 (3%) Male heterosexual 184 (17%) 46 (25%) 95 (22%) 186 (17%) 82 (19%) 257 (26%) Female heterosexual 144 (13%) 13 (7%) 67 (16%) 173 (16%) 40 (9%) 159 (16%) Male other/unknown 88 (8%) 9 (5%) 41 (10%) 60 (6%) 24 (5%) 48 (5%) Female other/unknown 24 (2%) 0 (0%) 4 (1%) 19 (2%) 7 (2%) 18 (2%) AIDS at ART start
No 526 (48%) 140 (75%) 281 (66%) 644 (60%) 329 (75%) 715 (72%) Yes 565 (52%) 46 (25%) 143 (34%) 427 (40%) 112 (25%) 281 (28%) Hepatitis C virus at ART start
Negative 866 (79%) 126 (68%) 290 (68%) 859 (80%) 318 (72%) 739 (74%) Positive 93 (9%) 41 (22%) 74 (17%) 91 (9%) 87 (20%) 141 (14%) Missing/unknown 132 (12%) 19 (10%) 60 (14%) 121 (11%) 36 (8%) 116 (12%) Ever smoked No 215 (20%) 28 (15%) 36 (8%) 340 (32%) 105 (24%) 218 (22%) Yes 209 (19%) 58 (31%) 120 (28%) 335 (31%) 193 (44%) 469 (47%) Missing/unknown 667 (61%) 100 (54%) 268 (63%) 396 (37%) 143 (32%) 309 (31%) Abbreviations: ART, antiretroviral therapy; MSM, men who have sex with men; PWID, people who inject drugs.
Infectious
Causes
of
Comparisons with other literature
To the best of our knowledge, our study is thefirst to analyse cause-specific mortality among PLHIV diagnosed with a range of specific cancers, spanning multiple countries. A large registry-linkage study in the USA found much higher mortal-ity rates after diagnosis for comparable cancers and also found that a higher percentage of the mortality of PLHIV diagnosed with NADMs was due to AIDS.34 This difference could be due to earlier diagnosis of cancer in our cohorts compared to their registry-linkage study, or because all of the patients in our analysis were on ART at the time of the cancer diagnosis, which was not necessarily the case in the USA study.34 A US study among elderly adults found higher cancer-specific mor-tality for prostate and breast cancer for PLHIV compared to HIV-negative people, however, we did not look at these indi-vidual cancers in our study.35 A small German study found that after just over a year, 87% of the deaths that occurred after diagnosis of lung cancer were due to lung cancer.13This
observation is concordant with ourfindings, although we had to infer that death due to NADM was due specifically to lung cancer. A general population study in the USA on diffuse large B-cell lymphoma patients found that 24% of deaths were attributed to noncancer causes,36 a lower figure than in our study. However, mortality rates depend on the stage of cancer at diagnosis, age and demographics of the patients, which can vary between health systems, making comparisons difficult.
Several HIV cohort studies have estimated 5-year survival after cancer diagnoses. Five-year survival after diagnosis of non-Hodgkin’s lymphoma was lower in the Collaboration of
Observational HIV Epidemiology Research in Europe
(COHERE), a European study, than in ART-CC (55% vs. 71%), but our study included more recent data.16The Italian Cancer and AIDS registries linkage study found much lower 5-year survival probabilities than ART-CC after several spe-cific cancers, for example, liver cancer 8% vs. 26%, but our study was during the early ART period and included PLHIV not on ART who had an AIDS diagnosis.12 Another Italian study which included PLHIV not on ART found similar 5-year survival to ART-CC after a diagnosis of Hodgkin’s lymphoma.14 A separate Italian cohort study, which also included PLHIV not on ART estimated 4-year survival con-cordant with our 5-year survival for liver cancer, but much lower survival for Hodgkin’s lymphoma (30% vs. 71%), lung cancer (6% vs. 16%), and cervical cancer (53% vs. 86%).15A large French study which found improved sur-vival between 2005 and 2009 compared to 1997–2000 for some haematological cancers and for ADMs, but not for solid cancers, reported higher 5-year survival for Hodgkin’s lymphoma than in ART-CC (87% vs. 71%), and similar survival for lung and liver cancers.17 Compared to ART-CC, a study in the USA found survival was lower for lung cancer (10% vs. 16%), and higher for Hodgkin’s lymphoma (83% vs. 71%), possibly due to differences in the demo-graphics between the two populations or the inclusion of PLHIV not on ART in the study from the USA.18
Strengths and limitations
We analysed a large dataset of PLHIV receiving care in clinical cohorts in Western Europe and North America: our findings should be generalisable to PLHIV on ART in high-income regions with recent cancer diagnoses. The size of our dataset enabled analyses of a wider range of specific cancers than previous studies. Most cohorts linked to death registries, but some PLHIV diagnosed with cancers with poor survival may have died after being lost to follow-up, so we may have underestimated mortality rates.37Information on cancer stage at diagnosis was not available: this may have resulted in some misclassification of precancerous lesions as cancer which could have biased survival estimates upwards. However, we focused our analyses on cancers that are more robustly vali-dated and performed checks to remove precancers from the analysis.
Table 2.Cancers reported in the ART-CC, diagnosed 1996–2005 and 2006–2015
Cancer type n: 1996–2005 n: 2006–2015 n: Total Kaposi’s sarcoma 616 547 1,163 Non-Hodgkin’s lymphoma 449 464 913 Lung cancer 116 255 371 Hodgkin’s lymphoma 109 196 305 Anal cancer 22 124 146 Cervical cancer 51 91 142 Head and neck cancers 42 96 138 Liver cancer 42 95 137 Leukaemia (all types) 28 61 89 Prostate cancer 16 62 78 Breast cancer 16 46 62 Bladder cancer 14 43 57 Connective tissue cancers 22 29 51 Malignant melanoma 10 40 50 Colon cancer 7 39 46 Brain cancer 17 19 36 Pancreatic cancer 5 25 30 Kidney/renal cancer 6 23 29 Stomach cancer 9 20 29 Rectal cancer 7 19 26 Uterus cancer 7 17 24 Testicular cancer 5 13 18 Penis cancer 4 12 16 Gynaecologic cancer 5 10 15 Bone cancer 6 7 13 Oesophageal cancer 2 10 12 Gall bladder cancer 2 4 6 Lip cancer 1 3 4 Not including metastasis, multiple myelomas, those of unspecified site, or unknown cancers.
Infectious
Causes
of
Table 3. All-c ause and cause-spe cific m ortality rates per 1,000 years (95% confid enc e inte rvals) duri ng the 5-yea rs after diag nos is of (i ) AID S defi ning m alignanc y (ADM), (ii ) vira l non -AID S defining mali gnancy (NADM ) and (iii ) nonvira l NAD M, stratifie d b y p e riod of canc er di agnosis 199 6–2005 200 6–2015 Un adju sted M R R 2 (95% CI) for 2006–2 015 vs . 1996–2 005 Ad justed MRR 2 (95% CI) for 200 6–2015 vs . 199 6–2 005 Cau se of deat h Deaths Crude rat e Stan dard ised rat e 1 Deat hs Crude rat e Stand ardised rate 1 Diagn osis of AD M n = 1,091 (889 Male, 202 Female) n = 1,071 (850 Male, 221 Female ) All 353 102 (92, 113 ) 7 7 (57, 103) 250 88 (78, 100 ) 7 3 (58, 93) 0.73 (0.6 1, 0.86 ) 0.77 (0.6 5, 0.92 ) AID S (not ADM) 83 24 (19, 30) 19 (16, 24) 41 15 (11, 20) 11 (8, 14) AD M 163 47 (40, 55) 34 (22, 52) 129 46 (38, 54) 37 (27, 52) NADM 15 4 (3, 7) 2 (0, 7) 8 3 (1, 6) 2 (1, 5) Ot her 36 10 (8, 14) 7 (5, 12) 32 11 (8, 16) 10 (8, 13) Unk nown 56 16 (12, 21) 14 (11, 17) 40 14 (10, 19) 13 (8, 20) Diagn osis of viral NADM n = 186 (169 Ma le, 17 Female) n = 441 (385 Male, 56 Female) All 71 134 (106, 169) 98 (79, 122) 118 111 (93, 133 ) 8 6 (56, 134) 0.75 (0.5 5, 1.02 ) 0.76 (0.5 4, 1.07 ) AID S (not ADM) 7 1 3 (6, 28) 10 (7, 15) 6 6 (3, 13) 4 (1, 14) AD M 5 9 (4, 23) 12 (6, 22) 8 8 (4, 15) 8 (3, 20) NADM 35 66 (47, 92) 42 (21, 83) 39 37 (27, 50) 29 (11, 72) Ot her 19 36 (23, 56) 25 (15, 40) 41 39 (28, 52) 25 (17, 39) Unk nown 5 9 (4, 23) 9 (3, 28) 24 23 (15, 34) 20 (12, 36) Diagn osis of non viral NADM n = 424 (336 Ma le, 88 Female) n = 996 (781 Male, 215 Female) All 232 264 (232, 300) 222 (136 , 363 ) 428 226 (206, 248 ) 213 (172 , 263 ) 0.80 (0.6 8, 0.94 ) 0.84 (0.7 0, 1.00 ) AID S (not ADM) 20 23 (15, 35) 25 (19, 34) 13 7 (4, 12) 5 (3, 9) AD M 1 9 2 2 (14, 34) 21 (8, 54) 22 12 (8, 18) 13 (9, 19) NADM 133 151 (128, 180) 119 (62, 227 ) 260 137 (122, 155 ) 125 (95, 164) Ot her 40 46 (33, 62) 38 (25, 59) 40 21 (15, 29) 19 (14, 25) Unk nown 20 23 (15, 35) 19 (14, 25) 91 48 (39, 59) 51 (36, 72) 1Standardised by sex/risk group and age to the AR T-C C population diagnosed with canc er . 2C o x models stratified by co hort. Adjusted model contains sex/transmission risk catego ry, and age, CD4 ce lls/mm 3, and RNA copies/ml at canc er diagnosis. Abbreviations: ADM, AID S-defining malignancy; CI, confidenc e interv al; MRR, mortal ity rate ratio; NADM, non-AID S defining malignancy .
Infectious
Causes
of
Cancer
Figure 1.Cumulative cause-specific mortality of patients from first diagnosis of ADM (upper), viral NADM (middle) and nonviral NADM (lower), stratified by period of cancer diagnosis (1996–2005 and 2006–2015). Abbreviations: ADM, AIDS-defining malignancy; NADM, Non-AIDS defining malignancy. Cumulative incidence functions were generating using a competing risks framework. [Colorfigure can be viewed at wileyonlinelibrary.com]
Infectious
Causes
of
Table 4. All-c ause and cause-spe cific m ortality rates per 1,000 years (95% confid enc e inte rvals) duri ng the 5-yea rs after diag nos is of cervic al canc e r, head a nd nec k canc e rs, Ho dgkin’s Lympho ma, K aposi’ s arc oma , liv er canc er , lung canc er and non -Hodg kin’s Lympho ma 199 6–2005 2006–2 015 Un adjust ed MRR 2 (95% CI ) for 200 6–2015 vs . 199 6–2005 Ad justed MRR 2 (95% CI) for 200 6–2015 vs . 199 6–2 005 End poi nt Deat hs Crud e rate Stan dardis ed rate 1 Deaths Crude rat e Stan dardis ed rate 1 C ervic al canc e r n = 5 1 (0 Male, 51 Femal e) n = 9 1 (0 Male, 91 Female) All 8 3 9 (20, 79) 33 (16, 68) 16 60 (37, 98) 54 (35, 83) 1.44 (0.60, 3.46) 1.15 (0.4 2, 3.13 ) AID S (not ADM) 3 1 5 (5, 46) 21 (15, 30) 4 1 5 (6, 40) 9 (2, 34) AD M 3 15 (5, 46) 3 (0, 23) 7 2 6 (13, 55) 28 (20, 39) NADM 0 0 (0, 0) 0 (0, 0) 2 8 (2, 30) 9 (7, 13) Ot her 1 5 (1, 35) 5 (0, 47) 2 8 (2, 30) 3 (0, 33) Unk nown 1 5 (1, 35) 5 (0, 47) 1 4 (1, 27) 4 (1, 25) Hea d/nec k canc ers n = 4 2 (35 Male, 7 Femal e) n = 9 6 (83 Ma le, 13 Female) All 18 182 (115 , 289 ) 183 (71, 473 ) 3 6 175 (126, 242 ) 162 (108, 244) 0.76 (0.41, 1.41) 0.62 (0.3 1, 1.24 ) AID S (not ADM) 1 1 0 (1, 72) 20 (4, 115 ) 1 5 (1, 34) 2 (0, 14) AD M 0 0 (0, 0) 0 (0, 0) 1 5 (1, 34) 10 (1, 83) NADM 15 152 (91, 251 ) 136 (60, 310 ) 2 1 102 (67, 156 ) 9 0 (50, 160 ) Ot her 2 2 0 (5, 80) 27 (7, 104 ) 5 24 (10, 58) 15 (5, 44) Unk nown 0 0 (0, 0) 0 (0, 0) 8 3 9 (19, 78) 46 (29, 72) Ho dgkin’s lymphoma n = 109 (98 Male, 11 Female ) n = 196 (170 Ma le, 26 Fe male) All 28 74 (51, 107) 71 (57, 87) 35 64 (46, 89) 62 (37, 105 ) 0.68 (0.40, 1.15) 0.87 (0.4 8, 1.57 ) AID S (not ADM) 6 1 6 (7, 35) 13 (9, 20) 4 7 (3, 20) 7 (2, 25) AD M 4 11 (4, 28) 16 (9, 31) 7 1 3 (6, 27) 14 (5, 40) NADM 10 26 (14, 49) 17 (6, 45) 13 24 (14, 41) 21 (10, 47) Ot her 6 1 6 (7, 35) 23 (11, 48) 6 1 1 (5, 24) 10 (4, 26) Unk nown 2 5 (1, 21) 2 (0, 9) 5 9 (4, 22) 9 (7, 13) K aposi’s s arc oma n = 616 (542 Male, 74 Female) n = 547 (489 Ma le, 58 Fe male) All 128 55 (46, 66) 46 (40, 54) 80 48 (39, 60) 43 (36, 51) 0.75 (0.56, 1.01) 0.91 (0.6 7, 1.22 ) AID S (not ADM) 46 20 (15, 27) 19 (14, 24) 19 12 (7, 18) 9 (6, 13) AD M 3 9 1 7 (12, 23) 14 (11, 20) 27 16 (11, 24) 16 (12, 21) NADM 4 2 (1, 5) 1 (0, 4) 2 1 (0, 5) 1 (0, 3) Ot her 19 8 (5, 13) 6 (4, 8) 19 12 (7, 18) 11 (7, 16) Unk nown 20 9 (6, 13) 7 (4, 10) 13 8 (5, 14) 7 (4, 11) Liver canc er n = 4 2 (39 Male, 3 Femal e) n = 9 5 (76 Ma le, 19 Female) All 30 626 (434 , 895 ) 324 (141, 744) 56 398 (306, 517 ) 401 (300, 536) 0.61 (0.38, 1.00) 0.41 (0.2 2, 0.76 ) AID S (not ADM) 1 2 1 (3, 148) 6 (1, 61) 1 7 (1, 50) 2 (0, 18) AD M 0 0 (0, 0) 0 (0, 0) 1 7 (1, 50) 3 (0, 24) NADM 17 355 (221 , 571 ) 180 (63, 519 ) 1 1 7 8 (43, 141 ) 7 9 (27, 231 ) (C onti nues)
Infectious
Causes
of
Cancer
Table 4. All-c ause and cause-spe cific m ortality rates per 1,000 years (95% confid enc e inte rvals) duri ng the 5-yea rs after diag nos is of cervic al canc e r, head a nd nec k canc e rs, Ho dgkin’s Lympho ma, K aposi’ s arc oma , liv er canc er , lung canc er and non -Hodg kin’s Lympho ma (C ontin ued) 199 6–2005 2006–2 015 Un adjust ed MRR 2 (95% CI ) for 200 6–2015 vs . 199 6–2005 Ad justed MRR 2 (95% CI) for 200 6–2015 vs . 199 6–2 005 End poi nt Deat hs Crud e rate Stan dardis ed rate 1 Deaths Crude rat e Stan dardis ed rate 1 Liver-re lated 8 167 (83, 334 ) 6 0 (14, 250 ) 3 1 220 (155, 313 ) 225 (171, 297) Ot her 3 6 3 (20, 194) 32 (1, 157 ) 2 14 (4, 57) 10 (2, 51) Unk nown 1 2 1 (3, 148) 46 (14, 155 ) 1 0 7 1 (38, 132 ) 8 2 (54, 124 ) Lu ng canc er N = 116 (101 Ma le, 15 Female) N = 255 (217 Male, 38 Fem ale) All 92 1, 019 (831 , 1,250 ) 791 (329, 1901) 184 752 (651, 869 ) 933 (756, 1,153 ) 0.81 (0.62, 1.06) 0.86 (0.6 5, 1.15 ) AID S (not ADM) 3 3 3 (11, 103) 17 (2, 123 ) 2 8 (2, 33) 19 (7, 54) AD M 2 22 (6, 89) 14 (2, 94) 1 4 (1, 29) 4 (1, 25) NADM 64 709 (555 , 906 ) 557 (198, 157) 133 544 (459, 644 ) 669 (508, 882) Ot her 12 133 (76, 234 ) 106 (53, 214 ) 1 1 4 5 (25, 81) 46 (25, 83) Unk nown 11 151 (110 , 209 ) 9 6 (50, 183 ) 3 7 151 (110, 208 ) 195 (130, 292) No n-Hodgkin’ s lymph oma n = 449 (371 Male, 78 Female) n = 464 (389 Ma le, 75 Fe male) All 234 237 (208 , 269 ) 177 (121, 259) 168 173 (148, 201 ) 148 (107, 205) 0.62 (0.51, 0.77) 0.65 (0.5 2, 0.81 ) AID S (not ADM) 38 38 (28, 53) 23 (9, 55) 19 20 (12, 31) 15 (11, 21) AD M 130 132 (111 , 156 ) 9 9 (69, 141 ) 104 107 (88, 129 ) 9 1 (62, 134 ) NADM 11 11 (6, 20) 5 (2, 16) 4 4 (2, 11) 3 (1, 7) Ot her 17 17 (11, 28) 13 (5, 30) 13 13 (8, 23) 10 (6, 18) Unk nown 38 38 (28, 53) 37 (31, 44) 28 29 (20, 42) 28 (21, 38) 1Standardised by sex/risk group and age to the AR T-C C population diagnosed with canc er (by risk group and age to the female AR T-C C population for cervi cal canc er). 2C o x models stratified by co hort. Adjusted model contains sex/transmission risk catego ry, and age, CD4 ce lls/mm 3 and RNA copies/ml at can ce r diagnosis. Abbreviations: ADM, AID S-defining malignancy; CI, confidenc e interv al; NADM, Non-AIDS defining malignancy; MRR, mortality rate ratio; MSM, Men who h ave sex with men.
Infectious
Causes
of
Cancer
We did not have conclusive data on cancer treatment such as chemotherapy and radiotherapy, which is a major prognostic factor.32We also do not know if all people received the same standard of treatment across the different countries and regions.21 Survival comparisons with the general population may have been impacted by higher rates of smoking in PLHIV, but we were unable to adjust for this and other lifestyle factors.
Due to the lack of universal linkage to cancer registries, we could not examine cancer incidence as some diagnoses might not have been recorded by the cohorts. Cause-specific mortality for PLHIV with recorded diagnosis of cancer should not be affected by this issue. We excluded those diagnosed with cancer who subsequently started ART due to uncertainty in timing of HIV infection and diagnosis. The cause of death information in ART-CC was not specific enough to determine causes of death due to specific cancers, for example, some causes of death were only able to be coded as an NADM, rather than, for example, lung cancer. Therefore, our analyses are assuming that if, using the same example, a death was due to an NADM cancer after a diagnosis of lung cancer, then that death was most likely due to lung cancer. Additionally, for this analysis, we were unable to separate out deaths due to opportunistic infections caused by complications of chemotherapy as it was not available in HICDEP as a category of deaths. Classification of some deaths as AIDS-related will have been based on a previous AIDS diag-nosis, so some deaths may have been misclassified as due to infection rather than cancer, when the immediate cause was a complication of chemotherapy and the underlying cause, can-cer, was not recorded. However, most cohorts recorded the underlying cause of death, or multiple causes of death, as well as the immediate cause.
Implications
The improvement in survival of PLHIV diagnosed with cancer in 2006–2015 compared to 1996–2005 may reflect improvements in care among PLHIV, such as increased cancer screening resulting in earlier detection of cancers, which are easier to treat, or more effective cancer treatment.32Another explanation could be improvements in ART resulting in better immunological sta-tus at cancer diagnosis, leading to more patients being able to tolerate chemotherapy.33
We reported estimates of 5-year survival for several types of cancer. This information is important for clinicians and is easy to communicate to patients. The comparison with 5-year survival in the general population quantifies the disparity that exists in some cancers and is a benchmark for future progress towards equalising survival rates. Although mortality rates decreased between 1996–2005 and 2006–2015, survival was worse for PLHIV diagnosed with Hodgkin’s lymphoma than in the general population, possibly due to more aggressive forms of the cancer among PLHIV, interactions between ART and chemotherapy, or delayed use of new therapeutic options compared to the general population. More positively, for cer-vical, head and neck, liver and lung cancers there was no evi-dence of disparity in survival after cancer diagnosis between PLHIV and the general population. The publication and dis-semination of such information may encourage PLHIV to be more proactive in being screened for cancer.
The population of PLHIV is ageing due to increased life expectancy attributable to more effective ART.16As the cohort of PLHIV ages, they will be at increased risk of cancers not consid-ered related to HIV that were previously rarely seen.8As with the general population,38many of these cancers are linked to lifestyle factors and comorbidities such as smoking and hepatitis C virus, both major sources of mortality among PLHIV.39–41 Emphasis should be placed on targeting such behaviours and treating co-morbidities such as chronic viral hepatitis in order to prevent cancer.
Acknowledgements
We would like to thank all patients, doctors, and study nurses associated with the participating cohort studies. This work was supported by the UK Medical Research Council (MRC; grant number MR/J002380/1) and the UK Department for International Development (DFID) under the MRC/DFID Concordat agreement and is also part of the EDCTP2 pro-gramme supported by the European Union. The ART-CC is funded by the US National Institute on Alcohol Abuse and Alcoholism (U01-AA026209). JACS is funded by National Institute for Health Research Senior Investigator award NF-SI-0611-10168. Data from 11 Euro-pean cohorts were pooled in June 2014, within COHERE in EuroCoord. COHERE receives funding from the European Union Seventh Framework Programme (FP7/2007-2013) under EuroCoord grant agreement number 260694. Sources of funding of individual cohorts include the ANRS (France REcherche Nord&Sud Sida-hiv Hépatites), the Institut National de la Santé et de la Recherche Médicale (INSERM), the French, Italian, and Spanish Ministries of Health, the Swiss National Science Foundation (grant 33CS30_134277), the Ministry of Science and Innovation and the Spanish Network for AIDS Research (Spanish Network of Excellence on HIV (RD12/0017/0018, RD16CIII/0002/0006)), the Stichting HIV
Figure 2.ART-CC (all countries) and general population5-year survival percentages from the United Kingdom (UK) and France— standardised to the age and sex proportions of the ART-CC population—for people diagnosed with selected cancers*. *CI: Confidence Interval; gen-pop: general population. UK general population survival percentage not available for head and neck cancer. [Colorfigure can be viewed at wileyonlinelibrary.com]
Infectious
Causes
of
Monitoring, the European Commission (EuroCoord grant 260694), the Alberta Government, the National Institutes of Health (NIH), National Insti-tute on Alcohol Abuse and Alcoholism (U10-AA13566, U24-AA020794), the US Department of Veterans Affairs, the Michael Smith Foundation for Health Research, the Canadian Institutes of Health Research, the VHA Office of Research and Development and unrestricted grants from Abbott, Gilead, Tibotec-Upjohn, ViiV Healthcare, MSD, GlaxoSmithKline, Pfizer, Bristol-Myers Squibb, Roche and Boehringer Ingelheim.
Conflict of interest
J.J.V. has personal fees from Merck/MSD, Gilead, Pfizer, Astellas Pharma, Basilea, Deutches Zentrum fur Infektionsforschung, Uniklink Freiburg/ Kongress und Kommunikation, Akademie fur Infektionsmedizin, Universitat Manchester, Duetsche Fesellschaft fu Infektiologie, Arztekammer Nordrhein, Uniklinik Aachen, Back Bay Strategies, Deutsche Gesellschaft fur Innere Medizin and grants from Merck/MSD, Gilead, Pfizer, Astellas Pharma, Basilea, Deutsches Zentrum fur Infektionsforschung, Bundesministrium fur Bildung und Forschung. M.J.G. has received honoraria in the last 3 years from ad hoc membership of national HIV advisory boards, Merck, Gilead and ViiV. F.W.N.M.W. has received personal fees for HIV advisory board
membership from ViiV. F.B. has received travel grants and honoraria from ViiV Healthcare, Gilead, BMS and MSD. His institution has received research grants from Gilead and ViiV Healthcare. D.C. reports research grants from Janssen, MSD France, ViiV, personal fees from Janssen and MSD France for lectures, personal fees from ViiV for travel/accommoda-tions/meeting expenses, personal fees from Gilead France for French HIV board, personal fees from Innavirvax and Merck Switzerland for consultancy, outside the submitted work. J.D.A. has received research grants and teaching fees from Gilead, ViiV Health Care, and MSD. M.C. reports that his institution received research grants from Gilead and ViiV. R.T. has received travel grants to attend medical meetings and/or speaker honoraria from Gilead, Janssen Cilag, MSD and ViiV Healthcare. P.R. through his institution has received independent sci-entific grant support from Gilead Sciences, Janssen Pharmaceuticals Inc, Merck & Co and ViiV Healthcare, and has served on scientific advisory boards for Gilead Sciences, ViiV Healthcare, Merck & Co, Teva pharmaceutical industries, for which honoraria were all paid to his institution—none related to the content of this manuscript. All other members of the writing committee declare no competing interests.
References
1. Borges AH. Combination antiretroviral therapy and cancer risk. Curr Opin HIV AIDS 2017; 12:12–9.
2. Raffetti E, Albini L, Gotti D, et al. Cancer inci-dence and mortality for all causes in HIV-infected patients over a quarter century: a multicentre cohort study. BMC Public Health 2015;15:235. 3. Shiels MS, Cole SR, Kirk GD, et al. A
meta-analysis of the incidence of non-AIDS cancers in HIV-infected individuals. J Acquir Immune Defic Syndr 2009;52:611–22.
4. Nguyen ML, Farrell KJ, Gunthel CJ. Non-AIDS-defining malignancies in patients with HIV in the HAART era. Curr Infect Dis Rep 2010;12:46–55. 5. Murphy EL, Collier AC, Kalish LA, et al. Viral
activation transfusion study I. highly active antire-troviral therapy decreases mortality and morbidity in patients with advanced HIV disease. Ann Intern Med 2001;135:17–26.
6. Borges AH, Neuhaus J, Babiker AG, et al. Imme-diate Antiretroviral Therapy reduces risk of infection-related cancer during early HIV infec-tion. Clin Infect Dis 2016;63:1668–76.
7. Antiretroviral Therapy Cohort Collaboration. Sur-vival of HIV-positive patients starting antiretrovi-ral therapy between 1996 and 2013: a
collaborative analysis of cohort studies. Lancet HIV 2017;4:e349–e56.
8. Vandenhende MA, Roussillon C, Henard S, et al. Cancer-related causes of death among HIV-infected patients in France in 2010: evolution since 2000. PLoS One 2015;10:e0129550. 9. Hleyhel M, FHDH-ANRS FHDH. Risk of
non-AIDS-defining cancers among HIV-1-infected individuals in France between 1997 and 2009: results from a French cohort. AIDS 2014;28: 2109–18.
10. Chiu CG, Smith D, Salters KA, et al. Overview of cancer incidence and mortality among people liv-ing with HIV/AIDS in British Columbia, Canada: implications for HAART use and NADM devel-opment. BMC Cancer 2017;17:270.
11. Vogel M, Friedrich O, Luchters G, et al. Cancer risk in HIV-infected individuals on HAART is
largely attributed to oncogenic infections and state of immunocompetence. Eur J Med Res 2011;16: 101–7.
12. Maso LD, Suligoi B, Franceschi S, et al. Survival after cancer in Italian persons with AIDS, 1986-2005: a population-based estimation. J Acquir Immune Defic Syndr 2014;66:428–35. 13. Hoffmann C, Kohrs F, Sabranski M, et al.
HIV-associated lung cancer: survival in an unselected cohort. Scand J Infect Dis 2013;45:766–72. 14. Spagnuolo V, Galli L, Salpietro S, et al. Ten-year
survival among HIV-1-infected subjects with AIDS or non-AIDS-defining malignancies. Int J Cancer 2012;130:2990–6.
15. Gotti D, Raffetti E, Albini L, et al. Survival in HIV-infected patients after a cancer diagnosis in the cART era: results of an italian multicenter study. PLoS One 2014;9:e94768.
16. Collaboration of Observational HIV Epidemiolog-ical Research Europe (COHERE) Study Group, Bohlius J, Schmidlin K, et al. Prognosis of HIV-associated non-Hodgkin lymphoma in patients starting combination antiretroviral therapy. AIDS 2009;23:2029–37.
17. Hleyhel M, Belot A, Bouvier AM, et al. Trends in survival after cancer diagnosis among HIV-infected individuals between 1992 and 2009. Results from the FHDH-ANRS CO4 cohort. Int J Cancer 2015;137:2443–53.
18. Marcus JL, Chao C, Leyden WA, et al. Survival among HIV-infected and HIV-uninfected individ-uals with common non-AIDS-defining cancers. Cancer Epidemiol Biomarers Prev 2015;24: 1167–73.
19. Biggar RJ, Engels EA, Ly S, et al. Survival after cancer diagnosis in persons with AIDS. J Acquir Immune Defic Syndr 2005;39:293–9.
20. Achenbach CJ, Cole SR, Kitahata MM, et al. Mor-tality after cancer diagnosis in HIV-infected indi-viduals treated with antiretroviral therapy. AIDS 2011;25:691–700.
21. Allemani C, Matsuda T, Di Carlo V, et al. Global surveillance of trends in cancer survival 2000-14 (CONCORD-3): analysis of individual records for
37 513 025 patients diagnosed with one of 18 can-cers from 322 population-based registries in 71 countries. Lancet 2018;391:1023–75. 22. Shiels MS, Althoff KN, Pfeiffer RM, et al. HIV
infection, immunosuppression, and age at diagno-sis of non-AIDS-defining cancers. Clin Infect Dis 2017;64:468–75.
23. Robbins HA, Pfeiffer RM, Shiels MS, et al. Excess cancers among HIV-infected people in the United States. JNCI J Natl Cancer Inst 2015;107:dju503. 24. May MT, Ingle SM, Costagliola D, et al. Cohort profile: Antiretroviral Therapy Cohort collabora-tion (ART-CC). Int J Epidemiol 2014;43:691–702. 25. Park LS, Tate JP, Sigel K, et al. Time trends in
cancer incidence in persons living with HIV/AIDS in the antiretroviral therapy era: 1997-2012. AIDS 2016;30:1795–806.
26. Ingle SM, May MT, Gill MJ, et al. Impact of risk fac-tors for specific causes of death in the first and sub-sequent years of antiretroviral therapy among HIV-infected patients. Clin Infect Dis 2014;59:287–97. 27. Cowppli-Bony A, Uhry Z, Remontet L, et al.
Sur-vie des personnes atteintes de cancer en France metropolitaine 1989–2013. Boulogne-Billancourt, France: Institut National Du Cancer, 2016. 28. Monnereau A, Troussard X, Belot A, et al.
Unbi-ased estimates of long-term net survival of hema-tological malignancy patients detailed by major subtypes in France. Int J Cancer 2013;132: 2378–87.
29. Goedert JJ, Hosgood HD, Biggar RJ, et al. Screen-ing for cancer in persons livScreen-ing with HIV infec-tion. Trends Cancer 2016;2:416–28.
30. Kielmann K, Cataldo F. Engaging with HIV care systems: why space, time and social relations mat-ter. Sex Transm Infect 2017;93:e053173. 31. Beumer JH, Venkataramanan R, Rudek MA.
Pharmacotherapy in cancer patients with HIV/-AIDS. Clin Pharmacol Ther 2014;95:370–2. 32. Biemar F, Foti M. Global progress against
cancer-challenges and opportunities. Cancer Biol Med 2013;10:183–6.
33. Wargo JA, Reuben A, Cooper ZA, et al. Immune effects of chemotherapy, radiation, and targeted
Infectious
Causes
of
Therapy and opportunities for combination with immunotherapy. Semin Oncol 2015;42:601–16. 34. Coghill AE, Shiels MS, Suneja G, et al. Elevated
cancer-specific mortality among HIV-infected patients in the United States. J Clin Oncol 2015; 33:2376–U77.
35. Coghill AE, Suneja G, Rositch AF, et al. HIV infection, cancer treatment regimens, and cancer outcomes among elderly adults in the United States. JAMA Oncol 2019;5:e191742. 36. Howlader N, Mariotto AB, Besson C, et al.
Can-cer-specific mortality, cure fraction, and
noncancer causes of death among diffuse large B-cell lymphoma patients in the
immunochemotherapy era. Cancer 2017;123: 3326–34.
37. Egger M, Spycher BD, Sidle J, et al. Correcting mortality for loss to follow-up: a Nomogram applied to Antiretroviral treatment Programmes in sub-Saharan Africa. PLoS Med 2011;8: e1000390.
38. Anand P, Kunnumakara AB, Sundaram C, et al. Cancer is a preventable disease that requires major lifestyle changes. Pharm Res 2008;25:2097–116.
39. Park LS, Hernandez-Ramirez RU, Silverberg MJ, et al. Prevalence of non-HIV cancer risk factors in persons living with HIV/AIDS: a meta-analysis. AIDS 2016;30:273–91.
40. Lifson AR, Neuhaus J, Arribas JR, et al. Smoking-related health risks among persons with HIV in the strategies for Management of Antiretroviral Therapy clinical trial. Am J Public Health 2010;100:1896–903. 41. Meijide H, Pertega S, Rodriguez-Osorio I, et al.
Increased incidence of cancer observed in HIV/hepatitis C virus-coinfected patients versus HIV-monoinfected. AIDS 2017;31:1099–107.