HAL Id: tel-00175655
https://tel.archives-ouvertes.fr/tel-00175655
Submitted on 29 Sep 2007
HAL is a multi-disciplinary open access
archive for the deposit and dissemination of sci-entific research documents, whether they are pub-lished or not. The documents may come from teaching and research institutions in France or abroad, or from public or private research centers.
L’archive ouverte pluridisciplinaire HAL, est destinée au dépôt et à la diffusion de documents scientifiques de niveau recherche, publiés ou non, émanant des établissements d’enseignement et de recherche français ou étrangers, des laboratoires publics ou privés.
biological pacemaker
Sandra Kanani
To cite this version:
Sandra Kanani. Stem cells as gene delivery system to create cardiac biological pacemaker. Physics [physics]. Université Nice Sophia Antipolis, 2005. English. �tel-00175655�
Universit´
e de Nice Sophia Antipolis - UFR Science
Ecole Doctorale de Sciences Fondamentales et Appliqu´
ees
TH`
ESE
pour obtenir le titre de
Docteur en Science
de l’UNIVERSITE de Nice-Sophia Antipolis
Sp´ecialit´e : “Physique”
pr´esent´ee et soutenue par
Auteur:
Sandra
Kanani
TITRE :
Stem cells as gene delivery system to create
cardiac biological pacemaker
Th`ese dirig´ee par : Valentine Krinski et Alain Pumir
Soutenu le: le 15 D´ecembre 2005
JURY
M. Hakim – DR CNRS , rapporteur M. Nargeot – DR CNRS , rapporteur M. Pumir – DR CNRS M. Krinski – DR CNRS M. Coullet – Professeur M. Mangoni – CR CNRSContents
Acknowledgment v
Abstract vii
1 Introduction 1
1.1 Electronic and biological pacemakers . . . 1
1.2 Paths for creating biological pacemakers . . . 2
1.3 Pacemaker(funny) ionic current If . . . 3
1.4 Manipulating ion channel function to create pacemaker cells . . . 5
1.5 Genetical approaches for creating biological pacemaker . . . 5
1.6 Characteristics to be embodied in a biological pacemaker . . . 5
1.7 Stem cells used to create biological pacemaker . . . 6
1.8 Stem cell experimental results . . . 7
1.9 What Physics can do for such a problem? . . . 8
1.10 HCN Channels (isoform family) . . . 11
1.11 Aim of the work . . . 12
2 Construction of the stem cell models 15 2.1 Models of stem cells transfected with HCN2 . . . 15
2.1.1 How we constructed the stem cell models: generic features . . . 17
2.1.2 Specific features: (Calculating number of pacemaker and gap junction chan-nels in source experiment; dimensionless and dimensioned variables) . . . 21
2.2 Models of different types of myocytes . . . 25
2.3 Models of a cell pair: a stem cell connected to a myocyte . . . 28
2.4 Models for cardiac tissue with incorporated stem cells . . . 29
3 Stem cells with HCN2 gene in cardiac tissue 31 3.1 Cell pair consisting of a stem cell connected to a myocyte . . . 31
3.1.1 Current through gap junction channels . . . 32
3.1.2 Oscillation induction and disappearance in a cell pair . . . 33
3.1.3 Oscillation regions for stem-mh and stem-h models . . . 35
3.1.4 Dependance of period of oscillation on parameters . . . 38
3.2 Stem cells as a pacemaker in a fiber . . . 39
3.2.1 Pacemaker length in a fiber . . . 40
3.2.2 Oscillation’s amplitude in the fiber . . . 40
3.2.3 Oscillation region for a fiber . . . 41
3.2.4 A paradox: Oscillation region is larger for the fiber than for a stem cell . . . 44
3.2.5 Reducing period of oscillation by connecting stem cells to neonatal myocytes 44 3.3 Multiple connection . . . 44
4 Stem cells with HCN1 gene in cardiac tissue 51 4.0.1 HCN1 isoform . . . 51
4.1 Constructing a model of a stem cell transfected with HCN1 . . . 52
CONTENTS iii
4.2.1 Oscillation region for a cell pair . . . 56
4.2.2 Oscillation region for stem cells with HCN1 in a fiber . . . 57
4.3 Result of transfecting stem cells with HCN1 . . . 58
5 Stem cells transfected with HCN4 gene in cardiac tissue. 59 5.1 Constructing a model of a stem cell with HCN4 . . . 60
5.2 Investigating a model of a stem cell transfected with HCN4 . . . 61
5.2.1 Oscillation region for a cell pair . . . 61
5.2.2 Oscillation region for stem cells with HCN4 in a fiber . . . 62
5.3 Result of transfecting stem cells with HCN4 . . . 63
6 Generic features of HCN genes family 65 6.1 Oscillation induced by HCN1,2,4 . . . 66
6.1.1 Oscillation regions in a cell pair: Comparing genes HCN1,HCN2, HCN4 . . . 66
6.1.2 Oscillation regions in a fiber: Comparing genes HCN1,HCN2, HCN4 . . . 68
6.2 HCN can’t induce oscillations in a ventricular myocyte . . . 70
6.2.1 An electric current can induce oscillation in a ventricular myocyte (k=1) . . . 70
6.2.2 A simple model independent mechanism . . . 74
6.2.3 Ionic mechanism of the phenomenon . . . 75
6.3 Expressing HCN1,2,4 in a myocyte or in a stem cell . . . 80
6.4 Modifying HCN genes properties . . . 84
6.5 Connecting stem cells to myocytes via transitional regions . . . 86
7 Two and three dimensional cardiac tissue 89
9 Appendix 97
9.1 List of relevant biological terms . . . 97
9.2 Verifying the stem cell models . . . 97
9.2.1 Comparing membrane resistance calculated from BR model and from our cell pair model . . . 97
Abstract
Keywords: biological pacemaker, stem cell model, oscillation, inactivation.
• By investigating stem cell models, we showed that induction of oscillation in normal ventric-ular myocytes by connecting stem cells to them is not possible. Induction of oscillations by stem cells was never demonstrated yet in well controlled conditions. Reported results [5],[4] demonstrate only increase of oscillation frequency (in cell culture or in whole hearts). • Oscillations become possible only for myocytes with much lower than normal threshold for
inducing oscillations. Approaches like decreasing of expression level of IK1current in myocytes
are successful.
• Other possible approach is connecting stem cells not directly to myocytes but to other types of cardiac cells with lower oscillation threshold. This induces oscillation without need to affect IK1 current. This transitional cells might be AV node cells, Purkinje cells or cells in
the vicinity of the sinus node.
• To drive cardiac tissue, small size artificial pacemakers need deliver currents orders of mag-nitude larger than those used in cell pair or cell culture experiments. To avoid this, the size of the pacemaker created should be several times larger than the electrotonic constant λ. • For pacemaker currents, most experimenters traditionally measure inactivation only. A
de-scription of a stem cell including inactivation only is not precise enough to study oscillations. Descriptions including both, activation and inactivation of pacemaker current should be used, contrary to tradition in this field.
Mots clefs : pacemaker biologique, les cellules souches, oscillation, inactivation.
• En ´etudiant des mod`eles de cellules souches, nous avons montr´e que l’induction des oscillations dans des myocytes ventriculaires normaux inexcitables n’est pas possible en les connectant `a des cellules souches. Jusqu’`a aujourdhui, cette induction n’a jamais ´et´e d´emontr´ee mˆeme sous de bonnes conditions. Les r´esultats r´ef´erenc´es [5],[4] ne font apparaˆıtre qu’une augmentation de la fr´equence d’oscillation (soit dans les cellules en culture, soit dans le coeur).
• Les oscillations ne deviennent possibles que pour les myocytes qui ont un seuil d’excitation des oscillations induites bien plus bas que la normale. Seules les m´ethodes qui diminuent le niveau d’expression de courant IK1 donnent des r´esultats.
• Il existe une autre approche, qui consiste `a ne pas connecter directement les cellules souches `
a des myocytes, mais `a d’autres types de cellules cardiaques avec un seuil d’excitation tr`es bas. De cette fa¸con, des oscillations sont induites sans avoir `a modifier le courant IK1. Ces
cellules transitoires pourront ˆetre des cellules AV node, de Purkinje ou des cellules voisinant SA node.
• Pour amener un tissus cardiac `a oscillation, les pacemakers artificiels de petite taille exigent des courants d’une magnitude bien plus ´elev´ee que dans les exp´eriences men´ees avec des paires de cellules ou des cultures. Pour ´eviter ce probl`eme, la taille des pacemakers artificiels doit ˆetre plus grande que la constante ´electrotonique λ.
• Pour le courantpacemaker, la plupart des exp´erimentateurs ont l’habitude de ne mesurer que l’inactivation. Cette seule mesure ne suffit pas pour ´etudier les oscillations. Les d´efinitions incluant `a la fois inactivation et activation du courant pacemaker doivent pr´evaloir contraire-ment `a la tradition dans le domaine.
Chapter 1
Introduction
1.1
Electronic and biological pacemakers
We describe the state of art in the Genetic Biological Pacemaker following reviews [2],[3],[5],[7],[15],[28] ,[29],[31],[32],[33].
Although electronic pacemakers (fig.1.1) are highly successful and about one quarter of million per year are implanted in USA, they are not optimal. Among their shortcomings are [4]:
1. They impose limitations on the exercise tolerance and cardiac rate-response to emotion. There is no substitute currently available for the autonomic modulation of heart rate.
2. The limitations imposed on unit and electrode dimensions by increasing age and mass of the pediatric patient. The hardware must be tailored to the growth of the patient.
3. The placement site of the stimulating electrode in the ventricle and the resultant activation pathway may have beneficial or deleterious effects on electrophysiologic or contractile function.
4. The battery has a long-but-limited life expectancy, requiring testing and replacement at periodic intervals.
5. Intercurrent infection may require removal and/or replacement of the pacemaker.
6. Various devices including neural stimulators, metal detectors, and magnetic resonance imaging equipment have been reported to interfere at times with electronic pacemaker function.
These concerns have encouraged advances in electronic device development and manufacture as well as the search for alternatives to electronic pacemakers.
The major breakthrough here has been recent research in using genetical methods to create
Electronic pacemaker
electrodes
Figure 1.1: Electronic pacemaker
cal pacemakers. Yet now there is greater promise of cure, deriving from engineering novel functions into existing or newly generated cells. This research shares the techniques of gene therapy and cell therapy. This includes insertion of genes to replace those which are malfunctioning.
An important step in demonstrating proof of concept for gene- and cell-based therapies has been the study of potential triggers of the heartbeat, that is, the generation of biological pacemakers. The stimuli for designing biological pacemakers were:
1. the desire to improve on electronic pacemakers that are currently the state of the art for treating many rhythm disorders;
2. to use this paradigm as a template for developing other gene/cell-based strategies.
The most straight forward is to create a new sinoatrial node. The sinoatrial node is the primary biological pacemaker in the heart and a potential template for any biological pacemaker to be fabricated.
1.2
Paths for creating biological pacemakers
The natural pacemaker (sino-atrial node, or SA node) is situated not in ventricles but in atria (in the right atrium). But pacemaker activity exists also in many regions outside of the SA node such as in the AV node and in bundle branches in the ventricles. It contributes to reliability of oscillations: period of auto-oscillations in these regions is slower than in the SA node, and does not affect faster oscillation waves propagating from the SA node. If the SA node is damaged, these auto-oscillatory regions may keep periodic contractions of the heart.
1.3. PACEMAKER(FUNNY) IONIC CURRENT IF 3
Circulatory collapse ensues when these specialized cells are damaged by disease, a situation that currently necessitates the implantation of an electronic pacemaker.
From a medical point of view [2], there are two major problems to be treated: 1. a case when the SA or AV node does not work well, 2. a case when SA or AV are not functioning at all and are dead.
A general treatment might be either manipulating autonomic control or ion channel number, struc-ture and function.
In my PhD, the focus is on creating a SA node from scratch.
1.3
Pacemaker(funny) ionic current I
fCardiac rhythmic activity is generated by ”pacemaker” cells, which in mammals are located in the sino-atrial node (SA node).
During the four phases in a pacemaker cell for inducing oscillation they:
1. Set pace of heart beat
2. Fire spontaneously
3. Depolarize slowly to threshold
4. Depolarization caused by flow of N a+ into the cell.
More precisely: action potentials of SA node cells have a special phase, called diastolic (or pace-maker) depolarization: at the end of an action potential, the pacemaker depolarization slowly takes the membrane voltage up to threshold for firing of a new action potential, thus inducing repeti-tive activity. In other words, the pacemaker cells of the heart initiate the heartbeat, sustain the circulation, and dictate the rate and rhythm of cardiac contraction.
The mechanism underlying the pacemaker depolarization was discovered by Brown, DiFrancesco and Noble [1]. They described a ”funny” (If) current, so called because of its unusual properties.
It is activated by hyperpolarization and not by depolarization unlike other currents, hence the designation ”funny” current.
If is an inward current carried by N a+ and K+. It is activated on hyperpolarization at voltages in
the diastolic range from a threshold of about −40/−50 mV. When at the end of an action potential the membrane repolarizes below this threshold, If is activated and supplies inward current, which
induces the diastolic depolarization phase.
dependence of If to more positive membrane potentials. This shift results in an increased If
current, an accelerated pacemaker depolarization and hence, an increase in heart rate. In contrast, stimulation of SA node cells slows down the beating frequency, in part due to lowering of the cAMP concentration. cAMP binds directly to the If channel regulating its voltage dependance.
Hyperpolarization-activated cyclic nucleotide-gated (HCN ) channel carries If.
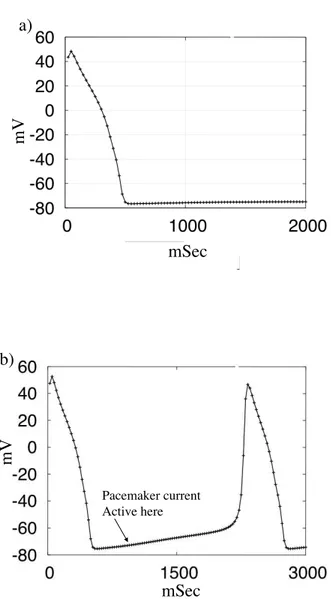
Fig.1.2 shows an example of the pacemaker activity. In the Fig.1.2b the IK1 current is decreased.
This is a key point and we will discuss this more in details in the ”Models of different types of myocytes”. m V mSec a) mSec m V Pacemaker current Active here b)
1.4. MANIPULATING ION CHANNEL FUNCTION TO CREATE PACEMAKER CELLS 5
1.4
Manipulating ion channel function to create pacemaker cells
Converting a normal cell into a pacemaker can be achieved either by an increase in inward currents (e.g., the pacemaker current If) or by a decrease in outward potassium currents. One such outward
current is the inward rectifier IK1 [18],[23].
IK1 is a large current in ventricular myocardial cells, where it clamps resting membrane potential
at a highly negative voltage, in other words, it stabilizes a strongly negative resting potential and should therefore suppress excitability. Any intervention that decreases IK1 below certain level,
increases pacemaker rate. The same can be achieved by increasing If(e.g., by overexpressing a
member of the HCN gene family)[17].
The approaches include use of naked plasmids or viral vectors to deliver the genetic construct of interest to a selected region of the heart and use of cells to deliver pacemaker constructs, whether the cells naturally incorporate them (e.g., embryonic stem cells) or can be loaded with them (e.g., mesenchymal stem cells).
1.5
Genetical approaches for creating biological pacemaker
Viruses can deliver the necessary genes [5]. Although the vectors have been replication-deficient adenoviruses that have little infectious potential, these incorporate the possibility of only a transient improvement in pacemaker function as well as potential inflammatory responses.
The use of retro-viruses and other vectors, although not attempted as yet for biological pacemakers, carries a risk of carcinogenicity and infectivity that is unjustified, given the current success of electronic pacemakers.
Attempts to use embryonic human stem cells to create pacemakers carry the problems of identifying appropriate cell lineages, the possibility of differentiation into lines other than pacemaker cells, and potential for neoplasia.
1.6
Characteristics to be embodied in a biological pacemaker
Characteristics needed to be in a biological pacemaker can be named as:
1. Create a stable physiologic rhythm for the lifetime of the individual
2. Require no battery or electrode and no replacement
4. Confer no risk of inflammation/infection
5. Confer no risk of neoplasia
6. Adapt to changes in physical activity and emotion with appropriate and rapid changes in heart rate
7. Propagate through an optimal pathway of activation to maximize efficiency of contraction and cardiac output
8. Have limited and preferably no arrhythmic potential
9. Represent cure, not palliation.
These considerations are not trivial. However, given the excellent successes of electronic pacemak-ers, anything less than the characteristics listed would not warrant the development of a biological alternative.
1.7
Stem cells used to create biological pacemaker
Adult human mesenchymal stem cells (hMSCs) are attractive for gene delivery applications [5]. The most important point is that these cells are immunoprivileged, in other words, they might not elicit the immune response that complicates transplantation [35].
Next, because the cells are readily available, and there are no objections to their use for research purposes. This is viewed as a major benefit to the work, which contemplates implanting human mesenchymal stem cells into hearts. In addition, it is believed that if the work advanced to the point of clinical trial, this property might facilitate the use of banked rather than autologous cells as a source for human administration.
hMSCs are multipotent and differentiate only further along mesenchymally derived lineages fig.1.3, the strategy is to use them as platforms to carry genes of interest to regions of the heart would need to couple with adjacent myocytes.
Human embryonic stem cells (hES) provide a rich source of material for initiating electrical activity in heart. The possibility that their use requires immunosuppressive treatment remains an issue.
Among the limitations common to both types of stem cell are concerns regarding their maintenance as stem cells vs their differentiation into other cell types.
For both human embryonic stem cells (hES) and human mesenchymal stem cells hMSC, it is important that the cells not evolve into unwanted cell lineages, as we would not want to see cartilage or lakes of hematopoietic cells in the heart. Similarly, issues regarding localization of cells vs migration elsewhere in the heart or in the body are critical[2].
1.8. STEM CELL EXPERIMENTAL RESULTS 7
Meanwhile, spontaneously excitable cardiomyocytes tissue from human embryonic stem cells hES are generated [26]. It was showed that they integrates structurally, electrically and mechanically with rat cardiac cells in vitro. They demonstrated that hES cardiomyocytes survive, integrate and function in vivo by showing that they pace ventricle in pigs with complete heart block.
Figure 1.3: Stem cell can be converted to all kinds of cell in the body. We used mathematical modeling to choose most effective paths for experiments to use them to create cardiac pacemaker.
1.8
Stem cell experimental results
The paths to recreate the SA node [3] include introducing progenitor or stem cells into selected regions of the heart, so that they develop into cells having the characteristic physiologic function desired.
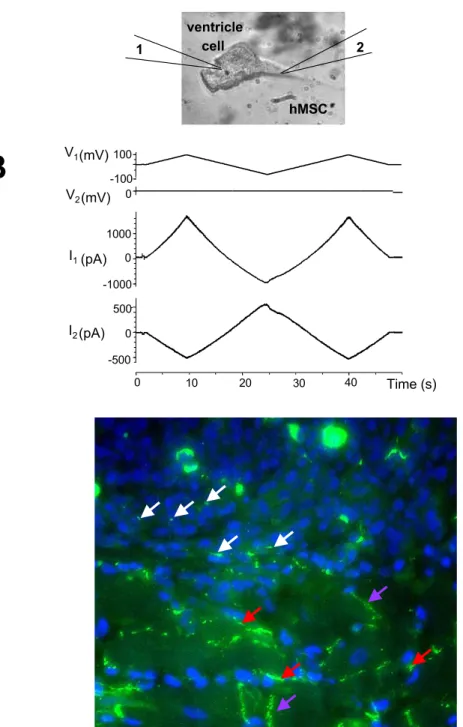
hMSCs transfected with a cardiac pacemaker gene, mHCN 2 expressed high current activating in the diastolic potential range, confirming the expressed current as If -like. The stem cells (hM SCs)
form gap junctions with adjacent myocytes (Fig.1.4).
More precisely [5]: voltage ramp in Fig.1.4B (V1 = 100, V2= 0 mV) applied to the canine myocyte
evoked current flow through the patch pipettes attached in whole-cell mode to the myocyte, I1,
and hMSC, I2. Currents recorded from the myocyte, I1, represent the sum of two components, a
junctional current and a membrane current in the myocyte. I2, recorded from the voltage-clamped
hMSC corresponds to the junctional current, Ij, between the hMSC myocyte pair.
Besides, the suggestion that coupling between myocyte and human mesenchymal stem cell resulted in effective pacemaker function was demonstrated in vitro, on a coverslip on which a small node of human mesenchymal stem cells transfected with either HCN2 alone was overlaid with neonatal rat myocytes [5]. The former developed beating rates approximately twice the rates of the latter (from 93±16 bpm to 161±4).
The difference between expressing HCN2 in adult and neonatal stem cells was investigated in [16]. An adenoviral construct (AdHCN2) of HCN2 was used to infect neonatal and adult rat ventricular myocytes to investigate the role of maturation on current gating. The expressed current exhibited an 18 mV difference in activation (V1/2 was -95.9±1.9 in adult; -77.6±1.6 mV in neonate) comparable to the 22 mV difference between native If in adult and neonatal cultures (V1/2 was −98.7 versus
−77.0 mV).
Ventricular pacemaker current If shows distinct voltage dependence as a function of age, activating
outside the physiological range in normal adult ventricle, but less negatively in neonatal ventricle [16].
These findings demonstrated that genetically modified hMSCs can mimick over expression of HCN2 genes in cardiac myocytes and represent a novel delivery system for pacemaker genes into the heart.
We will base our mathematical modeling on biological expriments that were done by Ira S. Cohen et al. [5]. They tested the ability of human mesenchymal stem cells (hM SCs) to deliver a biological pacemaker to the heart.
1.9
What Physics can do for such a problem?
Impressive results were obtained with stem cells to create an artificial biological pacemaker: human Mesenchymal Stem Cells (hMSC) transfected with HCN2 genes injected in canine left bundle branch provide ventricular escape rhythms that were mapped to the site of the injection [3].
In 15th annual Gordon K. Moe Lecture, M.Rosen described what is needed to see a biological pacemaker ”In our lifetime” [3]:
1.9. WHAT PHYSICS CAN DO FOR SUCH A PROBLEM? 9
White=stem to stem, red=stem to myocardium
,
purple=intercalated discA
B
hMSC ventricle cell 2 1 I1(pA) 0 1000 I2(pA) -500 0 500 40 20 0 Time (s) -100 100 0 10 30 -1000 V2(mV) V1 (mV)Figure 1.4: Stem cells form gap junctions with adjacent myocytes. See an analysis and more details in chapter ”Stem cell model”.
- evidence regarding persistence of the administered stem cell type vs differentiation into other cell types;
- evidence regarding persistence of pacemaker function (current and coupling).
In the list ”what characteristics should be embodied in a biological pacemaker?”, number one is:
- create a stable physiological rhythm for the lifetime of the individual.
On the physical language, it means: robustness of oscillations. This includes stability of oscillations and oscillation period against inevitable small variations of percentage of stem cells migrated to other sites; differentiated into other cell types; lost pacemaker function; decrease pacemaker current due to decrease of expression levels of pacemaker channels or gap junctions.
The period should be reasonably stable with respect to inevitable variations of many parameters affecting the biological pacemaker. It should tolerate the decrease of expression levels of pacemaker channels (HCN gene family) or gap junctions, of activity of peptides regulating gene expressions, loss of genes, small percentage of stem cells migrated to other sites; differentiated into other cell types; lost of pacemaker function by some cells.
Also there are several proteins like minK,MiRP1,... regulating level of expression of these HCN genes [24][10]. Factors like these proteins should be considered as a regulator for such biological pacemakers.
Even more important problem comparing to the factors mentioned above, is the ”nucleation prob-lem”. The proteins and regulators can be a solution for a zero dimensional case (a stem cell trans-fected to HCN2 connected to a myocyte) but they are negligible in a three dimensional problem (real heart). In other words:
- The excitation threshold in three dimension is ∼ 100 times larger than in zero dimension (For further details see chapter : two and three dimensional tissues).
- From 106 stem cells injected to myocytes, only 50 cells made gap junction connections with myocytes [5].
Achieving the construction of the biological pacemaker will require an expensive and a time con-suming work or in other words, a large number of expensive genetical and electrophysiological experiments. A combination of experiments with theoretical predictions is to be used as a guide to decrease the number of experiments. Our aim is to create a theory to guide and help the plan of the experiments. This requires creation of precise and adaptable mathematical models based on concepts and results of [5]-[37].
1.10. HCN CHANNELS (ISOFORM FAMILY) 11
1.10
HCN Channels (isoform family)
In cardiac muscle the pacemaker current is coded by a HCN gene family [32][9]. The name HCN stands for Hyperpolarization-activated Cyclic Nucleotides-gated channels that includes four iso-forms : HCN1, HCN2, HCN3, HCN4. The most pronounced difference between different isoiso-forms is in distinct activation kinetics.
Fig.1.5B [32] shows inactivation curves of the HCN1-4 channels. The cells were clamped from a holding potential of −40 mV to voltages from −140 to −50 mV in 10 mV increments(see inlet in Fig.1.5B) for 200 mSec (HCN1), 2.5 Sec (HCN2 and 3) and 10 Sec (HCN4). Fig.1.5C Shows in activation kinetics of HCN1 − 4 (with number of experiments in the brackets).
Only stem cells transfected with HCN2 were used for designing an artificial biological pacemaker [3], [5], [7], [4]. We will begin our investigation with HCN2.
1.11
Aim of the work
In this thesis, our challenge is to replace a part of the expensive and time consuming experiments with theoretical understanding and numerical simulations.
For this, we:
• introduced for the first time a model for the stem cell transfected with a gene that codes the pacemaker current channel (HCN gene family).
• analyzed and compared three isoforms of this gene family (or channels): HCN1, HCN2, HCN4 (HCN3 is not present in the cardiac tissue).
• connected the stem cell to myocytes
• studied a cell pair, a two dimensional cell culture, and the three dimensional cardiac tissue
1.11. AIM OF THE WORK 13
Figure 1.5: Electrophysiological properties of the HCN1-4 channels measured in voltage clamp mode. A) An example of a voltage clamp record. B) Voltage dependance of inactivation. Inlet shows scheme of the experiment. C) The inactivation time constants for E = −140 mV. In brackets is shown the number of experiments.
Chapter 2
Construction of the stem cell models
2.1
Models of stem cells transfected with HCN2
Because the experiments with artificial biological pacemaker were performed with stem cells trans-fected with HCN2 and these channels are strongly modulated by cAMP, we will start our investi-gations with this isoform.
We constructed models for a human Mesenchymal stem cell transfected with HCN2 gene from experimental data [5],[6]. The models permit to mimic experiments with levels of gene expressions not achieved yet in experiments and decide if the work to achieve this levels will significantly increase the quality of oscillations.
We describe here our two models: a model with two gating variables, activation and inactivation of the pacemaker current and a simplified model, including inactivation only.
Stem cell model with activation and inactivation (Stem-mh)
We described it as follows: dEs dt = −N σf C g s 1g2s(Es− Er) (2.1) dgs i dt = (¯gs i − gsi) τis(Es) , i = 1, 2 (2.2)
Es is the stem cell membrane potential, mV.
a) mV mV b) m S e c
τ
1τ
2Figure 2.1: Stem cell model with activation and inactivation. a) activation (g1or m) and
inactivation gating variables (g2or h). b) time constants.
gs
1, g2sare activation and inactivation gating variables ( notations m, h are used in Hodgkin-Huxley
eqns[30]).
τ1s, τ2s are activation and inactivation time constants, Fig.2.1.
N is the number of pacemaker channels per cell,
σf ∼ 1pS is the conductivity of a single pacemaker channel,
Er∼ −40 mV is the reversal potential. It is the membrane voltage at which there is no net flow of
ions from one side of the membrane to the other.
A problem comes with respect to normal electrophysiological statements that the experimentalists in the field traditionally call ”activation” the increase of the pacemaker (funny) current with negative voltages. This term induced questions how a model with inactivation only (without activation variable) can describe activation of the current. The explanation is: increase of the current in these
2.1. MODELS OF STEM CELLS TRANSFECTED WITH HCN2 17
experiments is induced by removing inactivation at negative voltages (and not by activation, that is physically a different process).
We used symmetry of voltage dependence of gating variables ¯gs
i for constructing the model when
the available experimental data were limited.
Stem cell model with inactivation only (Stem-h)
We describe it as follows: dEs dt = −N σf C g s(E s− Er) (2.3) dgs dt = (¯gs− gs) τ2s(Es) (2.4)
g2 is given for complete model only and for the reduced model, gs= g2× g1. Fig.2.2.
Since ratio ǫ = τ1s
τs
2 ≪ 1, (Fig2.1b), it is natural to expect that a simplified model with inactivation
only will give results close to the full model.
mV
Figure 2.2: Inactivation gating variables (g2or h) for stem cell (stem-h)
2.1.1 How we constructed the stem cell models: generic features
Stem cell model with inactivation only
We will repeat here equations of the model:
dEs dt = −N σf C g s(E s) × (Es− Er) (2.5) dgs dt = (¯gs− gs) τs 2(Es) (2.6)
The right hand side of Eqns.2.5 is the pacemaker (funny) current If and is measured in the
exper-iments [5]:
−N σf
C g
s(E
s) × (Es− Er) = If(E) (2.7)
The experiment records are shown in Fig.2.5.
As seen from Eqns2.5,2.6 and Fig.2.5, for construction of the simplified model, we needed to find the number of pacemaker channel per cell N and two functions:
gs(Es), τ2s(Es)
The values Er, σf are known: Er∼ −40 mV, σf = 1 pS.
We found N from the scaling condition that inactivation variable gs = 1 for the most negative value of voltage (Es = −160 mV). This gives N = 6 × 10⁴ pacemaker ionic channels per cell (See
detailed calculations in the next chapter).
gs was found from Eq.2.7 where now all values are known.
τ2s(Es) was found as time constants of current records for every Es in Fig.2.5B.
Stem cell model with activation and inactivation
The model is:
dEs dt = −N σf C g s 1(E)g2s(E) × (Es− Er) (2.8) dgis dt = (¯gis− gis) τs i(Es) , i = 1, 2 (2.9)
2.1. MODELS OF STEM CELLS TRANSFECTED WITH HCN2 19
As seen from Eqns2.8,2.9 and Fig.2.1, for construction of the complete model, we needed to find four functions:
g1s(Es), g2s(Es), τ1s(Es), τ2s(Es)
Estimations of gs
1(Es) and gs2(Es)
The difficulty was:
If(Es) ∝ g1s(Es) × gs2(Es)
and we had only one function measured in the experiment: If(Es). This can give only the product
G(Es) = gs1(Es) × g2s(Es) but not functions gs1(Es), gs2(Es) separately. A standard approach to
es-timate them (used from the Hodgkin-Huxley times[30]), is to measure fast and slow ionic currents separately in a voltage clamp experiment. These measurements were not performed by the experi-mental team [5](”no manpower” to do it). So, we needed to find what data from the experiexperi-mentally recorded currents could be used to supplement available If ∝ g1s× g2s.
If was measured in the experiment as a current induced in response to voltage step from −30 mV
to variable levels E. In the same experiment, it is seen how the currents were modified by the end of this voltage step (so called ”tail currents). We used these tail currents records to supplement available If records (see details in the next chapter). This gave us gs1 and g2s independently.
Construction of the stem cell models: detailed analysis of the experiments
Estimation of gs2 from tail currents records
In Fig.2.5B, tails currents were recorded as a response to the end of the voltage step that is from variable level E to +20 mV. The tail currents were measured at times t0 such that:
τ1 << t0 << τ2
Due to it, activation g1s(E, t) reaches its steady value gs1 = ¯g1s(20mV ), while inactivation is still
close to its initial value before the end of the step, g2s = g2s(E). So, the tail current measured is described by the equation:
Itail =
−N σf
C g
s
1(20 mV )gs2(Es)(20 mV − Er)
When I/Imax is represented as a dimensionless value, all multipliers except g2s(E) disappear and
Itail Imax = g s 2(Es) gs 2(Emax)
since gs2(Emax) = 1 (the scaling condition)
Itail
Imax
= gs2(Es)
So tail current records [5] give inactivation g2s (separated from g1s).
Now g1s can be easily found from Eq.2.7
Estimations of τ1 and τ2
Estimations of τ2
Since τ2is large (of the order of∼ 500 mSec) it was easily estimated from current records in Fig.2.5B.
Estimations of τ1
But there is a significant problem in estimation of τ1.
τ1 is of the order of∼ 10 mSec, and this time scale is not resolved in the experiments, Fig.2.5B.
More than that, if this time scale would be resolved, the fast current would be masked by the capacitance current. So experimentalists studying pacemaker current traditionally show only one component current records (slow component Fig.2.5B).
We needed to restore the fast component records based on generic features of the model.
A physiscist looking at the Eqns.2.8,2.9 would generically expect three components in
If =
−N σf
C g
s
1(Es, t)gs2(Es, t) × (Es− Er)
induced in response for a voltage step:
(1). An immediate response (τ = 0 mSec) in If = −N σf
C g1sg2s× (Es− Er) due to jump in term
(Es− Er).
2.1. MODELS OF STEM CELLS TRANSFECTED WITH HCN2 21
(3). A delayed response with a larger time constant due to slow variable with τ ∼ 100 mSec.
These three components are not seen in Fig.2.5B. But their consequences can be found.
mSec pA /pF a) τ0 mSec pA /pF b) A C B
Figure 2.3: Measuring activation time τ1 by matching the experimental records. a) Three
compo-nents of the current that should be observed in the experiment with a higher time resolution. b) With try and error, the correct value of τ1 corresponding to the experimental record was chosen.
Estimation of τ1(Es)
The three components that should be observed here are shown in Fig.2.3. In Fig.2.3a, component τ0 corresponds to the item (1) above, component τm corresponds to the item (2) and component
τh corresponds to the item (3).
By varying component τ1 in Fig.2.3b we may vary position of the initial point (A, B or C) of the
slow current record. We chose the value τm so that it gives the position of the initial point of the
slow current record in Fig.2.3b same as in experiment Fig.2.5. This was done for every voltage E and gave us the needed dependance τ1(E).
2.1.2 Specific features: (Calculating number of pacemaker and gap junction channels
in source experiment; dimensionless and dimensioned variables)
Number of pacemaker channels
It can be readily found from eq.2.7 for the steady value of the pacemaker current:
If(E) =
−N σf
C g
s(E
Here gs(Es) was found in the previous chapter, If(Es) is measured in the experiment and all other
values are known except N . This gives :
N ∼ 6 × 10⁵ channels per cell See details in dimensionless and variables section.
Number of gap junction channels
Figure 2.4: Voltage and current records from a stem cell connected to the myocyte
From Fig.2.4B the resistance between the Myocyte and the stem cell is:
R = 0.2 × 10⁹Ω
Since the conductivity of a single gap junction channel is 50 pS, this gives :
n = 100 gap junction channels per cell
Note that there is four orders of magnitude difference between numbers of gap junction and pace-maker channels per cell.
2.1. MODELS OF STEM CELLS TRANSFECTED WITH HCN2 23
Dimensionless and dimensioned variables
Here we will give calculations of the numbers of channels per cell. This is an important step in designing a quantitative model.
Number of pacemaker channels
For voltage Es = −160 mV the inactivation variable gs2=1 (the scaling condition), then Eq.2.7
became If = −N σf(−160 − Er). where from :
N = If σf
(−160 − Er) (2.10)
Inserting values Er= −40 mV and σf = 1 pS and value for If , one can obtain N .
In our model, the predicted currents correspond to an entire cell, but the experimentalists express their results in pA/pF. These two are related by the total capacitance, C=95 pF.
As an example, one of the currents recorded in Fig.2.5B is I′
= 76 pA/pF which corresponds to If = C × I′ = 95 × 76 = 7220 pA. If the value I′ = 76 pA/pF was used it would give ∼ 100 times
error. The point is that N is defined as number of pacemaker channels per cell.
This, together with Eq.2.10, leads to the following calculation for the number of pacemaker channels.
N = 7220(pA)
1(pS) 120(mV ) ∼ 6. × 10
5channels
Number of gap junction channels
In Fig.2.4B current flowing between stem cell and myocyte is I2 = 500 pA and ∆E = 100 mV. So
the resistance of the gap junction channel between cells is:
R = ∆E I2 = 100 × 10 − 3 500 × 10− 12 = 0.2 × 10 9Ω
So the total conductivity between two cells σtotal = 5 × 10⁻⁹ S. Since the conductivity of a single
n = σtotal σ1 = 5 × 10 − 9 50 × 10−12 = 100 channels
Figure 2.5: Pacemaker current If in an experiment with stem cells hMSCs transfected
with mHCN2 gene [5]. Voltage protocol is shown on the left. Voltage was hold at −30 mV and hyperpolarized to voltages between −40 and −160 mV in 10 mV increments. (A) There is no current for non transfected stem cells. (B) Current If records in a transfected stem cell. (C)
2.2. MODELS OF DIFFERENT TYPES OF MYOCYTES 25
Currents generated by the stem-h model Eq.2.5,2.6 with the same experimental protocol as in Fig.2.5a are shown in Fig.2.6. It is seen that the model reproduces precisely the same current values as in the experiment Fig.2.5b [5].
mSec
pA
/pF
Figure 2.6: Current records from the stem cell model. Compare with Fig.2.5b.
2.2
Models of different types of myocytes
We need to investigate interaction of stem cells with myocytes of different types. No published models are sufficient for this (each of them describes a specific type of myocytes). So, we’ll create models of several types of myocytes starting from an existing model.
Important characteristics of myocyte here are: whether it is self-oscillating (as a neonatal myocyte), or excitable (as a ventricular myocyte). For excitable myocytes, important is the threshold value of current that is needed from a stem cell to induce oscillations with desired period (T ∼ 1 sec); other characteristics and ionic currents are less important. To achieve this, it is sufficient to modify the level of expression IK1 (time independent Potassium) current.
Here, we work with several models of myocytes:
1. Normal myocytes (with high threshold Iosc for inducing oscillations).
2. Self oscillating neonatal type myocytes
We obtained these models by reducing expression level of IK1 current 1 to decrease Iosc and
sub-sequent re-scaling all time constants in the model to keep APD same for all myocytes types.
IK1 was presented as:
IK1= k × IK1∗ (2.11)
where I∗
K1 is the current in original myocyte model and k < 1 is a coefficient. Fig.2.7 shows IK1
current in BR model. It is important to note that k=1 corresponds to the normal ventricular myocytes.
mV
pA
/pF
Figure 2.7: Time independent K+ current, I K1
The expression level of IK1 needed to obtain a specific myocyte type will be different for, say, a
model of a human myocytes and an animal model.
For creation of a biopacemaker, the threshold Ioscfor inducing oscillations (controlled by k) is the
most important. Other details such as ionic currents and hence, the choice of an ionic model among many models published are less important comparing to this factor. Fig.2.8 shows how shape and resting potential changes according to level of expression of IK1.
We obtained the models of different types of myocytes starting with the Beeler-Reuter (BR) [28] model. It describes the membrane potential, Em, gating variables gim controlling ionic chanels, and
Ca concentration [Ca]: ∂tEm = −Iion C (Em, g m i ) + D∇2Em (2.12) ∂tgim = (¯gm i − gmi ) τim(Em) , i = 1, 6 (2.13) ∂t[Ca] = −10−7iCa+ 0.07(10−7− [Ca]) (2.14) 1
2.2. MODELS OF DIFFERENT TYPES OF MYOCYTES 27
Where:
iCa= gCagm5 g6m(Em− ECa)
gCa= 0.09mS/cm2
ECa= −82.3 − 13.0287 ln[Ca].
The diffusion term D in Eq.2.12 represents the electric coupling between cells. D ∼ 10−3
cm2/mSec. The model in one and two dimension was calculated with dx = 0.1 mm, dt = 0.001 mSec. (dx was chosen due to the cell size ∼ 100 × 10 × 10µ)
In Fig.2.8a a normal AP in a myocyte is seen, while in Fig.2.8b we have changed IK1 (or k).
mSec m V a) mSec m V b)
Figure 2.8: a) AP in the original BR model. b)AP shape and resting potential for a myocyte k = 0.25 (modified BR model).
A myocyte with k=1 corresponds to the original BR equation.
Excitation threshold current is Iexc= 2 pA/pF
Oscillation threshold current is Iosc= 2.01 pA/pF
While a myocyte with k=0.3 has both thresholds with an order of magnitude less:
Excitation threshold is Iexc= 0.17 pA/pF
Oscillation threshold is Iosc= 0.18 pA/pF
2.3
Models of a cell pair: a stem cell connected to a myocyte
A stem cell connected to a myocyte (a cell pair) is described by equations:
dEs dt = −N σf C g s 1g2s(Es+ 40) + nσg C (Em− Es) (2.15) ∂tEm = −Iion C (Em, g m i ) + nσg C (Es− Em) (2.16) ∂tgim = F (gim, Em) τm i (Em) , i = 1, ..., 6 (2.17) ∂t[Ca] = −10−7iCa+ 0.07(10−7− [Ca]) (2.18) dgis dt = F (g2s, Es) τ2s(Es) , i = 1, 2 (2.19)
C is the cell capacitance ∼ 95 pF.
n is the number of gap junction channels per cell.
N is the number of pacemaker channels per cell.
σg is the conductivity of a single gap junction channel ∼ 50 pS.
The term nσg(Em− Es) in Eq.2.20 describes the current flowing from a myocyte to a stem cell
through a gap junction channel.
The simplified model (Stem-mh) was incorporated similarly. The stem cell is described by a sim-plified model (Stem-h) with one gating variable g2s only.
dEs dt = −N σf C g s 2(Es+ 40) + nσg C (Em− Es) (2.20) ∂tEm = −Iion C (Em, g m i ) + nσg C (Es− Em) (2.21)
2.4. MODELS FOR CARDIAC TISSUE WITH INCORPORATED STEM CELLS 29 ∂tgmi = F (gim, Em) τm i (Em) , i = 1, ..., 6 (2.22) ∂t[Ca] = −10−7iCa+ 0.07(10−7− [Ca]) (2.23) dgis dt = F (g2s, Es) τ2s(Es) (2.24)
2.4
Models for cardiac tissue with incorporated stem cells
We suppose that stem cells are injected to pacemaker region only and are connected to the myocytes only but not one to another. The tissue is described by the equations below.
dEs dt = −N σf C g s 2(Es+ 40) + nσg C (Em− Es) (2.25) ∂tEm = −Iion C (Em, g m i ) + D∇2Em+ δx,p nσg C (Es− Em) (2.26) ∂tgmi = F (gmi , Em) τm i (Em) , i = 1, ..., 6 (2.27) ∂t[Ca] = −10−7iCa+ 0.07(10−7− [Ca]) (2.28) dgis dt = F (gs2, Es) τs 2(Es) (2.29) Where : δx,p = ( 1, x ∈ P 0, x /∈ P
A stem cell was unable to induce oscillations in normal ventricular myocytes ( k=1) even in a cell pair. A stem cell normally induces oscillations in myocytes with k=0.3.
Oscillation threshold Ioscin one, two and three dimensional cardiac tissue is higher compared to a
cell pair.
Following details show how changing k affects the excitation and oscillation thresholds in different kinds of the myocytes:
For k = 1, the excitation threshold is Iexc= 2.0 pA/pF and 2.01 < Ioscil< 2.6 pA/pF.
For k = 0.5, the excitation threshold is Iexc= 0.68 pA/pF and 0.69 < Ioscil< 1.1 pA/pF.
For k = 0.3, the excitation threshold is Iexc= 0.17 pA/pF and 0.18 < Ioscil< 0.77 pA/pF.
Chapter 3
Stem cells with HCN2 gene in cardiac
tissue
3.1
Cell pair consisting of a stem cell connected to a myocyte
It was demonstrated [5] that stem cells make connexin proteins and form functional gap junctions that couple electrically with myocytes.
A cell pair is what we will call a stem cell transfected with HCN2 gene connected to the myocyte. In this chapter we will begin to employ the model of a stem cell transfected with HCN2 gene.
The goal is :
- To investigate HCN2 isoform as a gene delivery system
- To see how it acts as a pacemaker when is transplanted in a stem cell
- What factors can influence its efficiency
- What are its limitations
Besides, we will mimick the experiment [5] in which the stem cells transfected with HCN2 are connected to the myocytes and the experiment in which the expression of HCN2 in stem cells provides an If-based current sufficient to increase the beating rate of the cocultured neonatal
myocytes. Then in this chapter, we will investigate one dimensional condition when stem cells are connected to a fiber of myocyte.
3.1.1 Current through gap junction channels
Fig.2.4 is an example when current flows from gap junctions between a myocyte and a stem cell. It is seen that the amplitude of oscillation and range of potential is different in a stem cell and a myocyte. It is also important to note that k is chosen for the myocyte relatively low.
mSec mV a) mSec mV b) mSec pA /pF c)
Figure 3.1: A cell pair: Current flowing through gap junction channels. a) Myocyte, b) Stem cell, c) Current through gap junction channels. Parameters: number of gap junction channels per cell n = 10, number of pacemaker channels per cell N = 104, level of expression of IK1, k=0.233.
3.1. CELL PAIR CONSISTING OF A STEM CELL CONNECTED TO A MYOCYTE 33
3.1.2 Oscillation induction and disappearance in a cell pair
Oscillations in a cell pair are shown in Fig.3.2. In Fig.3.2a, there are no oscillation for a myocyte with k=0.233(relatively a low k value). In Fig.3.2b oscillation appears when the myocyte is connected to a stem cell. In Fig.3.2c oscillation disappears when the number of gap junction channels per cell is increased. It is important to note that with k values larger than 0.43 the oscillation is never induced, independent of number of gap junction and pacemaker channels.
mSec m V a) M S n=0 mSec m V b) M S n=20 mSec m V c) M S n=200
Figure 3.2: A cell pair: oscillations induction (b) and disappearance (c). Myocyte and stem cell potentials are marked by M and S. Number of gap junctions n is indicated above each image. Parameters: k=0.233, N = 1.2 × 10⁵ (see eqns 2.20,2.21).
Defining boundaries of the oscillation region
In the following Figs.3.4,3.5 we define the position of ”disappearance of oscillations” boundary at parameters values where the upstroke of the AP decreases below ∼ 0 mV and the oscillation amplitude is not inferior than ∼ 50 mV. Fig.3.3a,b show what we have considered as oscillation and Fig.3.3 is defined as no oscillation.
To be accurate to find when the propagation will disappear, it would be better to use cardiac tissue models.
a)
b)
c)
mSec
mSec
mSec
m
V
m
V
m
V
Figure 3.3: Oscillation disappears. a)Number of gap junction channels per cell n = 40, b)n = 80, c)n = 100. a),b) are considered as oscillation and not c). Parameters : k = 0.3, N = 107.
3.1. CELL PAIR CONSISTING OF A STEM CELL CONNECTED TO A MYOCYTE 35
3.1.3 Oscillation regions for stem-mh and stem-h models
Oscillation region for stem-mh model
In Fig.3.4 the oscillation region is shown. It is seen that for large numbers of gap junction and pacemaker channels there is no oscillation. Stem cells can induce oscillations only in myocytes with decreased level of expression of current IK1 ( = decreased k). We have observed that oscillation
can not be induced in normal myocytes (k=1), no matter how large are number N of pacemaker channels or number n of gap junctions. Also, it is seen that oscillations here are robust, and oscillation period is almost constant for a wide range of changing number of pacemaker channels per cell.
No oscillations
a) k=0.233
Oscillations
Gap junction channels/Cell
pa ce m ake r cha nne ls /Ce ll No oscillations No oscillations Oscillations k=0.3 T~589 mSec 512 b)
Gap junction channels/Cell
pa ce m ake r cha nne ls /Ce ll
Figure 3.4: Cell pair oscillations Stem-mh model. a, b) Oscillation region. Note that the oscillation region shrinks fast with increasing k. (hatched is the region where there are no oscilla-tions).
Oscillation region for stem-h model
Same investigation is done for oscillation region with simplified model in Fig.3.5. It is seen that increasing the number of pacemaker channels doesn’t help for inducing oscillation. With increasing k in Fig.3.5b the oscillation region shrinks. This is observed in Fig.3.5c,d. For the myocytes with k larger than 0.43 the oscillation region will disappear.
a)
pa
ce
m
ake
r c
ha
nne
ls
/Ce
ll
b)
c)
d)
pa
ce
m
ake
r c
ha
nne
ls
/Ce
ll
pa
ce
m
ake
r c
ha
nne
ls
/Ce
ll
pa
ce
m
ake
r c
ha
nne
ls
/Ce
ll
Gap junction channels/Cell
Gap junction channels/Cell
Gap junction channels/Cell
Gap junction channels/Cell
Oscillations
No
Oscillations
Oscillations
No-Oscillations
No
Oscillations
No-Oscillations
No
Oscillations
Oscillations
OscillationsNo-Oscillations
Oscillations NoK=0.233
K=0.3
K=0.4
K=0.42
Figure 3.5: Cell pair oscillations. Oscillation region (hatched is the region where there are no oscillation).
3.1. CELL PAIR CONSISTING OF A STEM CELL CONNECTED TO A MYOCYTE 37
Oscillation region compared for two stem cell models
In Fig.3.6 the oscillation region is compared for two stem cell models for two values of expression level of IK1. Since the ratio ǫ = ττ12 << 1 the result of two models are close. From here, only
simplified model is the base of all following the investigations.
The oscillation region is empty for k values larger than 0.43. This emphasizes the role of k in induction of oscillations in a cell pair.
No oscillations
a)
k=0.233
Oscillations
Gap junction channels/Cell
pa
ce
m
ake
r
cha
nne
ls
/Ce
ll
No oscillations No oscillationsk=0.3
b)
Gap junction channels/Cell
pa
ce
m
ake
r
cha
nne
ls
/Ce
ll
Stem-mh Stem-h3.1.4 Dependance of period of oscillation on parameters
In a pair of stem cell and myocyte connected, the period of the oscillation depends on level of expression of IK1(or k), number of gap junction channels per cell (or n) and number of pacemaker
channels per cell (or N) Fig.3.7.
Increasing the number of gap junction channels stabilizes the period of oscillation, except in Fig.3.7b that oscillation disappears for large number of gap junction and pacemaker channels.
N=1*10ˆ3
N=1.2*10ˆ5
N=5*10ˆ4
Gap junction channels/Cell
P
eri
od
(m
S
ec
)
a)
k=0.233
b)
N=5*10ˆ3 N=1*10ˆ4 N=1.2*10ˆ5Gap junction channels/Cell
P
eri
od
(m
S
ec
)
k=0.3
Figure 3.7: Period of oscillation dependance on number of gap junction channels/Cell and number of pacemaker channels/Cell. Dashed vertical line shows number of gap junctions in experiment [5].
3.2. STEM CELLS AS A PACEMAKER IN A FIBER 39
3.2
Stem cells as a pacemaker in a fiber
For one dimensional calculations we took a fiber of 201 myocytes Fig.3.8(L = 20.1 mm is considered as infinitely long). Pacemaker region consists of stem cells connected to the myocytes and not connected together. We put this pacemaker region (l = 4.3 mm) in the middle of the fiber.
Note that we used cell dimension 100 × 10 × 10µ so dx = 100µ. Myocyte and stem cell capacitance is ∼ 95pF and specific membrane capacitance is ∼ 1µF/Cm2.
In Fig.3.9 induction of oscillation in a fiber is shown. Threshold for inducing oscillations increases much more in a fiber (see chapter: two and three dimensional cardiac tissue).
Figure 3.8: A Schema of fiber of myocytes with a pacemaker region in the middle.
mSec m V a) n=1 mSec n=3 m V b) mSec m V c) n=200
Figure 3.9: Fiber: Induction of oscillations by stem cells. a-c) Pacemaker length l = 4.3 mm, N = 5 × 10⁴,k=0.233.
3.2.1 Pacemaker length in a fiber
In Fig.3.10, it is seen that for a longer fiber, a longer pacemaker region is needed to induce oscillation. This length is different for different number of gap junction and pacemaker channels.
Fiber length (mm) P ac em ake r le ngt h (m m )
Figure 3.10: Pacemaker length needed to induce oscillations in a fiber. Parameters: n = 100, N = 6 × 10⁴, k=0.233.
3.2.2 Oscillation’s amplitude in the fiber
In Fig.3.11 oscillations amplitude increases with the distance from the pacemaker region. It is observed in a case of a small source-sink mismatch: a current load for the pacemaker channels decreases oscillation amplitude, but it remains above the propagation threshold. While propagating, AP gaines its normal amplitude 100mV.
mSec
m
V A
B
Figure 3.11: Amplitude of oscillations increases with the distance from the pacemaker region. Potential was recorded inside pacemaker region (point A) and at a remote point B.
3.2. STEM CELLS AS A PACEMAKER IN A FIBER 41
3.2.3 Oscillation region for a fiber
Oscillation region for stem-mh model
Oscillation region for stem-mh model is shown in Fig.3.12. It is seen that in a fiber (same as in a cell pair) increasing k will result in shrinking the oscillation region.
Oscillations N o os ci lla tions a) k=0.233 p ac em ak er c h an n el s/ C el l
Gap junction channels/Cell
No oscillations Oscillations b) k=0.3 pa ce m ake r cha nne ls /Ce ll
Gap junction channels/Cell
k=0.4
No oscillations
c)
Oscillations
Gap junction channels/Cell
pa ce m ake r cha nne ls /Ce ll
Oscillation regions for stem-h model
Same investigation is done for stem-h model. Same is seen that increasing k will result in shrinking the oscillation region.
Oscillations N o os ci lla tions a) k=0.233 p ac em ak er c h an n el s/ C el l
Gap junction channels/Cell
No oscillations Oscillations b) k=0.3 pa ce m ake r cha nne ls /Ce ll
Gap junction channels/Cell
Oscillations c) k=0.4 pa ce m ake r cha nne ls /Ce ll
Gap junction channels/Cell
No oscillations
3.2. STEM CELLS AS A PACEMAKER IN A FIBER 43
Comparison of the oscillation regions for two stem cell models
In Fig.3.14 the oscillation regions are compared for two models. With k = 0.4, oscillations region shrinks so strongly that with k > 0.4, oscillations are not possible anymore. Note that it means that stem cells can never induce oscillations in normal myocytes (described by BR model).
Oscillations N o os ci lla tions a) k=0.233 p ac em ak er c h an n el s/ C el l
Gap junction channels/Cell
No oscillations Oscillations b) k=0.3 pa ce m ake r cha nne ls /Ce ll
Gap junction channels/Cell
Stem-h Stem-mh k=0.4 No oscillations c) Stem-mh
Gap junction channels/Cell
pa ce m ake r cha nne ls/Ce ll HCN2 Stem-h
3.2.4 A paradox: Oscillation region is larger for the fiber than for a stem cell
Intuitively, It is expected that it is more difficult to induce oscillations in a fiber than in a cell pair or in other words, more current is needed for a certain number of myocytes than only one. It is not the case. Why?
Also, oscillation region in a fiber is larger than in a cell pair. It looks like a paradox, but it is not.
Explanation is that oscillation region is larger only for large currents from a stem cell (large N, large n). In a cell pair, such large currents abolish oscillations.
In a fiber, the myocytes are not connected to stem cells directly. In such myocytes, the current delivered from stem cells is smaller, and therefore for some of myocytes it appears inside the oscillation region. Threshold for inducing oscillations increases much more in a fiber (see chapter: Result: two and three dimensional cardiac tissues).
3.2.5 Reducing period of oscillation by connecting stem cells to neonatal
my-ocytes
In experiments [5], they observed that transfected stem cells (hMSCs) influenced beating rate in vitro when plated onto a localized region of a coverslip and overlaid with neonatal rat ventricular myocytes. The coculture beating rate was 93±16 when hMSCs were transfected with control plasmid and 161 ± 4 bpm when hMSCs were expressing mHCN2. In Fig.3.15b the same is obtained.
We investigated the dependence of oscillation period on both: number of pacemaker channels per cell N and number of gap junction channels per cell n for a large interval of their variation that is even not accessible in todays experiment in Fig.3.15a.
It is seen that for auto-oscillating myocytes (k = 0.215), oscillation is affected by number of gap junction channels n only and is almost independent on number of pacemaker channels N .
In other experiments [37], they observed a long-term survival of transplanted neonatal rat myocytes and the contribution of these cells to improve cardiac function.
3.3
Multiple connection
Experimentalists expected that having multiple connection between a myocyte and a stem cell in-creases the possibility of having oscillation. In the experiment Fig.2.4, different kinds of connection was observed: a stem cell to two(many) myocytes and a myocyte to two(many) stem cells.
3.3. MULTIPLE CONNECTION 45 612 576 432 a) k=0.215 P ac em ake r c ha nne ls /Ce ll
Gap junction channels/Cell
T~ 425 mSec k=0.215 b) mSec m V M MS
Figure 3.15: Fiber: Decrease of oscillations period by stem cells. a) Dependence of oscil-lation period T on N and n. Note that the period is the same along every vertical line. b) An example of record with n=320, N = 1.1 × 10⁶. M- myocytes alone; MS- myocytes and stem cells. Pacemaker length l = 4.3 mm.
Several stem cells connected to one myocyte
We will investigate a case when two stem cells are connected to a myocyte. By connecting two stem cells to a myocyte, oscillation will disappear later than when there is only one stem cell connected to a myocyte, Fig.3.17.
In Fig.3.18 oscillation is compared between cases when one or two stem cells are connected to one myocyte. It is seen that oscillation will disappear for larger k in case of two stem cells connected to a myocyte. This confirms that large number of stem cells are needed to induce oscillation in a real heart. (Meanwhile, only 50 stem cells made gap junctions over 106 injected [5]).
Several stem cells connected to myocytes in a pacemaker region
In the pacemaker region, stem cells may be connected either to every myocyte, or to every second, every third, etc. myocyte. Respectively, we call stem cell concentration in the pacemaker region: 100%, 50%, 33% etc. In Fig3.19a a schema of such concentration of stem cells in the pacemaker region is shown.
Fig3.19b shows that a moderate decreasing of stem cells concentration in a pacemaker does not destroy oscillations, but increases the oscillation period.
In Fig3.19c the period of oscillation is shown according to the number of stem cells connected to one myocyte. Stem cell concentration 100%, 50%, means one stem cell per 1 myocyte or 2 myocytes, respectively 200% means 2 stem cells per one myocyte.
Several myocytes connected to one stem cell
Real problem appears when one wants to induce oscillations in a real heart, when number of myocytes are increased. Fig.3.16 is an example to show how one stem cell can induce oscillations in two myocyte with low k but as soon as k increases, oscillation disappears.
mSec m V a) k=0.233 mSec m V b) k=0.3
Figure 3.16: one stem cell can induce oscillations in two myocyte with low k but as soon as k increases, there would be no oscillations. Parameters: number of gap junction channels n = 100, number of pacemaker channels N = 104.
3.3. MULTIPLE CONNECTION 47 mSec m V a) k=0.233 1 S 2 S mSec m V b) k=0.3 1 S 2 S mSec m V c) k=0.329 1 S 2 S mSec m V d) k=0. 32964764 1 S 2 S
Figure 3.17: Oscillations compared for one or two stem cells connected to one myocyte. In a,b and c) period of oscillation decreases. Parameters in stem cell: number of gap junction channels n = 100, N = 104.
mSec m V a) k=0. 32964765 1 S 2 S mSec m V b) k=0.33 2 S mSec m V c) k=0.331 2 S
Figure 3.18: a) Oscillation disappears when only one stem cell is connected to the myocyte while having 2 stem cells maintains oscillation. In b,c) it is showed that how oscillation disappears for two stem cells connected to the myocyte. Note that k is larger when there are two stem cells when oscillation disappears. Parameters in stem cell: number of gap junction channels n = 100, N = 104.
3.3. MULTIPLE CONNECTION 49
Gap junction channels/Cell
P eri od ( m S ec ) 100% 50% 33% b) k P e ri od (m S e c ) 100% 50% 200% c)
Figure 3.19: Decreasing stem cells concentration(dilution) in a pacemaker increases the oscillations period. a) shows stem cell dilution of 50% inside the pacemaker region. b) Period of oscillation for different stem cell dilutions in the pacemaker region in a Fiber. c) Stem cell concentration 100%, 50%, means one stem cell per 1 myocyte or 2 myocytes, respectively 200% means 2 stem cells per one myocyte. A pacemaker l = 4.3 mm length is composed of stem cells connected to myocytes. Fiber length L = 20.1 mm , k = 0.233 , N = 5 × 10⁴.
Chapter 4
Stem cells with HCN1 gene in cardiac
tissue
4.0.1 HCN1 isoform
The theoretical predictions for future experiments to incorporate HCN1, HCN4 isoforms into the biological pacemakers is presented in the current and the following chapters. Since the experimental-ists have already chosen HCN2 as a successful choice and HCN1, HCN4 have similar characteristics, they might be considered same successful.
We will only investigate HCN1, HCN4 since HCN3 is almost not present in cardiac muscle (only low level traces of HCN3 are found in embryonic pacemaker cells [13]).
HCN1 channels display fast gating properties and are expressed at low levels in SA node and largely absent in ventricle.
We used experiment [8],[9] when Xenopus oocyte transfected by HCN1 (when a voltage step is applied to it, similar to the experiment [5]), as far as no experiment was performed by transfecting stem cells with HCN11 (one reason that HCN1 was not chosen for experiments instead of HCN2 might be that it is almost unaffected by cAMP[9]).
4 Sec test potential was done [8],[9] varying from −40 to −110 mV in 10 mV steps holding potential and tail potentials were −40 mV. To adapt an experiment when a Xenopus oocyte is transfected by HCN1 to an experiment for a stem cell transfected by HCN1, we considered the difference between experiment conditions in both cases. It is important to note that stem cell experiments are performed at body temperature (36◦
C) and Oocyte experiments are done at the room temperature (20◦
C).
The records that are used for construction of the model are shown in Fig.4.1.
1
Even if the channel is considered to be expressed with the same characteristics in all platform cells, the activation depends although to cell type specificty [14] and this might be a general characteristic of this gene family.
Figure 4.1: Voltage step applied to Xenopus oocyte transfected by HCN1
4.1
Constructing a model of a stem cell transfected with HCN1
We constructed a simplified model (with inactivation only) for a stem cell transfected with HCN1 gene from experimental data [8],[9].
4.1. CONSTRUCTING A MODEL OF A STEM CELL TRANSFECTED WITH HCN1 53
Figure 4.3: current records from [8]
Estimating the time constant τ2(E)
Time constants for the inactivation gating variable τ2(E) for HCN1 and HCN2 genes [8] are shown
in Fig.4.2.
To adapt data [8] from 20◦
C to 36◦
C.
There is a very steep temperature dependence to the kinetics such that the time constant decreases between 3 and 6 fold for a 10◦
C change in the temperature. We may use this Q10 to estimate τ2 at
36◦
C. But because of decreasing of lipid layer viscosity with temperature, more accurate data can be obtained by calculating the ratio of time constants of HCN2 and HCN1 from [8].
As seen from Fig.4.5 the ratio is:
τHCN 2 τHCN 1 = ( 11, E = −85 mV 33, E = −125 mV
The total dependance is shown in Fig.4.4. From previously created model for HCN2, Fig.2.1, using this ratio, we obtained the time constants for HCN1 Fig.4.5b.
Estimation of inactivation variable g2(E)
Experimentally measured dependence of the current on voltage Fig.4.3 gives inactivation variable g2 dependance on voltage Fig.4.5a. It is important to note that since both currents are negative,
we transformed the normalized current to a standard coordinates and the curve looks like Fig.4.5a.
This completes determination of the functions needed for the model of a stem cell transfected with HCN1 gene.
dEs/dt = −N σfgs(Es− Er)/C (4.1)
dgs/dt = (¯gs− gs)/τ2s(Es) (4.2)
where the reversal potential for HCN1 is −30 ± 2 mV (external solution 2 mM K+)[8].
τ
HCN2τ
HCN1mV
Figure 4.4: Ratio of τHCN 2
τHCN 1
Appendix to construction of HCN1 model
To adapt data [8] from 20◦
C to 36◦
C, a traditional approach is to use Q10 - the coefficient of
increasing the velocity of a chemical reaction by increasing the temperature by 10◦
C. Velocity of a chemical reaction depends on temperature as:
V = e−WKT
This permits to obtain the value Q16for transition from 20◦C to 36◦C, using a known value of Q10.
For transition from 20◦
C to 30◦


![Figure 2.5: Pacemaker current I f in an experiment with stem cells hMSCs transfected with mHCN2 gene [5]](https://thumb-eu.123doks.com/thumbv2/123doknet/13144266.388844/33.892.171.796.230.798/figure-pacemaker-current-experiment-stem-cells-hmscs-transfected.webp)


