Prof. W. A. Rosenblith Dr. T. T. Sandel** F. T. Hambrecht Prof. M. A. B. Braziert Dr. D. C. Teas J. G. Krishnayya Prof. M. Eden Dr. Eda Berger Vidale R. G. Mark Prof. M. H. Goldstein, Jr. Dr. T. Watanabett P. Mermelstein Prof. W. T. Peake Aurice V. Albert C. E. Molnarf
Prof. W. M. Siebert J. Allen D. F. O'Brien
Dr. A. E. Albert R. M. Brown R. R. Pfeiffer
Dr. J. S. Barlowt W. H. Calvin C. E. Robinson
W. A. Clark** R. R. Capranica E. N. Robinson
Dr. B. G. Farley** T. H. Crystal G. Svihula
Dr. G. L. Gerstein J. W. Davis J. R. Welch
Dr. R. D. Hall Margaret Z. Freeman M. L. Wiederhold Dr. N. Y-S. Kiangtf J. L. Hall II T. F. Weiss
A. H. Crist
A. SPONTANEOUS ACTIVITY OF SINGLE UNITS IN THE COCHLEAR NUCLEUS
Single units in the nervous system frequently exhibit spikelike discharges in the absense of any controllable stimulation presented externally to the organism. The nature of these "spontaneous" discharges suggests that statistical descriptions might well
reveal some basic properties of the units.
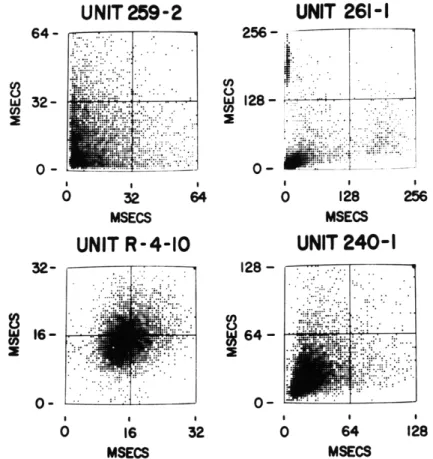
In recent studies of the cochlear nucleus we have encountered many types of spon-taneous discharge patterns. Some examples of these patterns are shown in Fig. XVIII-1. Each trace shows a series of spikelike deflections that represents the all-or-none dis-charges of a different single unit. Obviously there are some gross differences in the time patterns of the spikes. Unit 261-1 seems to fire in bursts; unit R-4-10 seems to fire almost regularly with no very long intervals between spikes; units 259-2 and 240-1 show irregular patterns of firing at different average rates.
Figure XVIII-2 shows interspike interval histograms2 for the same data from which Fig. XVIII-1 was chosen. The histogram for unit 259-2 appears to be unimodal and asymmetric with an exponential tail. The histogram for unit R-4-10 appears to be uni-modal and symmetric. Further analysis shows that this histogram is fitted rather indifferently by a Gaussian distribution. The histogram for unit 261 is bimodal and asymmetric. The histogram for unit 240-1 is unimodal, asymmetric, and has a tail
This work was supported in part by the National Science Foundation (Grant G-16526); and in part by the National Institutes of Health (Grant MH-04737-02).
tVisiting Professor of Communication Sciences from the Brain Research Institute, University of California at Los Angeles.
lResearch Associate in Communication Sciences from the Neurophysiological Laboratory of the Neurology Service of the Massachusetts General Hospital.
**Staff Member, Lincoln Laboratory, M.I.T.
ttAlso at the Massachusetts Eye and Ear Infirmary, Boston, Massachusetts. tStaff Associate, Lincoln Laboratory, M.I. T.
UNIT 259-2
UNIT R-4-IO ,, 1, i 1- I T I I I
U N IT R -4 - 710 d L ..i , ... ... ... ., J , , , rl ! 1 111. I fT I.. .!.-,1 1 .. ... 17, .J ... ... ... i.. l ,Oi, r 1-1
77 711 71'i
-- '-r -' " "lqrlZqq rT rrq-m, --T..r 1r7 , ...- 1 '' 1-7 1 ir'' '~
T,' ' ' r' l UNIT 261-1Fig. XVIII- 1. Film strips of the spontaneous activity of four selected units. Upward deflections indicate negativity of the microelectrode relative to the headholder.
UNIT 259-2
SFQ48- ' 6; priT 120/dl-T
32 64
MSECS
NO.
UNIT R-4-IO
1
.
.
.
.
...
.
.
.
..
.
.
.
.
.
.
..... 14MS-2 A--8 SP IEPI !VC, 1:1 72,I NO.UNIT
261-1
2048 wif"i i 1024 0 0 128 256 MSECSNO.
UNIT 240-1
1024 ii 13i6 E '4 i W- 1 4 7. Ei e .. .. .. ... ... ... .512
0
64 128 MSECSFig. XVIII-2. Interval histograms for shown in Fig. XVIII-3. Unit 259-2, N = 40, 960; 16, 384; Unit 240-1, N =
0 128 256
MSECS
the spontaneous activity of the four units The number N of intervals processed: Unit R-4-10, N = 5000; Unit 261-1, N 16, 384.
NO.
2048
1024
0
512 2560
.,l..iu., ... ii.j,,.~i.llil.. .i'LL LI-YI .VI ~~~--L--Y--Y --i._L-ll.~)- CLI-~IIY -L-.Y- -LU~L_~L -i-Lill-~-_il~-- -~.Y-II-1I~I-III-I-L~ L-L-~Y--II~I~-L- -iL
'". . "
f ' ' " t II I
that decays more slowly than does an exponential curve.
Figure XVIII-3 shows joint interval histograms3 for the same units.
If we examine
the cluster at the upper left and the one at the lower right we see that there is a tendency
for a long interval (approximately 200 msec) to be preceded by a short interval
(approxi-mately 8 msec) and to be followed by a medium interval (approxi(approxi-mately 30-60 msec).
Further analysis of the joint interval histograms for the remaining three units shows
that these units exhibit less correlation between successive intervals. For unit 240-1
there is a strong positive correlation between successive intervals for intervals
of less
than 30 msec, but rather little correlation for longer intervals.
Unit R-4-10 shows a
very weak positive correlation between successive intervals. In the mean, short
inter-vals tend somewhat to be followed by short interinter-vals, and long interinter-vals by long
inter-vals.
Finally, unit 259-2 shows linear independence of successive intervals.
The information given in this report suggests descriptive models for the spontaneous
UNIT 259-2
64-
...
32-
.. ', I .4: 0 ; -I:.' . . .. .: : 0 - ", : ..MSECS
UNIT R-4-10
o
16
32
MSECS
UNIT
261-1
256
-
S128-0 ... : .: .:' ::. : ",,. . :, • .: . !- ! I128
-
0-0
128
256
MSECS
UNIT 240-1
2
..
.
.'i:
.
I I I0
64
128
MSECS
Fig. XVIII-3.
Joint interval histograms for the four selected units.
The abscissa
represents
T1,
the first of each ordered pair of intervals, the
ordinate represents
T2,the second of each ordered pair of intervals.
The number of interval pairs processed for each unit was 4096.
0-(XVIII. COMMUNICATIONS BIOPHYSICS)
discharge patterns of the several units. For example, measurements on unit R-4-10 suggest a basically periodic process with an uncorrelated, quasi-Gaussian time jitter. By contrast, for unit 259-2, the exponential tail, the absence of very short intervals, and the linear independence of successive intervals suggest a Poisson-like process with a dead time.
There are some indications that discharges occurring in bursts, such as for unit 261-1, may be correlated with injury. Additional measurements on the spike train of unit 240-1 are needed in order to suggest a model.
R. W. Rodieck, N. Y-S. Kiang, G. L. Gerstein
References
1. N. Y-S. Kiang, A category of cells in the cat's cochlear nucleus defined by electrophysiological experiments, Quarterly Progress Report No. 61, Research Labo-ratory of Electronics, M.I.T., April 15, 1961, pp. 179-183.
2. G. L. Gerstein and N. Y-S. Kiang, An approach to the quantitative analysis of electrophysiological data from single neurons, Biophys. J. 1, 15-28 (1960).
3. G. L. Gerstein, Joint probabilities in firing patterns of a single neuron, Quarterly Progress Report No. 63, Research Laboratory of Electronics, M.I.T., October 15, 1961, pp. 176-180.
B. THE EFFECTS OF BACKGROUND NOISE ON EVOKED CORTICAL RESPONSES IN UNANESTHETIZED CATS
Previously we described1
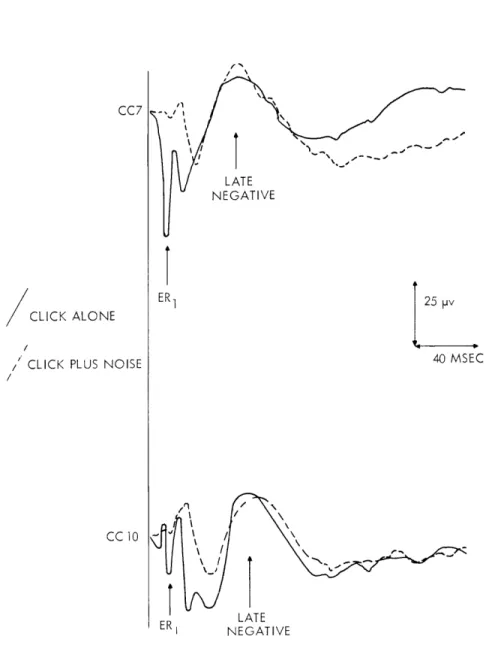
certain characteristics of the evoked response complex (ERC) recorded with gross electrodes implanted over the auditory cortex of cats. We have demonstrated that various components of the ERC behaved differently as the "state" of the animal changed. In the averaged response, the ER 1 (see Fig. XVIII-4), a surface-positive deflection with a peak latency of 8-12 msec, remained essentially unchanged after prolonged exposure to acoustic clicks or after injections of Nembutal anaesthesia. In contrast, a later, longer-lasting surface-negative component with a peak latency of 60-80 msec was markedly reduced after prolonged exposure to the clicks or after admin-istration of Nembutal. The fact that the ER 1 precedes the later negative component suggests the possibility that the negative component is dependent upon the presence of the ER1. Data that bear on this question have recently been obtained from experiments in which acoustic clicks are presented in a background of noise.
The recording procedure was similar to that reported previously.1 All responses shown in Figs. XVIII-4 and XVIII-5 were taken while the animal was awake. Clicks at a constant rate and intensity were delivered into the room by a loud-speaker. Continuous background noise was then presented at several intensities. The responses from the cortex were averaged by the ARC-1 computer. The averaged responses to clicks alone
LATE NEGATIVE
ER1 25
pV
CLICK ALONE
/ CLICK PLUS NOISE 40 MSEC
/
CC 10 \\
LATE
ER1 NEGATIVE
Fig. XVIII-4. Averaged evoked responses to clicks taken from two awake cats (CC 7 and CC 10) with and without background noise. Solid traces, clicks alone; dotted traces, clicks in the presence of noise. The intensity level of the clicks is approximately 50 db re detection level of the averaged responses. Number of responses averaged, 64. For this figure noise intensities were chosen so that the ER1 was reduced substantially, while the later negative
component was not.
(XVIII. COMMUNICATIONS BIOPHYSICS)
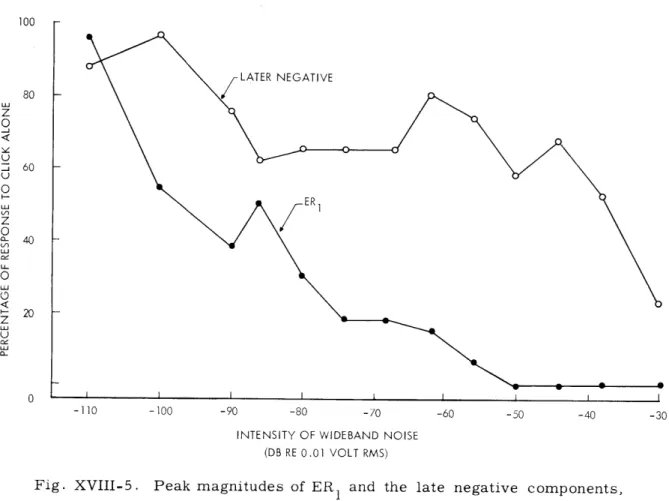
100 r
*LATER NEGATIVE
-110 -100 -90 -80 -70 -60 -50 -40
INTENSITY OF WIDEBAND NOISE (DB RE 0.01 VOLT RMS)
Fig. XVIII-5. Peak magnitudes of ER 1 and the late negative components, expressed as percentages of the magnitudes of the response to the click alone, plotted for a number of background noise levels. The decrease in magnitude of ER1 is greater than that of the late negative component for a wide range of noise levels.
are shown in Fig. XVIII-4 (solid traces). With background noise the ERI is markedly reduced in amplitude, while the negative component remains relatively unchanged (dotted traces).
That this differentiation by background noise is only effective over a certain range of noise levels is shown in Fig. XVIII-5 in which the amplitudes of the ER1 and the negative components, respectively, are plotted as functions of the intensity of the back-ground noise. The ER1 becomes almost undetectable at noise levels above approxi-mately -50 db (re 0.01 volt rms into the loud-speaker) while the negative component is still large. At this intensity of noise the clicks are still clearly audible to the experi-menter through monitor earphones. At still higher levels of noise (greater than -30 db) the clicks can no longer be detected by the experimenter, and the entire ERC, including the late negative component, disappears. The effect of background noise in selectively reducing the ER1 has been demonstrated repeatedly in each of four different animals.
in the later negative component is strong evidence that the later deflections in the ERC may not be dependent upon the presence of a synchronized ER 1. 2 These facts may be interpreted as follows. The ER1 reflects activity arriving by one pathway, while the later negative component reflects activity arriving by another. The pathway that gives rise to ER 1 may thus be highly sensitive to background noise under our experimental conditions, while the activity in the other pathway may be much less so. This inter-pretation, according to which the early and late components of the ERC may represent activity from separate pathways, is consistent with the demonstrated existence of mul-tiple pathways to the cortex.3-5
D. C. Teas, N. Y-S. Kiang
References
1. D. C. Teas and N. Y-S. Kiang, Evoked cortical responses as a function of "state" variables, Quarterly Progress Report No. 63, Research Laboratory of Elec-tronics, M.I.T., October 15, 1961, pp. 171-176.
2. M. H. Goldstein, Jr. and N. Y-S. Kiang, Synchrony of neural activity in electric responses evoked by transient acoustic stimuli, J. Acoust. Soc. Am. 30, 107-114 (1958).
3. J. Hanberry and H. Jasper, Independence of diffuse Thalamo-cortical projection system shown by specific nuclear destructions, J. Neurophys. 16, 252-271 (1953).
4. R. Galambos, R. E. Myers, and G. Sheatz, Extra-lemniscal activation of audi-tory cortex in cats, Amer. J. Physiol. 200, 23-28 (1961).
5. J. Goldberg and W. D. Neff, Frequency discrimination after bilateral section of the brachium of the inferior colliculus, J. Comp. Neur. 116, 265-290 (1961).
C. CONTROL OF EYE MOVEMENTS IN RELATION TO THE VESTIBULAR SYSTEM AND NECK PROPRIOCEPTIVE MECHANISMS IN MAN
A frequently reported symptom of patients who have suffered a loss of vestibular function is a disturbance in visual fixation while they are in motion.1-4 The disability appears to persist, to some extent at least, permanently.2 Thus, patients may complain of their vision being "jumbled," or that their eyes feel as though they were "set in Jello," when there is sudden passive movement, as for example when riding in an automobile over a rough road or uneven pavement. It may be impossible for such patients, while walking, to recognize other persons. The great importance of the vestibular apparatus in the stabilization of fixation of gaze has been stressed, on the basis of clinical obser-vations, , 3,4 and an analogy has been made between the aspect of vestibular function and the use of stable platforms in fire control2: "The platform which carried telescopes for spotting naval or aerial targets has to be stabilized against roll and change of course and pitch of the battleship .. . . In the same way, if the head and the eyes are stabilized against movement of the body, it is possible for the fixation reflex to operate to keep
(XVIII. COMMUNICATIONS BIOPHYSICS)
the target on the fovea." The analogy can equally well be extended to the subsequent use
of stabilized platforms in automatic radar-directed fire-control systems,5 and also to
the use of stabilized platforms in inertial guidance systems, particularly those employing
automatic star-tracking devices.
6In a recent review of the control of eye movements,
it was stated: "It is
remark-able that there is no coherent view on the relation between reflex mechanisms originating
in the neck, labyrinth, and eyes, which act upon the eye muscles." More recently, the
importance of neck proprioceptive mechanisms has been re-emphasized.
In an attempt to gain some further understanding of the nature of control of eye
move-ments, both in normal subjects and in patients with absence of labyrinthine function,
recordings were made under a variety of conditions from several normal subjects and
from a patient who had entirely lost labyrinthine function subsequent to streptomycin
toxicity to the vestibular apparatus.
Recordings included: (a) the position of one of the
eyes, measured electro-oculographically8,
9
by means of electrodes applied directly
above and below the eye (or in the horizontal plane, for horizontal tracking experiments);
(b) the position of a spot on an oscilloscope directly in front of the subject's eyes (at a
distance of 20 cm); (c) the orientation of the head with respect to the vertical, in an
anteroposterior plane, recorded by means of a Grass Instrument Company's
acceler-ometer affixed to the forehead of the subject.
The output of the accelerometer in the earth's gravitational field is proportional to
the sine of its angle of inclination with respect to the vertical; for small angles, the
output is proportional to the angle.
Additional components in the output of the
acceler-ometer which are due to acceleration and deceleration of the head about a horizontal
axis, remain small compared with the component that indicates its position in the
earth's gravitational field, for frequencies of movement of the head of less than
aproxi-mately 3 per second.
Electro-oculographic recording of eye position, in contrast to optical methodsl
0(in
which a beam of light is reflected off the cornea), permits recordings to be made with
the head in motion, or with the eyes closed. In the recordings reported here, bentonite
paste electrodes were employed; subsequently, nonpolarizable silver-silver chloride
electrodes were employed to avoid the inherent dc drift encountered with bentonite
elec-trodes.
Direct-current recordings were made onto paper and onto FM magnetic tape,
by means of a Grass Instrument Company's polygraph and a 4-channel push-pull to a
single-ended cathode-follower unit, the design of which was provided by Robert Grass
of the Grass Instrument Company.
The frequency response of the recording system
was from dc to 35 cps.
All recordings were of 4 minutes duration.
For the study of eye movements in tracking experiments, techniques of analysis and
11-13displays basically in the frequency domain have often been used.
The displays
employed with frequency-domain analysis, however, do not permit a direct and ready
comparison of results with those from conventional reaction-time experimentsl3 nor with results of studies of cerebral evoked responses.14
For the analysis of the present recordings, time-domain analysis in the form of autocorrelation and crosscorrelation was employed. Autocorrelograms provide a sum-mary display of the statistical characteristics of the signal in each instance, and cross-correlograms provide a direct display of time relationships between signals, averaged over the 4-minute recordings in each case. For analysis, the original magnetic-tape recordings were speeded up 50 or 100 times. Autocorrelograms were computed at
5sec. -r--15
POSITION 15*
AUTOCORRELOGRAMS DELAY T (sec.)
0 12 34 56 0 1 2 3 45
SPOT EYE
POSITION POSITION
CROSS-CORRELOGRAMS OF EYE POSITION WITH SPOT POSITION 7c.
-4 -2 2 4 -.4 -2 0 .4
Fig. XVIII-6. Vertical tracking of a randomly repositioned spot, head fixed. Inter-val between successive repositionings of spot, 1 sec. Eye-scope distance, 20 cm. Duration of recording analyzed, 4 minutes. The calibrations for position of spot and for position of eye is approxi-mately the same for Figs. XVIII-7 through XVIII-18. Delay scale is in seconds. The arrow indicates the peak in the crosscorrelogram, and refers to average oculomotor reaction time. (Subject: J.B.)
(XVIII. COMMUNICATIONS BIOPHYSICS)
5
sec.
SPOT
POSITIONEYE
A
J$
POSITION
AUTOCORRELOGRAMS 0 2 3 4 5 0 1 2 34 5 SPOT - - EYE POSITION POSITIONCROSS-CORRELOGRAMS OF EYE POSITION WITH SPOT POSITION .03sec.
-4 -2 0 2 4 -.4 -2 /.2 .
U'
Fig. XVIII-7. Vertical tracking of a randomly moving spot; head fixed. Amplitude and calibration for spot and eye positions approximately the same as in Fig. XVIII-6. (Subject: J.B.)
50-msec delay (AT) intervals; crosscorrelograms at 50- and 10-msec AT intervals. Results of recordings from a normal subject are shown in Figs. XVIII-6 through XVIII-11. As a preliminary part of the experiment, an attempt was made to determine oculomotor reaction time. For this purpose, recordings were made while the subject was attempting to fixate on a spot on the oscilloscope which was periodically repositioned to a new vertical location that was independent of the previous location. Such a signal, as the input for the vertical deflection plates of the oscilloscope, was obtained by means of a noise generator and one of the sample-and-hold circuits available in the Analog Computer for Neurophysiology1 5,16 located in the Neurophysiology Laboratory of the Massachusetts General Hospital.
Results from this preliminary experiment, together with a portion of the corre-sponding ink traces, are shown in Fig. XVIII-6. The fact that the autocorrelogram of
the input signal to the vertical axis of the oscilloscope falls to the base line at a delay of 1 sec, and thereafter remains essentially at the base-line level, indicates the unpre-dictability of successive positions of the spot on the oscilloscope. The autocorrelogram for the position of the eye shows an initially rapidly declining component superimposed on the more steadily declining one that was evident for the spot-position signal; this initially rapidly decaying component is a reflection of the overshoot of eye position that frequently appears immediately upon redirection of the gaze and before the correct fixa-tion point is obtained. The presence of eye-blinks in the recording also contributes to this initial component. An average reaction time before initiation of ocular movements, which follows each change of spot position, is seen from the crosscorrelograms to be approximately 170 msec.
The subject, with head fixed, was then required to track a continuously moving spot
10
sec.
EYE
I
POSITION HEADPOSITION
I
AUTOCORRELOGRAMS 0 2 3 4 5 0 I 2 3 4 5 EYE POSITION HEAD POSITIONCROSS-CORRELOGRAMS OF EYE POSITION WITH HEAD POSITION -4 -2 0 2 4
.05 sc. -.4 -2 .2 .4
Fig. XVIII-8.
Tracking of fixed spot; passive vertical rotation
of the head.
(Subject: J.B.)
&Z
rA
FJff#MJffffM J IfF viol ffullfilmliffis "Er gal Is it, W IM I Big it imam flu R 11121 4% WSW U11 \1 RL UI NU A i ,TAFF R. NO If 9 V
101411
I.LIL! 5sec. SPOT POSITION EYE POSITION HEAD POSITION AUTOCORRELOGRAMS SPOT POSITION 012345 CROSS-CORRELOGRAMS
EYE POSITION WITH SPOT POSITION
-4 -2 0 2 4
EYE POSITION WITH HEAD POSITION
-4 -2 0 2 4 EYE POSITION 0 2 3 4 5 HEAD POSITION 01234 5 .12sec. -.4 -2 02 .4 -77
HEAD POSITION WITH SPOT POSITION
-4 -2 0 2 4
Fig. XVIII-9.
Vertical tracking of a randomly moving spot; passive
movement of head.
(Subject: J.B.)
5 sec.
EYE
A Al AA
AANf
A11
1A1
POSITION
'J
\J j
\\f\
I~\j
I
AUTOCORRELOGRAMS
0 I 2 3 4 5 0125450 0 I 2 3 4 5
EYE - HEAD
POSITION
POSITION
CROSS-CORRELOGRAMS OF EYE POSITION WITH HEAD POSITION 0
-4 -2 0 2 4 -.6 -.4-2 .2 .4
Fig. XVIII-10. Tracking of fixed spot; active vertical rotation of head. (Subject: J.B.)
on the oscilloscope; for this purpose the vertical-axis input was a random signal that had been prerecorded at a higher speed onto the same tape. Autocorrelograms for the noise signal and eye position, and the crosscorrelogram for these two, are shown in
Fig. XVIII-7. It is apparent that the general shape of the two autocorrelograms is much the same, and the fact that the peak of the crosscorrelogram occurs very close to zero delay (0.03 sec) indicates an average tracking with very little time delay.
In Fig. XVIII-8, results are shown from a recording during which the spot on the oscilloscope was kept fixed, and the subject fixated on the spot while the experimenter rotated the subject's head by hand about an axis through the neck and parallel to the shoulders (i.e., flexion and extension of the neck). In the ink trace (for which one-half of the usual paper speed was used), the position of the eye is indicated in the upper trace, and the angular position of the head, as monitored by the accelerometer, is shown in the lower trace. In this recording, the distance between the eye and the oscilloscope
(XVIII. COMMUNICATIONS BIOPHYSICS)
screen was approximately 25 cm. The similarity between the autocorrelogram for head position and that for eye position is evident. The crosscorrelograms for these two indicate that the eye position lagged the head position by an average of approximately 50 msec.
In Fig. XVIII-9 are shown results obtained from a recording for which the subject was visually tracking the randomly moving spot on the oscilloscope at the same time that his head was being passively moved. Autocorrelograms are shown for the position of the spot on the oscilloscope screen, the position of the eyes, and the position of the head. It is apparent that the average frequency of movement of the head was somewhat greater than that of the randomly moving spot. Crosscorrelograms are shown for the eye position with spot position, eye position with head position, and head position with spot position, respectively. When the position of the eyes is crosscorrelated with the position of the spot, it is apparent that there is a lag of approximately 120 msec of eye
EYE POSITION HEAD POSITION AUTOCORRELOGRAMS EYE POSITION 01 234 5 HEAD POSITION
CROSS-CORRELOGRAMS OF EYE POSITION WITH HEAD POSITION .I0 sec.
-4 -2 02 .4
Fig. XVIII-11. Relation between eye position and head position for passive vertical rotation of head; eyes closed. (Subject: J.B.)
SPOT POSITION iTi
-n
-m
5sec. m - I I /-- / 7 r r i !__1 EYEN
POSITIONK
AUTOCORRELOGRAMS DELAY 'T (sec) 012 345 SPOT POSITIONRT
~
141
0 1 2 345 EYE POSITIONCROSS-CORRELOGRAMS OF EYE POSITION WITH SPOT POSITION -4 -2 0 2 4
Fig. XVIII-12. Vertical tracking of a spot randomly repositioned every 1. 2 sec; head fixed. (Subject: W.T.)
position with respect to spot position. On the other hand, crosscorrelation of the eye
position with the head position indicates that the position of the eyes was slightly
antic-ipatory to that of the head, by approximately 30 msec.
In this recording the movement
of the head was independent of that of the spot, and therefore the crosscorrelogram of
these two is essentially flat, except for minor irregularities arising from sampling
artefact which would decrease progressively as the length of the recording is increased.
Results from a recording for which the spot on the oscilloscope was maintained in
a fixed position and the subject was actively moving his own head while directing his
gaze at the spot are shown in Fig. XVIII-10.
The average frequency of movement of
head is approximately 1. 1 per sec, and it is of interest that there appears to be no time
lag between eye position and head position, in contrast to the lag of
approxi-mately 50 msec which appeared when the subject's head was being passively
moved (Fig. XVIII-8).
150
15
(XVIII. COMMUNICATIONS BIOPHYSICS)
From the ink recordings of eye movements in Figs. XVIII-7, XVIII-8, XVIII-9, and
XVIII-10, it is apparent that the traces of eye movements in Figs. XVIII-8 and XVIII-10
(spot fixed, head moving) are considerably smoother than that in Fig. XVIII-7 (head
fixed, spot moving).
The tracing of eye movement in Fig. XVIII-9 (head and spot
moving) is intermediate in smoothness between these two extremes.
In Fig. XVIII-11, results are shown of a recording for which the subject's head was
being moved while his eyes were kept closed.
The tracing of eye position once again
assumes a somewhat irregular character (compare its autocorrelogram with that for
eye position in Fig. XVIII-10).
In general, it remains correlated with the position of
the head, but lags the head by approximately 100 msec, an appreciably greater time
lag than that observed with eyes open (Figs. XVIII-7 through XVIII-10).
Results of recordings from a patient who had suffered loss of vestibular function
following streptomycin toxicity to the vestibular apparatus (hearing remained intact)
5sec
EYE I POSITION SPOTPOSITION
AUTOCORRELOGRAMS 0 1 2 3 4 5 0 12 3 4 5 EYE SPOT POSITION POSITIONCROSS-CORRELOGRAMS OF EYE POSITION WITH SPOT POSITION oesec.
-4 -2 0 2 4 -. 4 2 0.2 .4
Fig. XVIII-13.
Vertical tracking of a randomly moving spot; head
fixed.
(Subject: W.T.)
are shown in Figs. XVIII-12 through XVIII-18. In Fig. XVIII-12 are shown results of vertical visual tracking of an unpredictable signal of the same type as that in Fig. XVIII-6, except that the time interval between random repositioning was 1. 2 sec instead of 1.0 sec. It is apparent that there is a greater difference between these two autocorrelograms than for the pair of autocorrelograms in Fig. XVIII-6, a difference
suggesting poorer tracking by subject W. T. which is substantiated by comparison of the inked traces in Figs. XVIII-6 with those of Fig. XVIII-12. The average latency of
oculomotor response in Fig. XVIII-12 is seen from the crosscorrelograms to be approx-imately 320 msec, appreciably longer than the one of 170 msec which is apparent in
Fig. XVIII-6.
Results of tracking a continuously moving spot (motion of the same type as was used for Fig. XVIII-7) on the oscilloscope screen, the head remaining fixed, are shown in
Fig. XVIII-13. The crosscorrelograms for eye position with spot position indicate that
SPOT POSITION EYE PCSITION AUTOCORRELOGRAMS SPOT POSITION 0 2 4 6 0246 -I EYE POSITION
CROSS-CORRELOGRAM OF EYE POSITION WITH SPOT POSITION
Fig. XVIII-14.
Vertical tracking of a sinusoidally moving spot;
head fixed. (Subject: W.T.)(XVIII. COMMUNICATIONS BIOPHYSICS)
the eye position lags the spot position by approximately 80 msec.
In Fig. XVIII-14 are shown corresponding results of visual tracking of a vertical sinusoidally moving spot, the frequency of the motion being 0.2 per second. The cross-correlogram shows that the position of the eye movement is essentially in phase with that of the spot, possibly anticipating the latter very slightly.
In Fig. XVIII-15 are shown results of a recording made while the subject's head was being moved at the same time that he was fixating on the spot on the oscilloscope, itself immobile, the oscilloscope being approximately 25 cm from the subject's eyes.
The eye position is seen to be a very faithful replica of the head position; the tracking in this recording is obviously much better than that in Fig. XVIII-14, even though the signal was of a much slower and simpler nature in the latter. From the crosscorrelo-grams it is evident that the position of the eye lagged that of the vertical position of the head by approximately 70 msec.
5sec. EYEPO ON
POSITION
HEAD
Y
+V
POSITION AUTOCORRELOGRAMS 0 1 2 3 4 5 EYE POSITION 0 1 2 3 45 HEAD POSITIONCROSS-CORRELOGRAMS OF EYE POSITION WITH HEAD POSITION
Fig. XVIII-15.
Tracking of a fixed spot; passive vertical rotation
of head. (Subject: W.T.)SPOT POSITION ) HEAD POSITION J
NJ
N NiN
EYE POSITION NJ AUTOCORRELOGRAMS SPOT POSITION 0 2 4 6 rA 'Ai
i
11
", ,
i i\
\
ii
, N 1(f f ' I I I \/ NjjV N~iv NJ~ \! NJ Ai !. ' )/ ; HEAD POSITION 8 0 2 4 6 81kr
71
Ni
AP.
:/ A N I f \ N i N i : / io N/t(7
,,
\ X,,
Jv
/
EYE POSITION 0 2 4 6 8 CROSS-CORRELOGRAMSEYE POSITION WITH SPOT POSITION
-4 -2 0 2 4
EYE POSITION WITH HEAD POSITION
-4 -2 0 2
Fig. XVIII-16.
Vertical tracking of
movement of head.
HEAD POSITION WITH SPOT POSITION
-4 -2 0 2 4
.08 sec
-4 -2 0 2 .4
a sinusoidally moving spot; passive
(Subject: W.T.)
i/
N
\ /// \\
jj
(XVIII. COMMUNICATIONS BIOPHYSICS)
HEAD
I/'
I
POSITIONEYE
POSITIONE RM AUTOCORRELOGRAMS 0 2 4 6 HEADPOSITION POSITIONEYE
CROSS-CORRELOGRAMS OF EYE POSITION WITH HEAD POSITION 13 sc.
-4 -2 0 2 4 -4 2 0
4
Fig. XVIII-17.
Tracking of a fixed spot; active vertical rotation
of head.
(Subject: W.T.)
In Fig. XVIII-16 are shown results of a recording for which the subject's head was
being moved passively at the same time that he was attempting to track visually the
sinusoidally moving spot on the oscilloscope. The average frequency of movement of
the head was approximately 0.5 per second. The autocorrelogram of eye movement
represents the sum of the autocorrelograms of the spot position and of head position.
In the crosscorrelogram of eye position with spot position, it is apparent that the eye
position is essentially in phase with the spot position, whereas from the
crosscorrelo-gram of head position with eye position, the eye position lags the head position by
approximately 80 msec. Spot position and head position were, of course, uncorrelated,
and this fact is reflected by an essentially flat crosscorrelogram of these two, as shown
in the figure.
In Fig. XVIII-17 are shown results of a recording for which the subject moved his
own head while fixating on an immobile spot. The average frequency of head movement
is 0.45 per second. The crosscorrelograms reveal that eye position lagged head posi-tion by approximately 130 msec. It is puzzling that the tracking in this figure is poorer, and the latency greater, than for passive movement of the head which is shown in Fig. XVIII-15.
In Fig. XVIII-18 are shown results of horizontal tracking of a sinusoidally moving spot on the oscilloscope, the head of the subject remaining fixed, for comparison with the vertical tracking shown in Fig. XVIII-12. It is interesting, from the correlogram of this figure, that the position of the eye tended to lead that of the spot by approxi-mately 250 msec, a fact that indicates an anticipatory movement of the eyes in this horizontal tracking problem. The quality of the horizontal tracking is obviously superior to that of the vertical tracking shown in Fig. XVIII-12.
From a comparison of the results of analyses of the recordings from the patient with absent vestibular function with those for the normal subject, it is apparent that
5 sec. SPOT POSITION
EYE
tt
(
1 POSITION AUTOCORRELOGRAMS 0 2 4 6 0 2 4 6SPOT
EYE
POSITION POSITIONCROSS-CORRELOGRAM OF EYE POSITION WITH SPOT POSITION -. 25 sec.
-6 -4 -2 0 2 4 6
Fig. XVIII-18. Horizontal tracking of sinusoidally moving spot; head fixed. (Subject: W.T.)
(XVIII. COMMUNICATIONS BIOPHYSICS)
there is still remarkably good compensatory motion of eyes accompanying either active or passive motion of head; this result suggests that the vestibular apparatus does not play an essential role in the control of compensatory eye movements when the head is moved, if the body itself remains stationary, at least for relatively low frequencies of movements of the head. Because of the nature of the experimental arrangement, similar quantitative studies could not be carried out to determine results for sudden head move-ments, either active or passive.
The fact that compensatory eye movements, in response to movements of the head, were well carried out by the patient was substantiated by qualitative experiments in which the patient was asked to read a newspaper at the same time that his head was being pas-sively moved through excursions similar to or greater than those shown in Figs. XVIII-15 and XVIII-16. During passive movements of the head, of this type, the patient had no difficulty in reading, but there was difficulty if sudden movements of the head were induced, either passively or actively.
It would be of interest to carry out these experiments while the entire body were moved up and down, for example on an electrically operated barber's or dentist's chair, or if the body were rotated about a horizontal axis passing through the eyes or neck. Such an arrangement would permit the neck to remain stationary with respect to the body, thus eliminating the role of neck proprioceptive mechanisms from oculomotor tracking. The necessary experimental arrangement would, of course, be considerably more complicated than the one used in the present experiments.
In conclusion, the present results strongly suggest that proprioceptive information derived from the muscles and joints of the neck have a considerable importance in visual tracking carried out while the head is moved with respect to the body, if the latter remains stationary.
The invaluable assistance of Mrs. Margaret Hargraves in recording and processing of these data is gratefully acknowledged.
This work was supported at the Massachusetts General Hospital by grants from the U.S. Public Health Service (B-43-62 and BF-19-62), and in part by a grant from the Charles E. Merrill Trust to the Neurology Service.
J. S. Barlow References
1. F. R. Ford and F. B. Walsh, Clinical observations upon the importance of the vestibular reflexes in ocular movements, Bull. Johns Hopkins Hosp. 58, 80-88 (1936).
2. D. Whitteridge, Central control of eye movements, Handbook of Physiology, edited by J. Field (American Physiological Society, Washington, D.C., 1960), Section I (Neurophysiology), Vol. 2, Chapter 42, pp. 1089-1109.
3. D. G. Cogan, Some objective and subjective observations on the vestibulo-ocular system, Am. J. Ophthalmol., Vol. 45, No. 4, Part II, pp. 74-78, 1958.
4. J. Crawford, Living without a balancing mechanism, New England Journal of Medicine 246, 458-460 (1952).
5. W. Wrigley and J. Hovorka, Encyclopedia of Fire Control, Vol. 1, Fire Control Principles, Instrumentation Laboratory, M.I.T., 1957.
6. R. B. Horsfall, Stellar inertially navigation, Trans. IRE Vol. ANE-5, pp. 106 -114, 1958.
7. L. A. Cohen, Role of eye and neck proprioceptive mechanisms in body orien-tation and motor coordination, J. Neurophysiol. 24, 1-11 (1961).
8. O. H. Mowrer, T. C. Ruch, and N. E. Miller, The corneo-retinal potential difference as the basis of the galvanometric method of recording eye movements, Am. J. Physiol. 114, 423-428 (1936).
9. C. Kris, Vision: Electro-oculography, Medical Physics, Vol. 3, pp. 692-700, 1960.
10. L. Stark and A. Sandberg, A simple instrument for measuring eye movements, Quarterly Progress Report No. 62, Research Laboratory of Electronics, M.I.T., July 15, 1961, pp. 268-270.
11. D. Trincker, J. Sieber, and J. Bartual, Schwingunganalyse der vestibular, optokinetisch und durch elektrische Reizung ausgelosten Augenbewegungen beim
Men-schen, Kybernetik 1, 21-28 (1961).
12. D. H. Fender and P. W. Nye, An investigation of the mechanism of eye move-ment control, Kybernetik 1, 81-88 (1961).
13. L. Stark, G. Vossius, and L. R. Young, Predictive control of eye movements, Quarterly Progress Report No. 62, Research Laboratory of Electronics, M.I.T., July 15, 1961, pp. 271-282.
14. J. S. Barlow, Rhythmic activity induced by photic stimulation in relation to intrinsic alpha activity of the brain in man, EEG Clin. Neurophysiol. 12, 317-326 (1960).
15. J. S. Barlow, A versatile analog computer for neurophysiological research, Quarterly Progress Report No. 61, Research Laboratory of Electronics, M.I.T., April 15, 1961, pp. 184-186.
16. J. S. Barlow, A versatile analog computer for neurophysiological research, Digest of the 1961 International Conference of Medical Electronics, New York,
July 21-28, 1961, p. 27.
D. SIMULATION OF NORMAL AND ABNORMAL ELECTROENCEPHALOGRAMS In Quarterly Progress Report No. 54 (pp. 173-180), it was pointed out that in cross-correlograms for EEG from homologous locations on the two hemispheres of patients
with unilateral cerebral disease and a concomitant unilateral slow-wave abnormality, there may be an asymmetry about the point T = 0, whereas crosscorrelograms for nor-mal subjects appeared to be invariably symmetrical in this respect. In Quarterly Prog-ress Report No. 61 (pp. 166-172), crosscorrelograms for pharmacologically induced unilateral EEG abnormality were shown which did not show such an asymmetry. Illus-trative examples are reproduced in Figs. XVIII-19, XVIII-20, and XVIII-21. In an attempt to gain further understanding of the nature and significance of abnormal, as well as normal, EEG activity, mock-up experiments were carried out, and the results of
(XVIII. COMMUNICATIONS BIOPHYSICS) 10. 0 cps. -__-t7F7-( 4_ L-'.ZL 1 44 10. 0 cps. tt-I--
-LEFT AUTOCORRELOGRAMS RIGI
10. 0 cps. 7r-=0
HT
CROSSCORRELOGRAM
41
Second-0-Fig. XVIII-19.
Autocorrelograms and crosscorrelograms for a 1-minute
simultaneous left parieto-occipital recording from a normal human subject.some preliminary attempts to simulate normal and abnormal EEG and symmetrical and asymmetrical crosscorrelograms are reported here.
In the choice of the signals for the mock-up experiments, three factors were con-sidered. First, from inspection of Fig. XVIII-20, it is apparent that the crosscorrelo-gram obtained when the EEG from the right side is advanced in time (in the computational procedure) with respect to that on the left is different from that obtained when the EEG from the right side is delayed in time with respect to that on the left (left and right halves, respectively, of the crosscorrelogram). This difference indicates that the EEG for the two sides were not symmetrical about any arbitrary point in time, a comparison that is shown schematically in Fig. XVIII-22. Second, it was apparent that the basic signals to be used in the simulation experiments should be of a random, rather than a periodic, nature, since the autocorrelograms for resting EEG, both for normal subjects and for patients with brain disease, are clearly not of a truly periodic nature. Third, it appears likely that those influences that tend to synchronize EEG activity recorded at homologous locations on the scalpl act, at least in part, by means of propagated nerve impulses, rather than by means of graded-response phenomena. 2
With these considerations in mind, we employed trains of randomly recurring pulses from which "slow-wave" activity of normal and abnormal types were then derived. In Fig. XVIII-23 the transformations that were employed to obtain the derived slow waves are illustrated. For this purpose, a tuned circuit and a lowpass filter were employed;
the unit impulse responses of these are indicated in the figure.
The randomly recurring
pulses shown in the upper right of Fig. XVIII-23 were obtained by means of Tektronix
Corporation Type 161 and Type 162 pulse and waveform generator, triggered by means
of a source of wideband random noise. The outputs of the tuned circuit and of the
low-pass filter for an input of randomly recurring pulses are shown in the second and third
traces on the right in Fig. XVIII-23.
Some similarity between the output of the tuned
circuit and that of the EEG reproduced in Fig. XVIII-19 is evident; likewise, some
simi-larity is evident between the output of the lowpass filter and the slow-wave activity that
is apparent in Fig. XVIII-20 in the EEG recorded from the right side.
Since the EEG from homologously located electrodes, even in normal subjects, is
not absolutely the same (Fig. XVIII-19), the arrangement depicted in Fig. XVIII-24 was
employed for the purpose of making recordings for correlation analysis.
With respect
LEFT
AUTOCORRELOGRAMS
RIGHTCROSSCORRELOGRAM
Fig. XVIII-20.
Autocorrelograms and crosscorrelograms for 1-minute
recording from patient with a tumor of the right cerebral
hemisphere.
(XVIII. COMMUNICATIONS BIOPHYSICS)
LEFT
RIGHT
AUTOCORRE LOG
RAMS
CROSSCORRELOGRAM
I
SEC-Fig. XVIII-21.
Correlograms following right intracarotid injection of 200 mg
of sodium amytal; analysis of 1-minute recording.
to an analogy with the electrical activity of the brain, it could be supposed that
random pulse generator No. 2 in Fig. XVIII-24 is an analog of a source of
neu-ronal impulses arriving at the cortex bilaterally from deep structures (e.g.,
ascending reticular formation propagated through the nonspecific thalamic system),
whereas the output of random pulse generators No. 1 and No. 3 could be imagined
to have their analogs in locally generated electrical activity at the cortex on the
left and right sides, respectively, or in activity propagated from paired
sub-cortical nuclei.
Simulated normal EEG and correlograms are shown in Fig. XVIII-25; the symmetry
of the crosscorrelogram about the point
T
=
0 is evident.
A simulated unilaterally
abnormal EEG, with corresponding correlograms, is depicted in Fig. XVIII-26.
Although the resulting correlogram is hardly similar to the one shown in Fig. XVIII-20,
its asymmetrical nature is, nonetheless, clearly apparent. An intuitive grasp of the
underlying basis for this asymmetry can be gained from inspection of the three traces
of Fig. XVIII-23. A comparison of the time course of the unit impulse responses of the
tuned circuit with that of the lowpass filter indicates that, if the unit impulse response
RIGHT
Fig. XVIII-22.
Diagram illustrating comparison of EEG from the
left and right sides, for different delays.
Fig. XVIII-23.
Fig. XVIII-24
I
1I
ALLW
I
Responses for a train
of random pulses
Simulation of normal and abnormal EEG.
The average interval
between successive pulses is approximately 3 msec.
The
fre-quency of the tuned passive filter was 250 cps, and the cutoff
frequency of the lowpass filter was 150 cps.
)OM PULSE 4ERATOR 1 RANDOM
MIXING
b PULSE
SCIRCUIT OUTPUT A )OM PULSE IERATOR 2MI
RANDOM
MIXING PULSE CIRCUIT OUTPUT B )OM PULSE IERATOR 3Block diagram of arrangement for generation of 2 random
pulse trains having a common component.
-I_
~vvv"
\Pv~WAAM
Fig. XVIII-25.
Correlograms for simulated
right occipital EEG.
normal left and
T=0
fvA-Api
xnl/lS~vs'r
Fig. XVIII-26.
Correlograms for simulated normal left and
abnormal right occipital EEG.
Ai. ItL-f
--i if w v v A TO V fr Iof the lowpass filter is shifted to the left with respect to that of the tuned circuit, all correlation between the two would be rapidly lost as the displacement of the former to the left is successively increased. On the other hand, if the unit impulse response of the lowpass filter is shifted to the right with respect to that of the tuned circuit, the two
will remain correlated to some degree (albeit to a decreasing extent) for a considerably greater time than would be the case for the shift to the left. It is just this asymmetry in correlation, with respect to positive and negative shifts in time, that is reflected in the crosscorrelogram shown in Fig. XVIII-26.
It should be emphasized that only one type of asymmetry was simulated in Fig. XVIII-26; neither the exact form of the asymmetry, nor the form of the cross-correlogram itself, illustrated in Fig. XVIII-20, is reproduced. Subsequent simulation experiments could include variation of types of unit impulse responses (Fig. XVIII-23) to simulate more closely the form of the asymmetrical correlogram in Fig. XVIII-20.
It is of interest in relation to the present results that the crosscorrelograms for pharmacologically induced unilateral slow-wave activity (Fig. XVIII-21) was of a sym-metrical nature; this result could suggest that the pharmacologically induced slow-wave activity is more closely related to (or alternatively, is derived from) intrinsic activity of one cerebral hemisphere (e.g., if having as its analog the output of random pulse generator No. I or No. 3, in Fig. XVIII-24), whereas slow-wave activity appearing in the instance of structural pathology of the cerebral hemisphere may be more closely related to (or derived from) neuronal activity arriving at the cerebral hemispheres from midline structures, as discussed above. This suggestion is derived from the fact that random signals (in the present context, random slow waves in the EEG) do not correlate unless they are derived at least in part from a common source.3
Since the origin of the normal, as well as the abnormal, EEG is still a matter of considerable discussion, it is not possible to specify the exact nature of the physiological analogies of the simulation experiments described, but the relationship of cortical
slow-wave activity and of the EEG to postsynaptic potentials that are derived in turn from
4
nerve action potentials, as well as after-potentials of the latter, obviously suggests itself as a possibility. It would be of interest to speculate about whether or not the time course of postsynaptic potentials might be increased under some circumstances if there is structural pathology of the cerebral cortex.
J. S. Barlow References
1. J. S. Barlow and Margaret Z. Freeman, Comparison of EEG activity recorded from homologous locations on the scalp by means of autocorrelation and crosscorrela-tion analysis, Quarterly Progress Report No. 54, Research Laboratory of Electronics,
M.I.T., July 15, 1959, pp. 173-180.
2. A Symposium on Dendrites, American Society of Electroencephalographers, Supplement No. 10, EEG Clin. Neurophysiol., November 1958.
(XVIII. COMMUNICATIONS BIOPHYSICS)
3. J. S. Barlow, Autocorrelation and crosscorrelation analysis in electroencepha-lography, Trans. IRE, Vol. ME-6, pp. 179-183, 1959.
4. A. Fessard, Brain potentials and rhythms - Introduction, Handbook of Physiology, edited by J. Field (American Physiological Society, Washington, D.C., 1960), Section I (Neurophysiology) Vol. 1, Chapter 9, pp. 255-259.
E. TRANSISTORIZED CARDIAC TACHOMETER
This instrument is a portable, self-contained, heart-rate indicator. It is designed to operate with the following scales: 0-100, 0-200, and 0-400 beats per minute.
A block diagram of the instrument is shown in Fig. XVIII-27. Electrodes pick up the heart potential, which is amplified by a differential amplifier.l The advantage of the differential amplifier is that the potential between the electrodes (cardiac potential) can be greatly amplified while the common mode interference is attenuated. This allows the instrument to be used outside a shielded room. The output of the differential ampli-fier triggers a monostable multivibrator. The multivibrator is biased so that only the QRS complex of the electrocardiagram will trigger it.
The rectangular pulses from the multivibrator are led to a lowpass RC filter that has a 10-sec time constant. The output of the filter is proportional to the heart rate and has a small ripple at the frequency of the heart rate. The filter is followed by a difference amplifier that amplifies the output of the filter and also provides an electronic zero setting for the meter. The difference amplifier drives a microammeter that pro-vides the read-out of the device. A circuit diagram of the tachometer is shown in Fig. XVIII-28.
When the instrument is in operation the ripple from the filter causes a pulsation of the meter pointer. When the heart rate is 70 beats per minute (a typical human pulse), the pulsation has a swing of ± 2 beats per minute about this value. This pulsation has proved to be a valuable indication when the user is adjusting the amplifier gain to give reliable triggering of the multivibrator. The pulsations do, however, limit the accuracy of the device to ± 3 per cent.
A switch (CT sig) and an input terminal (CT in) are provided for calibrating the instrument with a known pulse train. The unit may also be used as a low-noise differen-tial amplifier for EKG potendifferen-tials by connecting an oscilloscope or a pen recorder to the
DIFFERENTIAL MONOSTABLE DIFFERENCE
AMPLIFIER MULTIVIBRATOR INTEGRATOR AMPLIFIER TO METER
-1.5 -12 -12 15K 15K 470K 220K 220K 220 K CK22B 2N220 2N220 2N220 10. f 6
pf
50 .f 50 Lf -+ + - + - +IM 47K lOOK lOOK 220 IOOK
ST 50 BAL. IM 47K
lOOK
2K IOOK 220 2K 220'< 6.fS:
61*f 10pLf
470 K 15K 15 K 6.2 K 220K 50L f AMPLIFIER OUT 2.4 K 220 IOK 220K 15 K -1.5 RANGE C O- 100 bpm 20j.f O -200 bpm IO f 0 -400 bpm 5pf
Fig. XVIII-28. Circuit diagram of cardiac tachometer.
I MEG.
FILTER
2NI305
(XVIII. COMMUNICATIONS BIOPHYSICS)
output of the differential amplifier.
Thus far, the tachometer has been used successfully to measure human heart rate by means of electrodes taped to the skin and also to monitor heart rate of anesthetized animals by means of subdermal electrodes.
F. T. Hambrecht
References
1. R. T. Kado and W. R. Adey, A transistorized preamplifier for field study of EEG, Digest of the 1961 International Conference on Medical Electronics, New York City, July 1961, edited by Peter L. Frommer (The Conference Committee for the 1961 International Conference on Medical Electronics, Leslie E. Flory, Chairman, RCA Laboratories, Princeton, N.J., 1961) p. 172.