HAL Id: hal-03127114
https://hal.archives-ouvertes.fr/hal-03127114
Submitted on 2 Feb 2021
HAL is a multi-disciplinary open access
archive for the deposit and dissemination of
sci-entific research documents, whether they are
pub-lished or not. The documents may come from
teaching and research institutions in France or
abroad, or from public or private research centers.
L’archive ouverte pluridisciplinaire HAL, est
destinée au dépôt et à la diffusion de documents
scientifiques de niveau recherche, publiés ou non,
émanant des établissements d’enseignement et de
recherche français ou étrangers, des laboratoires
publics ou privés.
Chemical, physical, and optical characterization of
aerosols during PAUR II experiment
G. Kouvarakis, Y. Doukelis, N. Mihalopoulos, S. Rapsomanikis, J. Sciare, M.
Blumthaler
To cite this version:
G. Kouvarakis, Y. Doukelis, N. Mihalopoulos, S. Rapsomanikis, J. Sciare, et al.. Chemical, physical,
and optical characterization of aerosols during PAUR II experiment. Journal of Geophysical Research,
American Geophysical Union, 2002, 107 (D18), �10.1029/2000JD000291�. �hal-03127114�
Chemical, physical, and optical characterization
of aerosols during PAUR II experiment
G. Kouvarakis,
1Y. Doukelis,
2N. Mihalopoulos,
1S. Rapsomanikis,
2J. Sciare,
3and
M. Blumthaler
4Received 27 December 2000; revised 20 March 2001; accepted 16 April 2001; published 28 September 2002.
[
1] During a 1-month campaign conducted in May 1999 in the frame of Photochemical
Activity and Solar Ultraviolet Radiation (PAUR II) project, determination of the ionic
composition and physical and optical properties of the aerosol have been performed at a
coastal site in Crete. Non-sea-salt sulfate (nss-SO
42⫺), nitrate (NO
3⫺) non-sea-salt calcium
(nss-Ca
2⫹), and ammonium (NH
4⫹
) have been identified as the main non-sea-salt ionic
components of the aerosol. Air mass origin was found to be an important factor
controlling the variation of the above ions as well as their particle size distribution. During
the experiment, aerosol scattering coefficient ranges from 2 to 51 (M m
⫺1) with no
significant difference between dusty and nondusty periods. Significant correlations have
been observed between (NH
4)
2SO
4mass measured during the campaign, aerosol
scattering coefficient, and aerosol single-scattering albedo indicating the key role of
(NH
4)
2SO
4in determining the radiative forcing of the eastern Mediterranean area.
Finally, non-sea-salt calcium was found to better reproduce the variation of optical depth,
more than any other ionic species.
INDEXTERMS: 0305 Atmospheric Composition and Structure:Aerosols and particles (0345, 4801); 0345 Atmospheric Composition and Structure: Pollution—urban and regional (0305); 0365 Atmospheric Composition and Structure: Troposphere—composition and chemistry; 0368 Atmospheric Composition and Structure: Troposphere—constituent transport and chemistry;
KEYWORDS: aerosol composition; regional pollution; dust episode; mass scattering coefficient; optical depth;
radiative forcing
Citabion:Kouvarakis, G., Y. Doukelis, N. Mihalopoulos, S. Rapsomanikis, J. Sciare, and M. Blumthaler, Chemical, physical, and optical characterization of aerosols during PAUR II experiment, J Geophys Res., 107(D18), 8141, doi:10.1029/2000JD000291, 2002.
1. Introduction
[2] The potential role of tropospheric aerosol in regulating climate through backscattering and absorption of solar radia-tion and formaradia-tion of cloud condensaradia-tion nuclei (CCN) has been established during the last years [Intergovernmental Panel
on Climate Change (IPCC), 1996]. Aerosol scatters and/or
ab-sorbs short wavelength (UV-visible) light, hence influencing directly the radiative balance of the Earth [Charlson et al., 1991] possibly, with a sign (radiative cooling) opposite to that of greenhouse gases [IPCC, 1996]. Model calculations by
Charlson et al. [1991] assuming that the aerosol is mainly
com-posed by (NH4)2SO4show that the eastern Mediterranean is
one of the areas, worldwide, which could be very strongly influenced by the negative radiative forcing induced by the aerosols.
[3] This is due to the fact that the eastern Mediterranean can be affected by two and sometimes three strong, but very different in composition, aerosol sources: Sahara desert,
indus-trialized area of N/NW Europe, and sea spray [Dayan et al., 1991; Mihalopoulos et al., 1997; Moulin et al., 1997a, 1997b]. However, for the eastern Mediterranean area only few studies have been performed in the background atmosphere focusing either on the ionic composition of aerosols [Mihalopoulos et al., 1997], on fine organic aerosols [Gogou et al., 1994] and or on transport of Saharan dust [Ganor and Mamane, 1982]. Up to now, very few experiments have tried to relate the chemical composition of aerosol with its optical properties [Kavouras et
al., 1996; Ichoku et al., 1999]. Ichoku et al. [1999] reported
interrelationships between aerosol characteristics and light scattering during late winter in an eastern Mediterranean arid environment. These authors showed that during strong dust events, almost all of the solar radiation reaching the area is scattered or absorbed.
[4] The data presented here have been collected at a
coastal rural site on the island of Crete in the eastern Medi-terranean area exposed to the N/NW winds, during the PAUR II experiment in May 1999. The month of May was choosen because during that period air masses originating from all potential aerosol sources (desert, sea, and industrialized areas of N/NW Europe) are reaching the island [Mihalopoulos et al., 1997]. Since the highest atmospheric mass loadings are due to mineral dust, sea-salt and nss-sulfate, the choice of the site, was ideal for the study of the effects of the aerosol scattering on the light attenuation at the Earth’s surface. More details about PAUR II experiment are given by Zerefos [2002]. To our knowledge, the work presented here is the first attempt to
1Environmental Chemical Processes Laboratory, Department of
Chemistry, University of Crete, Heraklion, Greece.
2Laboratory of Air Pollution, Department of Environmental
Engi-neering, Demokritos University of Thrace, Xanthi, Greece.
3LSCE, Orme des Merisiers, Gif-sur-Yvette, France.
4Institute of Medical Physics, University of Innsbruck, Innsbruck,
Austria.
Copyright 2002 by the American Geophysical Union. 0148-0227/02/2000JD000291$09.00
JOURNAL OF GEOPHYSICAL RESEARCH, VOL. 107, NO. D18, 8141, doi:10.1029/2000JD000291, 2002
relate the ionic composition of aerosols in the background atmosphere of the southern part of the eastern Mediterranean region, with their physical and optical characteristics.
2. Experiment
2.1. Sites[5] During the PAUR II experiment, aerosols have been
collected at two places in the western Crete (Nopigia and Prasses, Figure 1). Prasses is a small village located at 1030 m of altitude and Nopigia is a coastal site. The results regarding the ionic composition from this experiment have been com-pared with those collected on a routine basis at Finokalia (25⬚60⬘E, 35⬚24⬘N) in the northern coast of Crete (Figure 1). Details about Finokalia can be found elsewhere [Mihalopoulos
et al., 1997; Kouvarakis et al., 2000].
2.2. Sampling and Analysis of Filters
[6] At Nopigia and Prasses, size-segregated aerosols were
collected on Whatman-41 filter paper using a commercially available Sierra Anderesen six-stage impactor (Sierra-Andersen, Model 230 impactor; hereafter mentioned as “Hi-Vol”). The sample frequency was three samples/day at Nopigia (two during daytime and one during nighttime) and daily at Prasses. The impactor operated at a flow rate of 80 m3h⫺1and
separated the particles into the following aerodynamic equiv-alent diameter (Dp) ranges: stage 1: ⬎ 6.44 m, stage 2: 2.68–6.44m, stage 3: 1.34–2.68 m, stage 4: 0.85–1.34 m, stage 5: 0.44–0.85 m. Particles with diameters smaller than 0.44m were collected on a backup Whatman-41 filter. Filters were prewashed in the laboratory with 0.1 M HCl, rinsed four to five times with Milli-Q water and dried in a clean-air hood. After drying, filters were sealed individually in aluminum foil and polyethylene bags, which were opened just before use. At least 5% of the washed filters (per batch) were used as labo-ratory blanks, and 5% were used as field blanks. After sam-pling, filters were also covered by aluminum foil, sealed in polyethylene bags, and stored in a refrigerator at 4⬚C until ion chromatographic analysis. A part of the total filter (1/2 for the
stages 1–5, 1/24 for the final Whatman-41 filter) was extracted by sonication during 45 min in 20 mL of ultrapure water. The extraction efficiency of this method is higher than 98% for all compounds of interest; 50–100l chloroform were added as a biocide in the sample extracts, and all extracts were analyzed within a week.
[7] A Dionex AS4A-SC column with ASRS-I suppressor in
autosuppression mode of operation was used for the analysis of anions (chloride: Cl⫺; bromide: Br⫺; nitrate: NO
3⫺, sulfate:
SO42⫺, oxalate C2O42⫺ and methanesulfonate: MSA
(CH3SO3⫺)). For the cations (sodium: Na⫹, ammonium:
NH4⫹, potassium: K⫹, magnesium: Mg2⫹and calcium: Ca2⫹)
a CS2 column was used with a CSRS-I suppressor. The repro-ducibility of the measurements was better than 2%, and the detection limits corresponded to 2 pmol m⫺3of air for a mean
volume of 1500 m3. Blanks for CH
3SO3⫺, Cl⫺, NO3⫺, SO42⫺,
Na⫹, NH
4⫹, K⫹, Mg2⫹, Ca2⫹were⬍0.006, 10, 1.5, 1.1, 1.5,
7.6, 0.2, 0.1, and 0.5g, respectively. The above masses corre-spond to less than 2% of the minimum mass of the correcorre-spond- correspond-ing ion measured on the analyzed filters.
[8] At Finokalia, aerosols have been collected on Teflon
filters with a sampling step of 48h and a flow rate of 20 L/min. Extraction and analysis was similar to that presented above for the Whatman-41 filters. The reproducibility of these measure-ments was better than 2%, and the detection limits for all ions corresponded to 0.04 nmol/m3.
2.3. Additional Measurements
[9] Aerosol scattering was measured at (Nopigia) at 532
nm using an integrating nephelometer (Radiance Research, Seattle, Washington, United States), at 7⬚–170⬚ for total scat-tering (sigma sp;sp) and 90⬚–170⬚ for hemispheric
backscat-tering (sigma bsp;bsp).
[10] Equivalent Black Carbon (BC) mass concentrations
were measured both at Nopigia and Prasses using a Particle Soot Absorption Photometer (PSAP; Radiance Research, Se-attle, Washington, United States) and Magee aethalometer, respectively. Absorption of aerosol (sigma ap; ap) was
esti-mated using the relation proposed by Hansen et al. [1984] and
optical absorption cross-sections of 10 (for PSAP) and 19 (for Magee) respectively following the recommendation of the manufactures. The inlets of the nephelometer, Particle Soot Absorption Photometer and Magee aethalometer were not heated and hence the values observed are reported for ambient relative humidity.
[11] From the above measured parameters the aerosol light
extinction coefficient (e ⫽ sp⫹ ap) the single scattering
albedo (omega; ⫽ sp/[sp ⫹ sp]) and the hemispheric
backscatter fraction (b⫽ bsp/sp) can be calculated and
re-lated to direct forcing of the aerosols. However, due to soft-ware problems, no measurements of sigma bsp were available, thus chemical composition of the aerosol will be related to sigma sp, sigma ap, and omega at 532 nm.
[12] Number and corresponding size distribution of aerosol
particles were obtained at Nopigia by using a Diffusional Par-ticle Sizer (DPS) System from TSI Company, which includes a Model 3040 Diffusion Battery and a Model 3022A Condensa-tion Particle Counter (CPC). This system classifies and mea-sures aerosol particles according to their size in the diameter range of 7 to 200 nm.
[13] Aerosol optical depth measurements at 532 nm have
been performed also at Nopigia by the Institute for Medical Physics, University of Innsbruck, using a spectroradiometer equipped with a double monochromator (Bentham DTM300, United Kingdom) with a bandwidth of 0.43 nm (full width at half maximum). Each scan covers the wavelength range from 290 nm to 600 nm with steps of 0.25 nm, every 5 min. The
spectroradiometer is calibrated against a 1000 W halogen lamp, traceable to Physikalisch-Technische Bundesanstalt, Germany. The overall uncertainty of the calibration is esti-mated to be about ⫾5%. More details about the Bentham spectroradiometer and how its measurements compared to those performed by a Lidar and a ground-based sunphotom-eter is reported elsewhere (G. Gobi et al., unpublished manu-script, 2001).
[14] Back trajectory calculations were made using the
Hy-brid Single-Particle Langrangian Integrated Trajectory (HYSPLIT_4) modeling system. This public domain model (http://www.arl.noaa.gov/ready/hysplit4.html) is documented in the international literature [Draxler and Hess, 1998]. The meteorological data used in the calculations were obtained from the National Weather Service’s of the National Center for Environmental Prediction (NCEP) of the United States. For the sampling periods, meteorological data both at Nopigia and Finokalia have been obtained using automatic meteoro-logical stations installed close to the sampling devices.
3. Results and Discussion
3.1. Chemical Composition3.1.1. Variation of the Main Ionic Species
[15] Figure 2 presents the variation of the main ionic
non-sea-salt components, i.e., nss-SO42⫺, NO3⫺, CH3SO3⫺, NH4⫹,
nss-Ca2⫹, and Mg2⫹ during the whole experiment both at Figure 2. Variation of nss-SO42⫺, NO3⫺, CH3SO3⫺, NH4⫹, nss-Ca2⫹, and Mg2⫹in neq/m3 at the three
locations during the sampling period.
Nopigia and Prasses. For comparison, the data from Finokalia are also shown here. Table 1 presents the mean variation of all the ionic species measured during the period. A closer exam-ination of the data leads to the following conclusions:
[16] Nss-SO42⫺ is calculated using Mg2⫹ as a seawater
tracer. Note that using Na⫹very similar results (within 10%)
are obtained. A very good agreement exists for all the sampling stations, indicating that the main factor controlling the nss-SO42⫺distribution in the eastern Mediterranean is long-range
transport rather than local sources in agreement with the con-clusions presented by Mihalopoulos et al. [1997]. It is worth-while noting the existence of a very slight gradient between the Prasses (1030 m) and sea level site (Nopigia) indicating an almost homogeneous distribution within the boundary layer. Nss-SO42⫺ concentrations during Paur II were about 40%
lower to that reported for Finokalia during spring 1994. Al-though important interannual variation in nss-SO42⫺can
par-tially account for this difference [Kouvarakis et al., 2002], the data collected during spring 1994 were exclusively originating from N/NW sectors, which was not the case for the PAUR II samples (see discussion below).
[17] For nss-Ca2⫹ a very good agreement exists between
Nopigia and Finokalia both stations situated at sea level. The nss-Ca2⫹values at Prasses are a factor of 2 higher than at sea
level (Table 1). Prasses is located at 1030 m of altitude and thus can be more affected by the dust layer situated between 2 and 3 km above the ground (see further discussion on air mass origin). The nss-Ca2⫹levels observed at Nopigia and Finokalia
are in very good agreement with the values reported for Fino-kalia during spring 1994 [Mihalopoulos et al., 1997].
[18] For NO3⫺ and NH4⫹a very good agreement exists
between the values observed at Nopigia and Prasses. However, the observations at Finokalia during May 1999 are a factor of 2 lower than at the other sites. As mentioned in the experi-mental part, different filter media has been used for the aero-sol sampling at Paur II sites and at Finokalia. It is well known that HNO3can be adsorbed on cellulose paper media
(espe-cially on the coarse mode) inducing a positive artifact. Taking into account that HNO3levels at Finokalia are comparable to
NO3⫺ [Kouvarakis et al., 2001], this fact could explain the
difference observed between the West and East Cretan sta-tions. However, the NO3⫺and NH4⫹values observed at
Fino-kalia are in good agreement with the values reported by
Mi-halopoulos et al. [1997] during spring 1994-1995. Taking into
account that these measurements were performed using
What-man-41 as sampling media, it indicates that the difference of factor of 2 observed in the NO3⫺and NH4⫹values between
the Finokalia and the PAUR II samples could be mainly due to local sources origin than purely to sampling artifacts.
[19] Finally, for MSA which is a product of the atmospheric
oxidation of the gaseous DMS (CH3SCH3) produced in
sea-water as a result of the interactions between phytoplankton, zooplankton, and bacteria [Belviso et al., 1990; Groene, 1995], no significant difference is observed between the data mea-sured at the two sea level sites indicating a quasi homogeneous distribution of DMS in the area around Crete, in agreement with the results of Bardouki [2000] and Kouvarakis and
Miha-lopoulos [2002]. Note also the existence of a gradient in the
MSA levels between Nopigia and Prasses in line with the short lifetime of DMS in the atmosphere over the studied area varying from few minutes during nighttime to few hours during daytime [Kouvarakis and Mihalopoulos, 2002].
3.1.2. Factors Controlling the Variation of the Main Ionic Species
[20] Detailed meteorological conditions during the
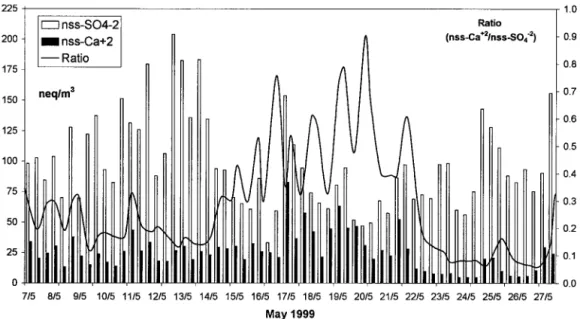
cam-paign are described by D. Melas et al. (unpublished manuscript 2001). Figure 3 presents 5-day back trajectories (at two alti-tudes; 1 and 3 km) for the main air masses origin observed during the campaign. From the beginning of the experiment and until May 15 the air masses originated from the NW sector, turning slowly to the west sector until May 17. From 18 May an intrusion of Saharan dust was clearly seen at 3 km of altitude, whereas at 1 km the winds were still of NW origin. This situation continued until 21 May when air masses were turning to the South sector in both altitudes, until 23 May when a situation similar to 18 May was observed. After that date and until the end of the campaign, the air masses turned from the west to the NW sectors (25 May) and finally to the north sector (27 May). This change in air mass origin and especially the period under the influence of dust is clearly seen in Figure 4 presenting the variation of nss-Ca2⫹and nss-SO
42⫺as well as
their ratio during the experiment. Indeed, the ratio during the nondusty period was always low ranging from 0.08–0.3. Then from 17 May it increases dramatically to reach values of the order of 0.9 on 21 May clearly associated with the transport from the southern sector as discussed before and presented in Figure 3.
[21] Using these 5-day back trajectories, the main ionic
species have been classified according to the major wind
sec-Table 1. Mean Concentrations of Cl⫺, Br⫺, NO
3⫺, nss-SO42⫺, C2O42⫺, CH3SO3⫺, Na⫹, NH4⫹, nss-K⫹, Mg2⫹, and
nss-Ca2⫹at the Three Locations During the Sampling Perioda
Nopigia (35.5⬚N–23.75⬚E)
n⫽62 Prasses (35.35⬚N–23.8⬚E)n⫽16 Finokalia (35.3⬚N–25.7⬚E)n⫽11
Cl⫺ 84.4⫾ 46.8 35.71⫾ 14.04 31.8⫾ 21.7 Br⫺ 0.099⫾ 0.073 0.029⫾ 0.021 0.107⫾ 049 NO3⫺ 43.6⫾ 15.6 35.1⫾ 11.7 18.7⫾ 6.9 nss-SO42⫺ 91.7⫾ 37.1 76.2⫾ 38.2 83.0⫾ 34.0 C2O42⫺ 4.28⫾ 1.20 2.86⫾ 1.15 2.81⫾ 1.05 CH3SO3⫺ 0.502⫾ 0.367 0.276⫾ 0.162 0.811⫾ 0.467 Na⫹ 64.0⫾ 44.1 23.0⫾ 16.2 45.1⫾ 32.3 NH4⫹ 85.1⫾ 37.1 84.7⫾ 32.9 36.1⫾ 40.9 nss-K⫹ 1.18⫾ 1.04 2.07⫾ 0.90 1.85⫾ 0.60 Mg2⫹ 13.3⫾ 9.7 7.5⫾ 5.5 14.4⫾ 13.0 nss-Ca2⫹ 24.0⫾ 15.1 55.0⫾ 34.2 23.5⫾ 15.3
tors defined by Mihalopoulos et al. [1997]. The results are depicted in Figure 5 and concern only the data obtained at Nopigia because this data set contains sufficient number of samples for accurate statistical analysis. Note, however, that similar trends have been found in Prasses data set. From the results depicted in Figure 5 it is clear that both nss-SO42⫺and
NH4⫹present the same behavior as a function of air masses
origin and their concentration are following the tendency S⬍W⬍N⬍NW in agreement with the conclusions of
Mihalo-poulos et al. [1997]. For nss-Ca2⫹the higher values are
asso-ciated with the South sector. The relatively high values
ob-served under the west and NW origin could be attributed to local influence (air masses are traveling over a part of land before reaching the station; see Figure 1). Finally, no clear tendency is observed for the NO3⫺ values, with the higher
values occurred under NW and South sectors influence. Ab-sorption of acidic gases like HNO3on basic particles like dust
as proposed by Dentener et al. [1996] could account for this tendency (see also the discussion below on size distribution).
[22] Apart from air masses origin, meteorological factors
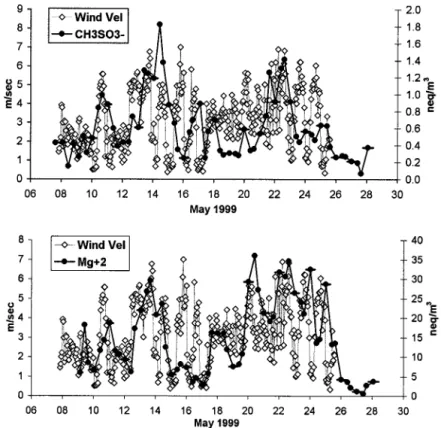
can also account for the variation in the concentration of species, especially for those originated from seawater. Figure 6
Figure 3. Trajectory analysis of the air masses arriving at Nopigia during the period May 13–25.
presents the variation of MSA and Mg2⫹as a function of
wind speed. In most cases these compounds follow the vari-ation of wind speed indicating local rather than long-range transport origin (oxidation of DMS for the MSA, sea spray for Mg2⫹).
3.1.3. Interspecies Correlation
[23] Figure 7 presents the sum of cations as a function of
the sum of anions and for the aerosol samples collected both at Nopigia and Prasses. For comparison the 1:1 line is also drawn. Despite the fact that we have experienced various air masses origins during the experiment a good agreement exists between the sum of the anions and the cations, indicating almost com-plete ionic chemical characterization of the aerosol.
[24] Figures 8a and 8b present two among the most
char-acteristic relationships observed during the experiment: (1) that of Na⫹and Mg2⫹(Figure 8a) and (2) that of NH
4⫹and
nss-SO42⫺ (Figure 8b). The first relation indicates that both
compounds mainly originate from seawater since the slope of their regression (0.21) is close to that reported for seawater (0.23). The second relationship indicates that NH4⫹can
neu-tralize nss-SO42⫺both at Prasses and Nopigia. The slope of the
regression of 1 indicates almost complete neutralization of H2SO4forming mainly (NH4)2SO4.
[25] Finally, of particular interest is the halogen behavior.
Figures 9a and 9b present the variation of bromide and chlo-ride fractional deficit/excess during thee experiment as a func-tion of the net acidity. Net acidity has been defined as the
Figure 4. Variation of nss-SO42⫺, nss-Ca2⫹, and their ratio at Nopigia during the sampling period.
Figure 5. Per sector variation of nss-SO42⫺, NO3⫺, nss-Ca2⫹, and NH4⫹(in neq/m3) at Nopigia during the
difference between the acidic anions (nss-SO42⫺⫹ NO3⫺⫹
CH3SO3⫺) minus the basic cations (nss-Ca2⫹⫹ NH4⫹⫹
nss-K⫹) following Ayers et al. [1999]. For both halogens a net
anticorrelation between the halogen deficit and the acidity exists denoting an important role of acid catalysis to the deha-logenation process. A clear deficit has been observed only under north and NW air masses origin. In west and SW air masses, slight excess is observed probably due to adsorption of these acidic gases (HBr and HCl) on alkaline particles. In addition, the fractional Br deficit was higher compared to Cl deficit, in agreement with the model calculations [Keene et al., 1998] and the observations at Cape-Grim [Ayers et al., 1999]. Indeed, during the whole experiment the median values for Cl⫺and Br⫺deficits were 8 and 55%, respectively.
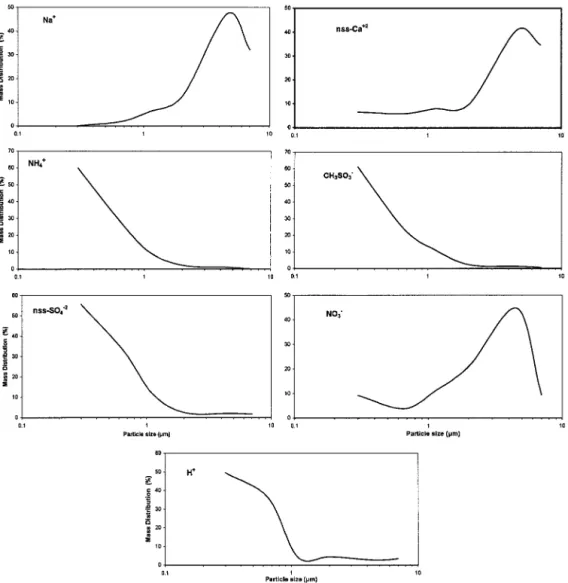
3.1.4. Particle Size Distributions
[26] Figure 10 presents the particle size distribution of
seven selected species denoting sea salt (Na⫹), dust
(nss-Ca2⫹), biogenic (NH
4⫹, MSA), and anthropogenic origin
(nss-SO42⫺, NO3⫺, H⫹(corresponding to the H⫹concentration of Figure 6. Variation of Mg2⫹and MSA at Nopigia as a function of wind speed during the sampling period.
Figure 7. Comparison between the sum of anions and cat-ions measured during the experiment both at Nopigia and
Prasses. Figure 8. Correlation between (a) Na
⫹ and Mg2⫹ and (b)
NH4⫹and nss-SO42⫺at Nopigia during the experiment.
the water extract of the filter)). In agreement with most aerosol size distributions reported in the literature, nss-SO42⫺, NH4⫹, H⫹, and MSA present their maximum in the
fine mode. On the other hand, Na⫹, nss-Ca2⫹, and NO 3⫺
present their maximum in the first stages as they result either from direct emission or adsorption of HNO3on
sea-salt particles. Of particular interest is the influence of air mass origin on size distribution of main anions and cations shown in Table 2. In this table we mainly focus on ionic species existing, in aerosol phase, in equilibrium with its gaseous phase precursor, i.e., nss-SO42⫺, NO3⫺, NH4⫹,
MSA, C2O42⫺, and Br⫺. As it can be seen, with the
excep-tion of NH4⫹for which no clear tendency exists, for all the
other species the South sector presents concentrations much higher in the coarse mode compared to the fine. The above tendency, which follows the pH of the aerosols, i.e., acidic in the north sector, basic in the south sector, can explain the absence of clear sector preference for NH4⫹. On the other
hand, the clear enrichment observed in the coarse mode under South sector influence for all the other ions (Table 2) corroborates the hypothesis presented by Dentener et al. [1996] of possible adsorption of acidic gases on alkaline medium such as dust. Note also the important depletion of Br⫺ from coarse particles in aerosols originating from the
N sector in agreement with the previous discussion on Br deficit.
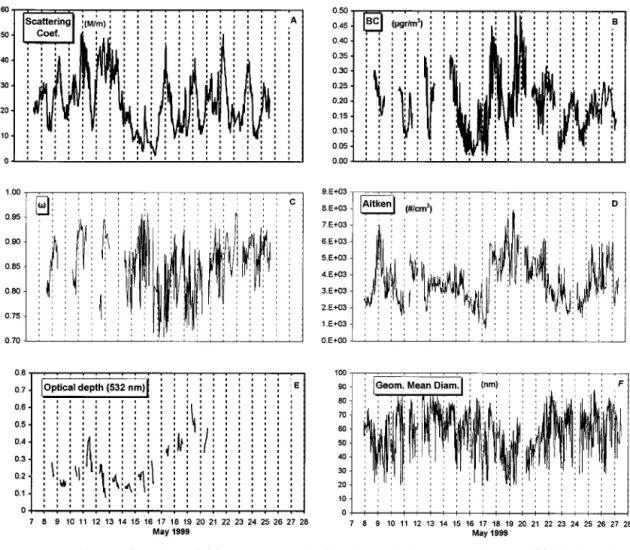
3.2. Physical and Optical Parameters 3.2.1. Time Series
[27] Figure 11 presents time series of the following param-eters:spmeasured with the nephelometer at 532 nm, black
carbon equivalent concentrations from the Magee aethalom-eter, single-scattering albedo, CN particle number concen-tration in their corresponding geometric diameter in the range (7–200 nm), and aerosol optical depth. Table 3 gives the arith-metic mean, the median, and the range of the above mentioned parameters.
[28] Aerosol scattering coefficient ranges from 2–51 M m⫺1
during the experiment (Figure 11a; average equal to 23.3) in agreement with the average background scattering coefficient of 25 M m⫺1observed by Ichoku et al. [1999] in a
Mediterra-nean arid environment. For comparison purposes, separation between dusty and nondusty periods has been performed on the basis of back trajectory calculations. Surprisingly, no im-portant difference was observed between dusty and nondusty periods indicating a comparable contribution of anthropogenic aerosols and dust at an area far from their sources since Crete is located at about 700 to 1000 km distance from Sahara, NW Europe, and Balkans, respectively, where the main sources are expected. The lowest values of aerosol scattering are observed from May 16 to 18 associated with transport from the west/
Figure 9. Variation of (a) Br⫺and (b) Cl⫺deficit/excess at Nopigia during the campaign and as a function
marine sector and consist the background of scattering coeffi-cient for the area.
[29] Aitken particle concentration as well as black carbon
where used as indicators of anthropogenic pollution (Figures 11b, 11d, and 11f). Aiken nuclei varied from 775 cm⫺3up to
8000 cm⫺3. The high values observed during three cases are
probably due to local pollution events. On the basis of the trajectory analysis presented in Figure 3, the higher Aitken
nuclei numbers are associated with transport from the N/NW sectors and the lowest with transport from the south and the west sectors. Of particular interest is the variation of the geo-metric diameter of Aitken nuclei during the campaign. With the exception of the low geometric diameters (around 20nm) observed during local pollution events due to fresh locally produced particles the majority of the cases were associated with a geometric diameter in the range of 40–80nm (median equal to 61nm). A closer look at the aerosol size distribution shows the existence of a monomodal distribution indepen-dently of the air masses origin, indicating aged long-range transported aerosol rather than locally produced.
[30] Black carbon (BC) concentrations range from 0.04 to
0.49g/m3 (median equal to 0.19). In the following discussion only the data obtained at Prasses site will be considered since Nopigia data are suspected to be influenced by local sources. The observed BC values are similar to those reported by
Ichoku et al. [1999] and to those measured at Finokalia in May
during the 1997-2000 period (0.26g/m3 (H. Cachier and N. Mihalopoulos, unpublished results, 2000)). Black carbon fol-lows quite well the Aitken nuclei (CN) variation; however, no significant correlation between these two parameters exists
Figure 10. Particle size distribution of seven selected species of sea salt (Na⫹), dust (nss-Ca2⫹),
anthropo-genic (nss-SO42⫺, NO3⫺, H⫹), and biogenic origin (NH4⫹, MSA) both at Nopigia and Prasses.
Table 2. Coarse to Fine Ratio of NH4⫹, Cl⫺, Br⫺, NO3⫺,
nss-SO42⫺, C2O42⫺, and CH3SO3⫺Concentrations at
Nopigia Under Northern and Southern Winds
Ratio (Coarse/Fine) North South NH4⫹ 0.16 0.17 Cl⫺ 0.35 2.28 Br⫺ 0.19 2.09 NO3⫺ 1.16 3.54 nss-SO42⫺ 0.05 0.11 C2O42⫺ 0.34 0.47 CH3SO3⫺ 0.04 0.12
probably due to their different lifetime (days for BC, few hours for CN).
[31] In modeling aerosol radiative forcing, “the key param-eter governing the amount of cooling versus heating is the single-scattering albedo, ” [Seinfeld and Pandis, 1998, pp. 1147–1152]. This parameter was computed from the absorp-tion coefficients (from the Prasses aethalometer measure-ments) and the nephelometer scattering coefficients both at 532nm wavelength. During this experiment, ranges from 0.91 when air masses are originating from the west sector (clean
marine sector) to 0.81 under N/NW flow (anthropogenic sec-tor; Figure 11c). The values observed during dust event (0.87) falls in the range of the values reported by Moulin et al. [1997a] and Hess et al. [1998] as representative of various desert dust aerosols models.
[32] Finally, Figure 11e presents the variation of optical
depth (O.D) as measured during the experiment using a spec-troradiometer equipped with a double monochromator (Bentham DTM300, United Kingdom). Optical depth ranges from 0.08 to 0.75 in the range of the values reported by Moulin
Figure 11. Time series plots of (a) sp measured with the nephelometer at 532 nm, (b) black carbon
equivalent concentrations from the Magee aethalometer, (c) single-scattering albedo , (d, f) CN particle number concentration in their corresponding geometric diameter in the range (7–200 nm), and (e) aerosol optical depth.
Table 3. Arithmetic Mean, Standard Deviation, Median, Range, and Number of Measurements of Black Carbon Equivalent Concentrations, Aerosol Scattering Coefficient, Single-Scattering Albedo (sp) Aerosol Optical Depth and CN
Particle Number Concentration and Their Corresponding Geometric Diameter During the Sampling Perioda
BC,g/
m3 ScatteringM/m O.D. Aitken, number/cm3 G.D.,nm
Average 0.19 23.3 0.85 0.28 3470 59 Median 0.19 22.2 0.86 0.22 3310 61 s.d. 0.09 10.2 0.05 0.14 1220 15 Maximum 0.49 50.7 0.96 0.75 7970 89 Minimum 0.04 2.4 0.71 0.08 775 19 Number (n) 768 2348 768 1782 1219 1219
et al. [1997b] for the Mediterranean area, and the highest
values are clearly associated with dust events as it can be seen from the trajectory analysis (Figure 3).
3.2.2. Relation of Physical and Optical Properties with Chemical Composition
[33] Figure 12a presents the variation of scattering
coeffi-cient (sp) with (NH4)2SO4 during the campaign. For both
parameters a separation between the dusty and nondusty pe-riods has been performed. The (NH4)2SO4was choosing
be-cause its mass scattering efficiency is a value used in modeling the direct effect of aerosols on climate. To calculate its mass scattering efficiency, the mass of (NH4)2SO4measured during
the campaign as a function of (sp) is reported in Figure 12b.
Values of 3.3 and 4.9 m2g⫺1have been derived for both the
dusty and nondusty periods, respectively, using the slopes of the regressions. The above values are in good agreement with the values of 3.6⫾2.3 and 3.8⫾0.8 reported by Maring et al. [2000] for Izana, located at the same latitude with Crete and the value of 5⫾2 used in climate forcing estimates [Charlson et
al. 1991].
[34] Optical depth variation has been compared with all the
main ionic constituents measured during the experiment; how-ever, a significant correlation was found only with nss-Ca2⫹
(Figures 13a and 13b). A possible explanation for this corre-lation is that nss-Ca2⫹values measured in Crete as well as at
other locations of the eastern Mediterranean compares
signif-icantly with the total A1 concentration concurrently measured (r2⫽0.55; n⫽600 (N. Mihalopoulos et al., unpublished data,
2000)). Thus the significant correlation between nss-Ca2⫹and
O.D simply indicates the role of dust in regulating the O.D. above the area.
4. Conclusions
[35] On the basis of the measurements of physical, optical,
and chemical properties of aerosols performed during a month period at coastal areas in Crete we can draw the following conclusions:
1. Non-sea-salt sulfate (nss-SO42⫺), nitrate (NO3⫺),
non-sea-salt calcium (nss-Ca2⫹), and NH
4⫹have been
identi-fied as the main ionic components of the aerosols. For nss-SO42⫺a very good agreement exists for all the sampling
sta-tions, indicating that the main factor controlling the nss-SO42⫺
distribution in the eastern Mediterranean is long-range trans-port rather than local sources.
2. Air mass origin was identified as the main factor con-trolling the variation of the above ions as well as their particle size distribution. Nss-SO42⫺and NH4⫹present the same
be-havior as a function of air masses origin, and their concentra-tion in the main wind sectors is following the tendency S⬍W⬍N⬍NW. For nss-Ca2⫹the higher values are associated
with the South sector. Finally, for the NO3⫺values, no clear
tendency is observed when the higher values occurred under
Figure 12. (a) Times series of measurements of aerosol scattering coefficient and (NH4)2SO4 at Nopigia
during the campaign. (b) Correlation between (NH4)2SO4andspduring the dusty and nondusty periods.
NW and South sectors’ influence. Absorption of acidic gases like HNO3on basic particles like dust as proposed by Dentener
et al. [1996] could account for this tendency.
3. A clear deficit has been observed for both chloride and bromide with a fractional deficit closely dependent to the net acidity. For both halogens a net anticorrelation between the halogen deficit and the acidity exists denoting an important role of acid catalysis to the dehalogenation process. The frac-tional Br deficit was higher compared to Cl⫺deficit, in
agree-ment with the model calculations [Keene et al., 1998] since during the whole experiment the median values for Cl⫺and
Br⫺deficits were 8 and 55%, respectively.
4. Aerosol scattering coefficient ranges from 2–51 M m⫺1with no significant difference between dusty and nondusty
periods. Significant correlations have been observed between (NH4)2SO4mass measured during the campaign and aerosol
scattering coefficient indicating the key role of (NH4)2SO4in
determining the radiative forcing of the eastern Mediterranean area. It is worthwhile note that the organic content of the aerosols was completely ignored in this study. Although the measured ionic part contributes up to 50% of the total aerosol mass [Kavouras et al., 1996; H. Bardouki et al., Chemical com-position of size resolved atmospheric aerosols in the eastern Mediterranean during summer and winter, submitted to
Atmo-spheric Environment, 2002], the organic content of the aerosols
could have also contributed to the observed aerosol scattering. 5. Finally, optical depth was found to significantly
cor-relate only with nss-Ca2⫹. Since nss-Ca2⫹values measured in
Crete as well as at other locations of the eastern Mediterra-nean compare well with the total Al concentration concur-rently measured, the significant correlation between nss-Ca2⫹
and O.D indicates the role of dust in regulating the O.D. above the area.
[36] Acknowledgments. We thank the European Commission, Environment and Climate Programme, (ENV4-CT97-0623), Univer-sity of Crete (ELKE) for financial support, Helene Cachier for the loan of Magee aethalometer, and Maria Kanakidou for helpful com-ments.
References
Ayers, G. P., R. W. Gillet, J. M. Cainey, and A. L. Dick, Chloride and bromide loss from the sea-salt particles in southern Ocean air, J.
Atmos. Chem., 33, 299–319, 1999.
Bardouki, H., Spatial and seasonal variability of DMS(X) species in the Eastern Mediterranean Sea, master thesis, Univ. of Crete, Her-aklion, Greece, 2000.
Belviso, S., S. K. Kim, F. Rassoulzadegan, B. Krajka, B. C. Nguyen, N. Mihalopoulos, and P. Buat-Menard, Production of dimethylsulfo-nium propionate (DMSP) and dimethylsulfide (DMS) by a micro-bial food web, Limnol. Oceanogr., 35, 1810–1821, 1990.
Charlson, R. J., J. Langner, H. Rodhe, C. B. Leovy, and S. G. Warren, Perturbation of the northern hemisphere radiative balance by back-scattering from anthropogenic sulfate aerosols, Tellus, Ser. AB, 43, 152–163, 1991.
Dayan, U., J. L. Heffter, J. M. Miller, and G. Gutman, Dust intrusion
Figure 13. (a) Times series of measurements of optical depth (O.D) and nss-Ca2⫹at Nopigia during the
events into the Mediterranean basin, J. Appl. Metorol., 30, 1185– 1199, 1991.
Dentener, F., F. Carmichael, Y. Zhang, J. Lelieveld, and P. Crutzen, Role of mineral aerosol as a reactive surface in the global tropo-sphere, J. Geophys. Res., 101, 22,869–22,889, 1996.
Draxler, R. R., and G. D. Hess, An overview of the HYSPLIT_4 modelling system for trajectories, dispersion and deposition, Aust.
Meteorol. Mag., 47, 295–308, 1998.
Ganor, E., and Y. Mamane, Transport of Saharan dust across the Eastern Mediterranean, Atmos. Environ., 16, 581–587, 1982. Gogou, A., E. Stephanou, N. Stratigakis, J. O. Grimalt, R. Simo, M.
Aceves, and J. Albaiges, Differences in lipid and organic salt con-stituents of aerosols from Eastern and Western Mediterranean coastal sites, Atmos. Environ., 28, 1301–1310, 1994.
Groene, T., Biogenic production and consumption of dimethylsulfide (DMS) and dimethylsulfoniopropionate (DMSP) in the amrine epipelagic zone: A review, J. Mar. Syst., 6, 191–209, 1995. Hansen, A. D. A., H. Rosen, and T. Novakov, The aethalometer- An
instrument for the real-time measurement of optical absorption by aerosol particles, Sci. Total Environ., 36, 191–196, 1984.
Hess, M., P. Koepke, and I. Schult, Optical properties of aerosols and clouds: The software package OPAC, Bull. Am. Meteorol. Soc., 79, 831–844, 1998.
Ichoku, C., et al., Interrelationships between aerosol characteristics and light scattering during late winter in an eastern Mediterranean arid environment, J. Geophys. Res., 104, 24,371–24,393, 1999. Intergovernmental Panel on Climate Change (IPCC), Climate Change
1995, edited by J. T. Houghton et al., 339 pp., Cambridge Univ.
Press, New York, 1996.
Kavouras, I., N. Mihalopoulos, E. Stephanou, C. Liousse, H. Cachier, B. C. Nguyen, F. Dulac, M. Kanakidou, P. Chazette, and J. P. Quisefit, Measurements of aerosol composition and optical depth above the Eastern Mediterranean Area, paper presented at the 21st General Assembly of the European Geophysical Society, The Hague, May 6–9, 1996.
Keene, W. C., R. Sander, A. A. P. Pzenny, R. Vogt, P. J. Crutzen, and J. N. Galloway, Aerosol pH in the marine boundary layer: A review and model evaluation, J. Aerosol. Sci., 29, 339–356, 1998.
Kouvarakis, G., and N. Mihalopoulos, Seasonal variation of dimethyl-sulfide in the gas phase and of methanesulfonate and non-sea-salt sulfate in the aerosol phase measured in the eastern Mediterranean atmosphere, Atmos. Environ., 36(6), 929–938, 2002.
Kouvarakis, G., K. Tsigaridis, M. Kanakidou, and N. Mihalopoulos, Temporal variations of surface regional background ozone over
Crete Island in southeast Mediterranean, J. Geophys. Res., 105, 4399–4407, 2000.
Kouvarakis, G., N. Mihalopoulos, T. Tselepides, and S. Stavrakakis, On the importance of atmospheric inputs of inorganic nitrogen species on the productivity of the eastern Mediterranean Sea, Global
Biogeochem. Cycles, 15(4), 805–818, 2001.
Kouvarakis, G., H. Bardouki, and N. Mihalopoulos, Sulfur budget above the eastern Mediterranean: Relative contribution of anthro-pogenic and biogenic sources, Tellus, 54, 201–213, 2002.
Maring, H., D. Savoie, M. A. Izaguirre, C. McCormick, R. Arimoto, J. M. Prospero, and C. Pilinis, Aerosol physical and optical proper-ties and their relationship to aerosol composition in the free tropo-sphere at Izana, Tenerife, Canary Islands, during July 1995, J.
Geo-phys. Res., 105, 14,677–14,701, 2000.
Mihalopoulos, N., E. Stephanou, M. Kanakidou, S. Pilitsidis, and P. Bousquet, Tropospheric aerosol ionic composition above the East-ern Mediterranean Area, Tellus, Ser. B, 314–326, 1997.
Moulin, C., F. Dulac, C. E. Lambert, P. Chazette, B. Chatenet, and F. Lavenu, Long-term daily monitoring of Saharan dust load over ocean using Meteosat ISCCP-B2 data, 2, Accuracy of the model and validation using Sun photometer measurements, J. Geophys. Res.,
102, 16,959–16,969, 1997a.
Moulin, C., F. Guillard, F. Dulac, and C. E. Lambert, Long-term daily monitoring of Saharan dust load over ocean using Meteosat ISCCP-B2 data, I, Methodology and preliminary results for 1983– 1994 in the Mediterranean, J. Geophys. Res., 102, 16,947–16,958, 1997b.
Seinfeld, J., and S. Pandis, Atmospheric Chemistry and Physics: From
Air Pollution to Climate Changes, John Wiley, New York, 1998.
Zerefos, C. S., Photochemical activity and solar ultraviolet radiation modulation factors (PAUR): An overview of the project, J. Geophys.
Res., 107(DX), 10.1029/2000JD000134, in press, 2002.
M. Blumthaler, Institute of Medical Physics, University of Inns-bruck, A-6020 InnsInns-bruck, Austria.
Y. Doukelis and S. Rapsomanikis, Laboratory of Air Pollution, Department of Environmental Engineering, Demokritos University of Thrace, 67100 Xanthi, Greece.
G. Kouvarakis and N. Mihalopoulos (corresponding author), Envi-ronmental Chemical Processes Laboratory, Department of Chemistry, University of Crete, P.O. Box 1470, 71409 Heraklion, Greece. (mihalo@chemistry.uoc.gr)
J. Sciare, LSCE, Orme des Merisiers, Bat 709, CE Saclay, 91191 Gif-sur-Yvette Cedex, France.