HAL Id: hal-02652747
https://hal.inrae.fr/hal-02652747
Submitted on 29 May 2020
HAL is a multi-disciplinary open access
archive for the deposit and dissemination of
sci-entific research documents, whether they are
pub-lished or not. The documents may come from
teaching and research institutions in France or
abroad, or from public or private research centers.
L’archive ouverte pluridisciplinaire HAL, est
destinée au dépôt et à la diffusion de documents
scientifiques de niveau recherche, publiés ou non,
émanant des établissements d’enseignement et de
recherche français ou étrangers, des laboratoires
publics ou privés.
Mathilde Causse, Nelly Desplat, Laura Pascual-Banuls, Marie-Christine Le
Paslier, Christopher Sauvage, Guillaume Bauchet, Aurélie Berard, Rémi
Bounon, Maria Tchoumakov, Dominique Brunel, et al.
To cite this version:
Mathilde Causse, Nelly Desplat, Laura Pascual-Banuls, Marie-Christine Le Paslier, Christopher
Sauvage, et al.. Whole genome resequencing in tomato reveals variation associated with introgression
and breeding events. BMC Genomics, BioMed Central, 2013, 14 (791), 14 p.
�10.1186/1471-2164-14-791�. �hal-02652747�
R E S E A R C H A R T I C L E
Open Access
Whole genome resequencing in tomato reveals
variation associated with introgression and
breeding events
Mathilde Causse
1*, Nelly Desplat
1,4, Laura Pascual
1, Marie-Christine Le Paslier
2, Christopher Sauvage
1,
Guillaume Bauchet
1,3, Aurélie Bérard
2, Rémi Bounon
2, Maria Tchoumakov
2, Dominique Brunel
2and Jean-Paul Bouchet
1Abstract
Background: One of the goals of genomics is to identify the genetic loci responsible for variation in phenotypic traits. The completion of the tomato genome sequence and recent advances in DNA sequencing technology allow for in-depth characterization of genetic variation present in the tomato genome. Like many self-pollinated crops, cultivated tomato accessions show a low molecular but high phenotypic diversity. Here we describe the
whole-genome resequencing of eight accessions (four cherry-type and four large fruited lines) chosen to represent a large range of intra-specific variability and the identification and annotation of novel polymorphisms.
Results: The eight genomes were sequenced using the GAII Illumina platform. Comparison of the sequences with the reference genome yielded more than 4 million single nucleotide polymorphisms (SNPs). This number varied from 80,000 to 1.5 million according to the accessions. Almost 128,000 InDels were detected. The distribution of SNPs and InDels across and within chromosomes was highly heterogeneous revealing introgressions from wild species and the mosaic structure of the genomes of the cherry tomato accessions. In-depth annotation of the polymorphisms identified more than 16,000 unique non-synonymous SNPs. In addition 1,686 putative copy-number variations (CNVs) were identified.
Conclusions: This study represents the first whole genome resequencing experiment in cultivated tomato. Substantial genetic differences exist between the sequenced tomato accessions and the reference sequence. The heterogeneous distribution of the polymorphisms may be related to introgressions that occurred during domestication or breeding. The annotated SNPs, InDels and CNVs identified in this resequencing study will serve as useful genetic tools, and as candidate polymorphisms in the search for phenotype-altering DNA variations. Keywords: Tomato, Genome, Sequence, Single nucleotide polymorphism, Introgression
Background
Currently next generation sequencing facilitates SNP discovery and allows deeper analysis of genome vari-ation [1,2]. In plants, SNP discovery has been performed either from RNA-Seq experiments [3,4] or whole gen-ome resequencing. Millions of polymorphisms have thus been discovered in Arabidopsis [5], rice [6,7], soy-bean [8] and maize [9,10].
The tomato genome has recently been sequenced and the international Tomato Genome Consortium has re-leased a high-quality reference sequence [11]. The avail-able sequence covers 780 Mb of the estimated 900 Mb. The annotation predicts 34,724 gene models, among which 30,855 were confirmed by RNA-Seq data. An initial comparison of the genomes of the sequenced cul-tivated accession (Solanum lycopersicum) and an acces-sion of the closest wild relative, S. pimpinellifolium, revealed more than 5.4 million SNPs representing a di-vergence of 0.6%.
* Correspondence:mathilde.causse@avignon.inra.fr
1
INRA, UR1052, Génétique et Amélioration des Fruits et Légumes, BP94, Montfavet F-84143, France
Full list of author information is available at the end of the article
© 2013 Causse et al.; licensee BioMed Central Ltd. This is an open access article distributed under the terms of the Creative Commons Attribution License (http://creativecommons.org/licenses/by/2.0), which permits unrestricted use, distribution, and reproduction in any medium, provided the original work is properly cited.
Tomato is a model species for fruit development and composition and is also a vegetable of high economic im-portance. It is grown all over the world, and its production has continuously increased over the last 50 years. Tomato originated in South America where all the wild species re-lated to cultivated tomato grow in the Andean region. Do-mestication probably started in Peru or Ecuador followed by diversification in Mexico or alternatively domestication directly took place in Mexico [12]. Tomato evolved fol-lowing several bottlenecks that considerably reduced the molecular diversity of the cultivated accessions. This hy-pothesis is supported by the very low polymorphism rate observed in cultivated species compared to wild relatives [13,14], but also when analyzing diversity profiles of cherry-type tomato accessions (S. lycopersicum cv. cerasi-forme), which are intermediate between wild and modern cultivated accessions [15,16]. In contrast, tomato breeding has led to a wide range of phenotypic adaptations to dif-ferent environments and difdif-ferent phenotypes for fruit shape, size and color [17]. This was mainly due to intro-gressions from the related wild species and the discovery of major mutations [18].
As a genetic model for fruit crops, tomato has been used in many QTL mapping and gene cloning studies. Due to the lack of molecular polymorphism, most of the gene and QTL mapping experiments were performed on inter-specific progeny involving a cultivated and a wild species [19]. The use of wild relatives has allowed the discovery of several useful genes and QTLs [20,21]. Since the first studies of tomato molecular diversity and gene mapping, molecular markers have evolved from RFLP [22] to AFLP [23], then SSR [24] and later SNP. SNPs were first discovered through in silico mining of EST [25-27] and amplicon sequencing of conserved ortholog sequences in different varieties [16,28,29]. Re-cently a large EST sequencing effort allowed the building of an Infinium array carrying≈ 8500 SNPs [30-32].
In this article we present the polymorphisms detected from the resequencing of eight tomato accessions chosen to represent a large range of intraspecific vari-ation. While characterizing the diversity of 360 tomato accessions with 20 SSR and later 275 SNPs, we devel-oped nested core collections representing a maximum of molecular and phenotypic variation [15]. In order to dis-cover SNPs and analyze the distribution of polymor-phisms in the tomato genome, we have re-sequenced the whole genomes of eight lines corresponding to the smal-lest core collection composed of four cherry-type and four cultivated accessions. The genome sequences were then aligned to the reference genome sequence and align-ments were screened for SNPs. The distribution and characteristics of the polymorphisms is presented. A set of SNPs was cross validated with results from a genotyp-ing array. The distribution of polymorphisms between
accessions and chromosomes is discussed in regard to the recent diversification of tomato.
Results
We analysed two groups of accessions: a group of four cherry-type tomato accessions whose genomes consist in an admixture between the genomes of S. lycopersicum and S pimpinellifolium [16] and a group of four large-fruited lines typical of the cultivated accessions or breed-ing lines used 1950 and 1970. The eight lines were chosen to maximise the molecular diversity detected with 20 SSR markers in a collection of 360 tomato ac-cessions [15]. Following Sanger sequencing of 81 ampli-cons in 90 accessions (S. pimpinellifolium, cherry and cultivated accessions), we showed that 76% of the 275 SNPs identified in the collection were detected in at least one of these eight lines [16]. Furthermore, the 66 SNPs that were not polymorphic among the eight lines were only polymorphic in S. pimpinellifolium accessions. We can thus predict that a large fraction of the SNPs present in any accession of the cultivated species were detected in this sample.
Genome sequencing
Genome sequencing of the eight tomato lines yielded 970 million reads, most of them being 101 bp paired-end reads. After cleaning, 82 to 90% of the reads remained and were mapped to the high-quality genomic reference sequence of Heinz 1706 [11]. A total of 95.4 to 98.8% of the reads mapped onto the genome, depending on the lines. The reads covered 89 to 92% of the refer-ence genome sequrefer-ence. The average sequrefer-ence depth of coverage varied from 6.7x to 16.6x depending on the ac-cession, with the average being 11.2x (Table 1).
Genome coverage was equivalent for all accessions and chromosomes except for one long region of chromosome 9 from the Levovil accession, which corresponded to an introgression from a distant species (Figure 1). The depth of coverage was also quite similar except for the peaks corresponding to regions with high homology with organ-elle genomes (predicted from the reference genome [11]). To avoid contamination with chloroplastic and mitochon-drial DNA reads, all the reads showing a depth higher than 128x were removed from subsequent analysis, as per-formed elsewhere [7].
Polymorphisms in the eight lines
A total of 4,290,679 unique SNPs and 127,913 InDels were detected when comparing each genome separately to the reference sequence, with the parameters defined in the Materials and Methods. For detecting homozy-gous polymorphisms, we applied two filters: a minimum of 4 reads and a maximum of 128 reads had to be mapped at any position and a minimum allele frequency
of 0.9 was required. If we increased the minimal depth to 8, the number of SNPs dropped to 3,173,618 but sev-eral polymorphisms previously detected by Sanger se-quencing were no longer detected, in particular in the three lines with a depth of coverage lower than 10x (Levovil, Ferum and Criollo).
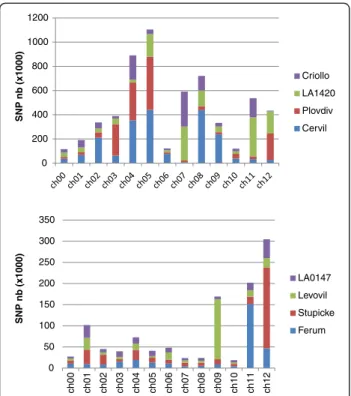
The total number of SNPs varied widely from one line to another, with a range of one to two million in the four S. l. cerasiforme accessions and from 180,000 to 350,000 in the four S. lycopersicum lines (Additional file 1). The total number of SNPs also varied widely between the dif-ferent chromosomes (Figure 2). Chromosomes 4, 5, 7, 8,
Table 1 Total number of reads sequenced and mapped onto the Heinz 1706 reference genome after resequencing eight tomato accessions using Illumina Genome Analyser
Accession Cervil Plovdiv LA1420 Criollo Stupicke Ferum Levovil LA0147
Nb reads (million) 149.2 124.7 121.9 84.3 123.7 88.4 69.2 208.4
Nb nucleotides (Gigabases) 15.1 12.6 12.3 8.5 12.5 8.9 7.0 20.2
Depth 19.6 16.5 16.2 11.1 16.4 11.7 9.2 26.5
% sequences after cleaning 85.3 87.3 90.1 89.6 88.3 87.5 88.2 81.8
Depth after cleaning 13.3 12.2 12.5 8.1 12.0 8.2 6.7 16.6
% sequences mapped 95.4 97.1 97.1 98.2 98.2 98.5 95.9 98.8
% coverage (depth = 4) 88.8 88.6 88.9 81.1 90.5 82.2 72.7 92.3
Figure 1 Genome View of the whole genome sequences (top) and zoom on chromosome 9 (bottom) of two lines (Stupicke top, Levovil Bottom). The high peaks correspond to sequences with high homology with organelle genomes. The chromosome 9 of Levovil corresponds to the introgression from a wild related species (image obtained with Integrative Genome Viewer IGV software; [52]).
9, and 11 carried the highest number of SNPs (more than 350,000 unique SNPs per chromosome) and very few SNPs were detected on chromosomes 1, 6, and 10 (less than 150,000 unique SNPs). The range of variation between the chromosomes reached 10-fold on average and 61-fold for the accession the most distant from the reference (Cervil).
The nucleotide diversity π (average number of SNPs per nucleotide) varied among the lines from 2.49×10⁻⁴to 2.81×10⁻³. In introns, these values ranged from 2.14×10⁻⁴ (for LA 0147) to 1.75×10⁻³(for Cervil) and in the coding sequences from 1.90×10⁻⁴to 1.29×10⁻³for the same lines (Figure 3). It also varied from one chromosome to another, with chromosome 10 showing the lowest value (9.80×10⁻⁴ on average for the eight accessions) and chromosome 5 the highest (9.5×10⁻³). The range of vari-ation in π among the lines was higher than 100-fold for chromosome 5 while it was lower than 10-fold for chro-mosomes 1 and 6. Within the lines, the range varied from 8-fold for LA 0147 to 63-fold for Cervil.
The contribution of each line to the overall number of SNPs was also highly variable. For instance, for the four S.l. cerasiforme accessions, more than 75% of the SNPs detected in Cervil were on chromosomes 2, 4, 5, 8 and 9, while chromosomes 4 and 7 contributed to more than
half of the SNPs of Criollo. The S. lycopersicum Levovil accession presented an excess of SNPs on chromosome 9 (52% of the SNPs for this accession were found on this chromosome), while this was evident on chromosome 11 for Ferum (50% of the SNPs) and on chromosome 12 for Stupicke (53% of the SNPs).
The distribution of the SNPs along each chromosome also showed high variation as illustrated in Figure 4 and Additional file 2 for every chromosome. In general, SNPs were more frequent in the distal parts of chromosomes, which correspond to regions with higher recombination frequency [33] and gene density [11]. Nevertheless some lines also exhibited large number of SNPs (more than 1000 SNPs/Mb) in long regions covering the centro-meric region such as on chromosomes 2, 4, 5, 8 and 9 for Cervil, on chromosome 3, 4, 5 and 12 for Plovdiv, on chromosome 5, 7, 8, 11 and 12 for LA 1420 and on chromosome 4, 7, 8 and 11 for Criollo. In the four large fruited lines, such patterns concerned only chromosome 9 for Levovil, 11 for Ferum and 12 for Stupicke. In these lines, a large number of regions were very poor in SNPs (less than 50 SNP/Mb in 93 regions of one megabase). SNP number did not appear to be related to the physical size of the chromosomes. Only 140,000 SNPs were dis-covered on the longest chromosome (chromosome 1, 90 Mb), while more than 600,000 were detected on chromosomes 4, 5 and 8, covering each around 60 Mb.
Validation of SNPs with the Infinium SNP array
In order to validate the SNPs detected, we compared the genotypes obtained from the SolCAP SNP array for 7720 SNPs [32] with the SNPs we detected for six of the eight lines. We detected 7430 SNPs (96.2%) that matched per-fectly. Among the 290 differences observed between our prediction and the SolCAP genotyping, 43 were different in every line and 166 just in one. Nevertheless 78% of the observed discrepancies were genotyped as heterozygous on the array and may thus correspond to a genotyping
0 200 400 600 800 1000 1200 SNP nb (x1000) Criollo LA1420 Plovdiv Cervil 0 50 100 150 200 250 300 350 ch00 ch01 ch02 ch03 ch04 ch05 ch06 ch07 ch08 ch09 ch10 ch11 ch12 SNP nb (x1000) LA0147 Levovil Stupicke Ferum
Figure 2 Distribution of the numbers of homozygous SNPs detected per chromosome and line for the fourS. l. cerasiforme lines, Cervil, Plovdiv, LA 1420 and Criollo (top) and the four S. lycopersicum large fruited lines, Stupicke, Ferum, Levovil and LA 0147 (bottom). 0 0,5 1 1,5 2 2,5 3 3,5 Poly morphism rate (SNP / kb ) intergenic intron CDS
Figure 3 Distribution of the polymorphism rate (π) in intergenic regions, introns and coding sequences (CDS) in the fourS. l. cerasiforme type lines and four S. lycopersicum large fruited lines.
error on the array. If we do not take into account the het-erozygous SNPs and those that were identical in every line, the rate of discrepancy dropped to below 1%.
Detection of InDels
A total of 127,913 unique InDels were detected in the eight lines compared to the reference genome. This number var-ied from 13,898 to 53,222 in cherry tomato lines and from 2,894 to 10,886 in S. lycopersicum lines (Additional files 2 and 3). Their distribution across chromosomes was more homogeneous than for SNPs, although a few chromosomes with a high density compared to the average could be de-tected (chromosome 4, 5, 7 and 8 in the cherry-type acces-sions and chromosomes 9, 11, and 12 for the cultivated tomatoes, Figure 5). In most cases, the chromosomes carry-ing a high number of SNPs also exhibited a high number of InDels. The correlation between SNP and InDel numbers on the 12 chromosomes was higher than 0.98 for all lines except for LA 0147 (r = 0.64). The frequency of InDels
varied on average from one per 14 kb for Cervil to one per 270 kb for Levovil. At the chromosome level, these values ranged from one indel per 6.4 kb to 717 kb. The majority of InDels corresponded to a unique base modification, but a maximum of 32 bp deletions and 25 bp insertions were detected. The number of insertions was a little higher than the number of deletions (with a ratio varying from 1.05 to 1.35) according to the lines.
Heterozygous SNPs
Tomato is an autogamous crop and the sequenced ac-cessions were maintained by controlled self pollination. We thus expected a very low rate of residual heterozy-gosity. An SNP was declared heterozygous when the fre-quency of both alleles was comprised between 0.4 and 0.6. The total number of unique heterozygous SNPs was 314,560 (Additional file 4). The distribution of heterozy-gous SNPs was much more homogeneous across lines and chromosomes than the distribution of homozygous
2.5 5 7.5 10 12.5 15 17.5 20 22.5 25 27.5 30 32.5 35 37.5 40 42.5 45 47.5 49.9 0 500 1000 1500 2000 2500 3000 Ch02 SNP Cervil Ferum Criollo LA0147 LA1420 Levovil Plovdiv Stupicke 2.5 5 7.5 10 12.5 15 17.5 20 22.5 25 27.5 30 32.5 35 37.5 40 42.5 45 47.5 50 52.5 55 57.5 60 62.5 65 65.3 0 500 1000 1500 2000 2500 3000 Ch07 SNP Cervil Ferum Criollo LA0147 LA1420 Levovil Plovdiv Stupicke 2.5 5 7.5 10 12.5 15 17.5 20 22.5 25 27.5 30 32.5 35 37.5 40 42.5 45 47.5 50 52.5 55 57.5 60 62.5 65 67.5 67.7 0 200 400 600 800 1000 1200 1400 1600 1800 Ch09 SNP Cervil Ferum Criollo LA0147 LA1420 Levovil Plovdiv Stupicke
SNPs (Additional file 5). The heterozygous SNPs corre-sponded to a variable fraction of the total SNPs (from 8% for Cervil to 27% for Levovil). A large part of the heterozygous SNPs (14.6%) were assigned to chromo-some 0 (corresponding to the sequences which could not be assigned to any of the 12 chromosomes due to the lack of genetic markers [11]) which represents only 2.7% of the reference genome and carries a large amount of repeated sequences. We could hardly identify any chromosome fragment in any line which could represent residual heterozygosity covering several hundreds of kb. This suggested that a large part of the heterozygous SNPs could result from mapping paralog sequences ra-ther than revealing actual residual heterozygozity.
SNP annotation
Among the SNPs, 57% were in intergenic regions, 34% in upstream or downstream regions of a gene, 5% were in-tronic and 3.4% in coding sequences. The effect of each SNP was classified according to SNPeff V2.1b software [34] into four classes (1)“modifier”, for the SNPs located outside the genes, in non transcribed regions or in introns, (2)“low effect” for variants in coding regions which do not change the amino acid sequence, (3)“moderate” effect for variants which change the amino acid sequence and (4) “high effect” for variants which modify splice sites, stop or start codons (loss or gain). Table 2 shows the proportion
of variants in each class. More than 98% of the SNPs were classified as modifiers. The fraction of moderate variants ranged from 0.93 to 1.5% according to the accessions and the low effect from 0.80 to 1.3%. The high effect variants represented the smallest class, with 184 to 937 SNPs de-pending on the line.
Among the SNPs detected in coding sequences, 40% led to synonymous amino acid changes, 56% to non synonym-ous amino acid changes, with 1.7% causing a start or stop loss or gain, 0.4% a change in splice site, 0.1% a stop in the coding sequence and 0.04% a non synonymous start. The percentage of InDel with high effects (0.7%) was higher than for SNPs (0.097%) as an InDel may rapidly cause a frame shift in the sequence (Additional file 6). The SNPs with a high effect impacted 1779 genes. GO annotation of these genes revealed an excess of genes related to apoptosis and tRNA processing. The SNPs with moderate (non synonymous) effects impacted 18,154 genes, corresponding to several functions, with an excess of GO categories re-lated to stress responses. The distribution into functional category of the genes subjected to high effect modifications were quite different for the eight lines, as illustrated in Figure 6 for two distant lines. The genes affected in the lines that are the closest to the reference sequence were mostly related to regulatory processes while in Cervil, the most distant line, they were involved in all categories.
Copy Number Variant (CNV) identification
Structural variations were detected in the genomes of the five lines with coverage higher than 10x by a global analysis of the read depth variation in 2000 bp-windows. The comparison of read depth along the chromosomes revealed at least 1686 regions where a significant vari-ation in depth in at least one line suggested a CNV. A maximum number of CNV was detected for Cervil (with 641 regions showing a significant lower depth and 234 regions a higher depth (Additional file 7). In contrast, LA 0147 showed an excess of regions with higher depth than the average (416 regions with excess and 125 with default). On average, 527 of the 1686 regions matched with a gene region, and in total 1235 genes were im-pacted. A significant excess of genes corresponding to cell death processes were detected.
Discussion
Several experiments have identified SNPs in tomato. A few thousand SNPs have been detected in EST sequences [35] or through RNA-Seq experiments [4]. The compari-son of the reference sequence of the cultivated accession Heinz 1706 and the draft genome of S. pimpinellifolium accession LA 1589 allowed the discovery of more than 5.4 million polymorphisms [11]. In the present study, a gen-ome wide analysis of eight tomato lines allowed the dis-covery of more than 4 million SNPs and almost 128,000
0 5000 10000 15000 20000 25000 InDel s Criollo LA1420 Plovdiv Cervil 0 1000 2000 3000 4000 5000 6000 InDel s LA0147 Levovil Stupicke Ferum
Figure 5 Distribution of the number of InDels detected per chromosome and line for the four S. l. cerasiforme lines (top) and the four S. lycopersicum lines (bottom).
Table 2 Distribution of the SNP effect per type of effect in the four cherry-type (S. l. cera) and four S. lycopersicum (S. lyc) lines
S. l. cera S. l. cera S. l. cera S. l. cera S. lyc S. lyc S. lyc S. lyc
Accession Cervil Plovdiv LA 1420 Criollo Stupicke Ferum Levovil LA 0147
High effect Total 937 701 648 572 273 240 220 184
Splice site acceptor 109 68 63 50 27 23 25 19
Splice site donor 104 70 57 64 18 27 17 14
Stop gained 409 328 294 244 106 76 69 65
Stop lost 214 169 170 156 86 81 82 65
Start lost 101 66 64 58 36 33 27 21
Moderate effect Total 25,632 18,390 14,333 15,713 6,678 5,504 5,915 4,101 Non synonymous coding
Low effect Total 19,681 13,698 9,700 12,244 4,750 3,624 4,304 2,537
Non synonymous start 18 13 6 17 4 4 6 4
Start gained 388 198 183 263 80 39 77 40 Synonymous coding 19,218 13,448 9,481 11,924 4,654 3,564 4,208 2,485 Synonymous stop 57 39 30 40 12 17 13 8 Modifier Total 2,349,654 1,669,629 1,516,290 1,231,706 439,151 366,977 323,588 233,987 Downstream 395,731 269,917 214,303 226,489 92,087 70,696 63,259 54,897 Intergenic 1,377,524 1,019,498 1,000,788 676,540 215,862 200,063 164,291 102,012 Intragenic 26,634 14,937 10,911 15,335 4,212 2,974 5,292 2,319 Intron 118,329 79,698 60,972 73,234 27,095 20,573 25,094 14,524 Upstream 422,540 280,576 225,411 234,350 95,053 71,642 63,800 59,194 UTR 5 Prime 2,540 1,371 1,110 1,551 507 280 1,383 305 UTR 3 Prime 6,347 3,632 2,795 4,207 1,335 749 469 736
SNPs were annotated using SNPeff onto the SL2.40 reference genome.
Figure 6 Distribution of the Gene Ontology of the genes for which SNP with High effect were detected in Cervil (blue, 603 genes) and Levovil (red, 43 genes) tomato lines.
InDels heterogeneously distributed across the chromo-somes and the lines, which could be utilized for subse-quent genetic analysis and for tomato improvement.
Data quality and conditions of SNP discovery
The whole genome sequences of the eight lines were mapped onto the Heinz 1706 reference sequence for polymorphism discovery. Only 3-5% of the reads could not be mapped in spite of the stringent criteria. This rate is much lower than the ratio of 20% of unmapped reads for S. pimpinellifolium [11] or 15% in rice [7]. The low rate of unmapped reads resulted from (i) the high quality of the reference genome sequence and of the sequences produced, (ii) the low percentage of repeated sequences in the tomato genome and (iii) the low polymorphism level in the lines studied. In contrast, a strong reduction of the genome coverage was observed for Levovil on chromosome 9 in the region carrying the Tomato mo-saic virus resistance gene (TM2-2), introgressed from a distant species, S. peruvanium [36]. The lower coverage observed only for this chromosome suggested that this phenomenon is caused by the high divergence between the species, and not by copy number variation or InDels with respect to the reference genome.
Illumina sequencing allowed the detection of more than 4 million SNPs. The error rate for Illumina sequencing is low (0.5 to 0.8 errors per 100 bp; [37]) and we applied a stringent selection criterion on read quality and retained only the SNPs that reached a minimum of 4x coverage per individual. When we increased the threshold to a mini-mum coverage of 8x, the number of SNPs dropped to about 3 million (75% remained), but several SNPs previ-ously detected by Sanger sequencing [16] were no longer detected. We thus preferred a less stringent threshold. Fi-nally the cross validation with the SNP array data gives a high level of confidence in the SNPs.
Polymorphism detection is now possible in closely related accessions
Most of the SNPs were detected in one of the cherry to-mato lines. Cherry toto-mato genome was shown to consist in an admixture between the genomes of S. lycopersicum and S pimpinellifolium [16], resulting in regions with high polymorphism compared to the reference genome (corre-sponding to introgressions) and regions with low poly-morphism. The percentage of unique SNPs provided by the four S. lycopersicum were on average lower than 10% with the exception of chromosome 12, for which Stupicke provided 65% of the unique SNPs. This is in agreement with the distances among the lines (Additional file 8).
We assessed the number of common polymorphisms be-tween lines in a pairwise approach including the SNPs de-tected in S. pimpinellifolium LA 1589 (Table 3). When comparing the two lines most distant from the reference
genome, Cervil and Plovdiv (carrying 2.02 million and 1.45 million SNPs, respectively), 828,000 SNPs were common to both lines, and thus 1.19 and 0.62 million SNPs were specific to each line. If we compare these two lines to the S. pimpinellifolium genome, we detected 1.53 and 1.06 million SNPs common to the wild species, respectively. Thus each line carried around 500,000 SNP not detected when comparing LA 1589 and Heinz 1706. This suggested that there is still a high number of SNPs to be discovered in S. pimpinellifolium and cherry-type accessions.
In cultivated tomato, the scarcity of polymorphisms at the molecular level hampered the construction of satu-rated intraspecific maps until SNP discovery. Interestingly, even in the two lines that are the closest to the reference genome (LA 0147 and Levovil), one half to two-thirds of the SNPs remained specific to each line. Even the chromo-somes with the lowest SNP number exhibited more than 3,000 SNPs. It is thus now possible to build genetic maps of almost any cross and address genetic questions at the intraspecific level, which was not possible before the avail-ability of resequencing approaches.
New rapid and low-cost techniques based on next-generation sequencing platforms have been proposed to identify SNPs among lines. They consist either in a first genome reduction before sequencing or in low coverage whole genome resequencing such as Genotyping by Se-quencing (GBS) [38]. In tomato, depending on the dis-tance between the lines, genome reduction may lead to a low number of SNPs and GBS may be preferred in intra-specific crosses.
Non random distribution of polymorphisms
The SNPs and InDels appeared non-randomly distributed between different chromosomes, but also within each chromosome (Figure 7). For instance, the overall number of SNPs detected on chromosome 10 was 10-fold lower than that on chromosome 5. Despite good coverage, a few regions appeared with a low SNP density in every line, for example: a few Mb in the middle of chromosomes 6 and 10 (although these regions were well covered). Such SNP “deserts” are also reported in other species [7] and must be confirmed in a larger sample. The SNP numbers were not related to the length of chromosomes or to gene density. Some regions, particularly at the distal ends of the chromosomes, carried a large proportion of the polymorphisms (Figure 7 and Additional file 2). The four S. lycopersicum lines also showed some regions poor in SNPs compared to the four cherry-type tomato lines, notably on chromosome 1, 5, 7 and 8. The most striking feature is the occurrence of large regions cove-ring more than 10 Mb, present in one or two lines, and carrying large number of SNPs. This kind of pattern ap-peared on chromosome 2 and 8 for Cervil, on chromo-some 3 for Plovdiv, on chromochromo-some 9 for Levovil, on
chromosome 11 for LA 1420 and Ferum and on chromo-some 12 for Stupicke. Cervil and Plovdiv presented the same profiles for chromosome 4 and 5, with regions of low SNP density spread over regions of higher SNP dens-ity. Charles Rick, a pioneer in tomato genetics, underlined the role of natural hybridization in tomato, particularly in South America where cultivated accessions may grow close to wild relatives [39]: this phenomenon could have resulted in large introgressions, as shown here, particularly in the cherry tomato accessions.
Since the early 20th Century, tomato breeders have crossed cultivars with wild species in order to transfer re-sistance genes [17]. This has resulted first in the intro-gression of large DNA fragments of the wild species surrounding the resistance gene, inducing linkage drag. Subsequent backcrosses reduced the introgression size with more or less success [36]. The introgression of dis-ease resistance genes in many cultivars has strongly influ-enced the SNP patterns. The reference genome of Heinz 1706 carries several fragments introgressed from S. pimpi-nellifolium [11], notably the resistance genes against Verti-cilllium (Ve gene on the top of chromosome 9) and Fusarium (I2 gene on the bottom of chromosome 11). Other introgression events from S. pimpinellifolium in the Heinz 1706 genome have been reported, particularly a large one on chromosome 4 [11]. Among the resequenced lines, Ferum carried the Ve gene, Ferum and Criollo car-ried the I2 resistance gene, but it was not possible to relate the presence/absence of these genes with variations in polymorphism rate. Cervil carried the resistance gene to Fusarium radicis on chromosome 9 (position not yet identified). Chromosome 9 of Levovil carried the TMV re-sistance gene introgressed from S. peruvianum (Tm2-2 gene, position 13,622,689). This introgression from a dis-tant species reduced the coverage depth in the region, but
the number of SNPs detected with the mapped reads was higher than in the rest of the genome for this line. For the other regions it is more difficult to identify any known introgressed gene. These regions often cover the centromeric regions where the recombination rate is lower [33] and thus an introgressed fragment may cover a large part of the chromosome. Our results confirmed the observations based on the SNP array showing that variable polymorphism rates from one chromosome to another reveal the breeding history [32].
Structural modification
In S. pimpinellifolium, 3,423 genome regions were lack-ing when compared to Heinz 1706 with large regions missing on chromosome 1 and 10 [11]. We detected around 1,700 CNV in the five lines with a coverage depth higher than 10x. This number is much lower than in allogamous species like maize where structural varia-tions are much more frequent [10]. The frequency of CNV could be related to the SNP frequency, except for LA 0147 which presented an excess of InDels and CNV compared to its SNP number.
SNP annotation
Annotation of SNPs and InDels in the eight lines showed that less than 5% of the polymorphisms occurred in cod-ing regions. The 55,337 unique polymorphisms with sig-nificant effects (non synonymous, splice site, start or stop site variation) affected 20,959 genes. Non synonymous to synonymous ratios ranged from 1.34 on average in the four cherry tomato lines to 1.48 on average in the four cultivated lines. These values are close to those detected in soybean (1.36 and 1.38 in wild and cultivated acces-sions, respectively [8]), and in rice (1.2; [7]). The nucleo-tide diversity decreased in the coding sequences in every
Table 3 Number of common SNP (upper diagonal) and InDel (lower diagonal) in all the pairs of comparisons (SNP defined with a depth higher than 4 in both accessions, except for LA 1589,S. pimpinellifollium)
S. lyc S. lyc S. lyc S. lyc S. l. cera S. l. cera S. l. cera S. l. cera S. pim SNP InDel Nb vs Ref. LA0147 Levovil Ferum Stupicke Criollo LA1420 Plovdiv Cervil LA 1589
Nb vs Ref. 182,371 271,458 306,083 356,655 1,042,928 1,358,257 1,457,098 2,028,568 4,524,892 LA 0147 7,969 82,460 85,695 116,904 63,915 79,616 76,642 87,389 76,628 Levovil 2,894 517 49,318 80,009 54,538 49,482 53,472 78,907 67,886 Ferum 4,532 715 353 71,995 122,094 116,987 68,448 64,689 207,309 Stupicke 10,886 1,544 540 738 70,024 217,565 244,284 111,531 193,353 Criollo 13,898 612 336 601 727 458,908 164,449 260,234 501,982 LA 1420 30,927 1,298 468 910 2,366 2,666 310,635 222,517 537,839 Plovdiv 33,966 1,227 460 722 2,621 1,262 3,106 828,296 1,065,584 Cervil 53,522 1,521 534 807 1,746 1,811 2,532 8,441 1,538,643 LA 1589 201,502 304 771 328 591 910 1,519 3,273 5,707
Accessions consist in four S. lycopersicum (S. lyc), four cherry-type (S. l. cera) and one S. pimpinellifolium (S. pim) accessions. The first line and column indicate the number of SNP and InDel detected when compared to the reference genome [11].
line, as expected. The four cultivated lines exhibited a lower overall diversity compared to the four cherry-type accessions, but also a lower ratio of SNP between non coding and coding sequences, reflecting the purifying
effect of breeding selection. SNPs with large effects are often detected at higher frequencies in stress related genes as shown in maize [9] or in Arabidopsis thaliana [5]. An excess of genes related to cell death and regulator genes
Figure 7 Single nucleotide polymorphisms (SNP) variation across the genome in the two groups of four cherry-type tomato lines (Cervil, Plovdiv, LA 1420, Criollo from top to bottom) followed by the four cultivated lines (Stupicke, Ferum, Levovil and LA 0147 from top to bottom). The x-axis represents the physical distance along the chromosomes, in which each tick-mark is one megabase. For each chromosome, the regions with extremely low SNP frequencies (less than 20% of the SNP from the group of four lines) are shown in white, and the regions with the 20% highest density of the SNPs (per group of four lines) are shown as red blocks.
was also detected in the polymorphisms with high effects detected between S. lycopersicum and S. pimpinellifolium [11]. In the present study, we observed the same trend for the 2,012 and 887 genes showing high effect SNPs and InDels, as well as in the 1,235 genes affected by CNVs.
A catalogue of variations useful for genetic studies
For years, we have studied the progeny of the cross be-tween two of the studied lines, Cervil and Levovil. We identified several QTLs for fruit quality traits [40] and fine mapped some of them [41]. The availability of the reference genome allowed us to rapidly positionally clone a QTL controlling locule number [42]. The avail-ability of the annotated sequences of both lines consider-ably facilitates the identification of the genes and alleles underlying the QTLs. Recently we constructed a Multi Allelic Genetic Intercross (MAGIC) population derived from the intercross of the eight lines. With a broad gen-etic basis and higher recombination fraction than bi-parental populations, the MAGIC population is particu-larly interesting for QTL identification [43]. Based on our resequencing effort, a set of SNPs regularly spaced along the chromosomes was identified in order to con-struct a genetic map of the population and for QTL mapping. Genome wide association is a complementary approach to identify QTLs. The admixture state of cherry tomato accessions is particularly adapted to such analysis [16,44]. Once a region carrying a QTL is identi-fied using an SNP array, the availability of the catalogue of SNPs present in that region and their annotation will be very useful for the identification of the putative SNP responsible for the QTL. Beyond providing a highly valuable resource in terms of polymorphism, this cata-logue allows a look at the past, revisiting and interpret-ing the breedinterpret-ing history of accessions and foreseeinterpret-ing the future through the use of high density mapping and de-tection of fine haplotypes and imputation of SNPs on large accessions panels.
Conclusion
Next generation sequencing has provoked a revolution in plant research and genetics and offers a wide range of applications [45]. In the present study, we used eight very diverse lines to detect more than 4 million SNPs, around 128,000 InDels and 1,700 CNVs. We showed that it was possible to detect thousands of SNPs even in closely related lines like Heinz 1706 and Levovil, offer-ing new perspectives for tomato breedoffer-ing. The distribu-tion of SNPs was heterogeneous and revealed traces of ancient introgressions or breeding efforts. These data are particularly useful for the identification of QTLs and new alleles. Today several projects resequencing tomato accessions are underway [46]. The number of SNPs avail-able will thus rapidly increase, allowing the identification
of new introgressions and regions of the genome under selection.
Methods
Materials and library construction and sequencing
DNA was extracted from young leaves of four Solanum lycopersicum lines (Levovil, Stupicke Polni Rane – herein Stupicke, LA 0147 and Ferum) with large fruits and four cherry-type accessions, S. l. var cerasiforme lines (Cervil, Criollo, Plovdiv24A –herein Plovdiv, and LA 1420). LA 0147 and LA 1420 were kindly provided by the Tomato Genetics Resource Center, Davis, California. Cervil and Levovil were provided by Vilmorin Seed Company. The other lines are conserved in the Genetic Resource Center in INRA, Avignon (France). Genomic DNA quality con-trol, Illumina libraries construction and sequencing on GAIIx (Genome Analyser, Illumina corporation Inc.) were performed at Unité Etude du Polymorphisme des Génomes Végétaux, INRA, using the Bank service and Illumina sequencers facilities of CEA-Institut de Génomique/ CNG, Evry (France). All the DNA samples went through quality control successfully. Non-indexed paired-ends (PE) libraries were carried out with an initial input DNA of 3μg by following the Illumina Paired-End DNA Sample Prep protocol (Part # 1005063 Rev.D, February 2010) with some modifications: 3μg of Genomic DNA were submit-ted to fragmentation by using Adaptive Focused Acoustics (AFA) process from Covaris technology (S2 Focused-Ultrasonicator). After end-repairing and adapters ligation, a 400-bp size selection of DNA fragments was performed by band excision after gel electrophoresis. The steps of fragmentation, ligation and PCR were validated on Agilent 2100 BioAnalyser. One lane per library was originally loaded on several flow cells, Clusters amplification was performed either on a Clustering Station or a Cbot, then sequencing was performed as a PE 76b/101b run length on GAIIx, following technological improvements. Data from a total of 14 sequencing runs were collected, 3 single 101 bp, (not paired-end because sequencing failed for the read-2), one 76-bp long and all others 101 bp-long. A first analysis was conducted by applying the process of quality control and cleaning for validation of the sequencing data.
Sequence processing, mapping and SNP/InDel calling
Before the mapping step, sequences were cleaned and fil-tered with Python home-made scripts (available upon re-quest to the authors). First, duplicated sequences were removed. Then low quality regions (phred score lower than 28) were cleaned, and sequences shorter than 30 nucleo-tides, or containing more than two N were removed. After the cleaning step, single and paired-end sequences were kept in different files. Cleaned reads were mapped onto the total Tomato reference genome (Sol Genomics Network, build 2.40; [11]) with the BWA algorithm (version 0.5.9;
[47]) with mismatch penalty 3 and gap open penalty 5. The obtained BAM files were processed and adapted for the SNP calling program with SAMtools (version 1.1.18; [48]). Finally, SNP and InDel calling was performed using VarScan2 software (version 2.2.8; [49]) with a minimum depth of coverage of 4 per individual, a minimum quality of 30 per position and an allelic frequency of 0.9 for homozygous SNP/InDel and between 0.4 and 0.6 for het-erozygous SNPs. In the last step, we removed the variants where the reference allele was an N or that were sup-ported for more than 90% sequences in the same strand. The polymorphisms detected were also compared to the list of polymorphisms detected in the S. pimpinellifolium LA 1589 draft genome [11].
For the identification of copy number variation re-gions, the BAM files were analysed with the cn.Mops bioconductor package [50]. Only the five accessions with an average sequence depth greater than 10x were com-pared. Copy numbers were calculated and normalized for 2000 bp-windows. Calling of varying regions was done with the cn.Mops package default parameters.
SNPs and InDels annotation
The VarScan2 output files (VCF) containing the homo-zygous SNPs and InDels were annotated based on their genomic location with the SnpEff software (version 2.1b; [34]). A tomato reference database, including the To-mato reference genome and the genome annotation (Sol Genomics Network, ITAG2.3), was created and used to categorize the effects of the allelic variants. Effects were classified by impact (High, Moderate, Low and Modifier) and effect (synonymous or non-synonymous amino acid replacement, start codon gain or loss, stop codon gain or loss or frame shifts). A GO term annotation file was created from the GFF file of genome annotation (Sol Genomics Network, ITAG2.3). Based on that file, a func-tional classification of the genes with allelic variants for each accession and impact category was performed. The enrichment in GO terms for each group was determined with a Fisher's Exact Test. All functional analyses were performed using the Blast2GO software [51].
Validation of SNPs
To validate the identified homozygous SNPs, we com-pared the predicted genotypes and the genotypes ob-tained using the Infinium SolCAP’s Illumina Bead Chips [33] for six of the studied lines. Genomic DNA was ex-tracted from young leaves of Cervil, Criollo, Ferum, LA 0147, Levovil, Stupicke and Heinz 1706. The samples were genotyped using SolCAP’s Illumina Bead Chips (Illumina, San Diego, California, USA) developed by the SolCAP project [31]. Genotyping was performed accor-ding to the manufacturer’s instructions for Illumina Infi-nium assay (Illumina Inc., San Diego, CA, USA). Intensity
data was processed using the Illumina GenomeStudio v.2011.1 software.
Data availability
This study is recorded in the European Nucleotide Archive (ENA) with the project number PRJEB4395 (http://www. ebi.ac.uk/ena/data/view/PRJEB4395). Raw sequences, i.e. 11 fastq files, have been deposited in ENA with accession numbers ERR327646 to ERR327656. Files containing the SNPs and INDELs identified for the eight accessions, i.e. 16 vcf files, have been deposited in ENA with accession num-bers ERZ015686 to ERZ015701. BAM files and SNP char-acteristics are available upon request to the corresponding author and on the SolGenomics ftp site (ftp://ftp.solge-nomics.net/projects/causse_tomato_snp8lines). Detailed in-formation on CNV is available in Additional file 9 (CNV). Additional files
Additional file 1: Table listing the number of homozygous SNPs per chromosome and line.
Additional file 2: Figure showing the distribution of genes, homozygous and heterozygous SNPs and InDels along each chromosome over the 8 accessions and for each accession (using a window size of 100 kb).
Additional file 3: Table listing the number of homozygous InDels per chromosome and line.
Additional file 4: Table listing the number of heterozygous SNPs in genomic DNA of the eight accessions (0.4> allelic frequency > 0.6). Additional file 5: Figure showing the distribution of the number of heterozygous SNPs.
Additional file 6: Table listing the classification of InDels in coding sequences according to their effects (snpEff version 2.1b). Additional file 7: Table listing the number of regions showing a significant copy number variant (+: excess, -: default of copy number compared to the reference genome).
Additional file 8: Phylogenetic tree representing the 8 accessions, Heinz 1706 and LA 1589, constructed with the set of 7200 SNP positions common to the SolCap array.
Additional file 9: Table listing the position and characteristics of all the CNVs.
Abbreviations
SNP:Single nucleotide polymorphism; CNV: Copy number variation; InDel: Insertion deletion; SSR: Single sequence repeat; QTL: Quantitative trait locus.
Competing interests
The authors declare that they have no competing interests. Authors’ contributions
MC wrote the article. LP, GB and CS assisted in editing the article. AB and RB prepared the Illumina libraries. ND, MT, LP and JPB analyzed the data. CS and GB analysed the SNP array data. MC, MCLP and DB conceived and directed the research. All authors read and approved the final manuscript. Acknowledgements
This project was funded by INRA AIP Bioressources and ANR MAGIC-Tom SNP project 09-GENM-109G. We thank Jiang Ke and Zachary B. Lippman (Cold Spring Harbour Laboratory, New Yrk, USA) for providing the SNP dis-covered in S. pimpinellifolium, Lukas Mueller (Boyce Thompson Institute for Plant Research, New York, USA) for placing supplementary data onto Sol
Genomics ftp site, Rebecca Stevens (INRA, Avignon) and an anonymous re-viewer for editing the text, Yolande Carretero and the GAFL Experimental In-stallation team for plant care and Marie Thérese Bihoreau, team leader of the high throughput sequencing platform at Centre National de Genotypage/ Institut de Génomique/CEA. We acknowledge the early involvement of Stéphane Munos in the experiment.
Author details
1INRA, UR1052, Génétique et Amélioration des Fruits et Légumes, BP94,
Montfavet F-84143, France.2US1279 INRA, Etude du Polymorphisme des Génomes Végétaux, CEA-Institut de Génomique-Centre National de Génotypage, Evry 91057, France.3Syngenta Seeds 12, chemin de l’Hobit, Saint-Sauveur 31790, France.4ND present address: BIOGEMMA, Centre de
Recherche de Chappes, CS 90126, Chappes 63720, France.
Received: 11 March 2013 Accepted: 7 November 2013 Published: 14 November 2013
References
1. Deschamps S, Campbell MA: Utilization of next-generation sequencing platforms in plant genomics and genetic variant discovery. Mol Breeding 2010, 25:553–570.
2. Jackson SA, Iwata A, Lee SH, Schmutz J, Shoemaker R: Sequencing crop genomes: approaches and applications. New Phytol 2011, 191:915–925. 3. Choi IY, Hyten DL, Matukumalli LK, Song Q, Chaky JM, Quigley CV, Chase K,
Lark KG, Reiter RS, Yoon M-S, Hwang EY, Yi SI, Young ND, Shoemaker RC, van Tassell CP, Specht JE, Cregan PB: A soybean transcript map: gene distribution, haplotype and single-nucleotide polymorphism analysis. Genetics 2007, 176(1):685–696.
4. Francis D, Van Deynze A, Hamilton J, Robbins M, Sim SC, De Jong W, Douches D, Buell R: Next-generation sequencing of the tomato transcriptome: a resource for SNP discovery, high throughput genotyping, and translational research. Hort Sci 2010, 45:S9. 5. Gan X, Stegle O, Behr J, Steffen JG, Drewe P, Hildebrand KL, Lyngsoe R,
Schultheiss SJ, Osborne EJ, Sreedharan VT, Kahles A, Bohnert R, Jean G, Derwent P, Kersey P, Belfield EJ, Harberd NP, Kemen E, Toomajian C, Kover PX, Clark R, Rätsch G, Mott R: Multiple reference genomes and transcriptomes for Arabidopsis thaliana. Nature 2011, 477:419–423. 6. Xu X, Liu X, Ge S, Jensen JD, Hu FY, Li X, Dong Y, Gutenkunst RN, Fang L,
Huang L, Li JX, He WM, Zhang GJ, Zheng XM, Zhang FM, Li YR, Yu C, Kristiansen K, Zhang XQ, Wang J, Wright M, McCouch S, Nielsen R, Wang J, Wang W: Resequencing 50 accessions of cultivated and wild rice yields markers for identifying agronomically important genes. Nat Biotech 2012, 30:105–157.
7. Subbaiyan GK, Waters DLE, Katiyar SK, Sadananda AR, Vaddadi S, Henry RJ: Genome-wide DNA polymorphisms in elite indica rice inbreds discovered by whole-genome sequencing. Plant Biotech J 2012, 10:623–634. 8. Lam HM, Xu X, Liu X, Chen W, Yang G, Wong FL, Li MW, He W, Qin N,
Wang B, Li J, Jian M, Wang J, Shao G, Wang J, Sai-Ming Sun S, Zhang G: Resequencing of 31 wild and cultivated soybean genomes identifies pat-terns of genetic diversity and selection. Nat Genet 2010, 42:1053–1059. 9. Lai JS, Li RQ, Xu X, Jin WW, Xu ML, Zhao HN, Xiang ZK, Song WB, Ying K, Zhang M, Jiao YP, Ni PX, Zhang JG, Li D, Guo XS, Ye KX, Jian M, Wang B, Zheng HS, Liang HQ, Zhang XQ, Wang SC, Chen SJ, Li JS, Fu Y, Springer NM, Yang HM, Wang JA, Dai JR, Schnable PS, Wang J: Genome-wide patterns of genetic variation among elite maize inbred lines. Nat Genet 2010, 42:1027–1030.
10. Hufford M, Xu X, van Heerwaarden J, et al: Comparative population genomics of maize domestication and improvement. Nat Genet 2012, 44:808–811.
11. The tomato genome consortium: The tomato genome sequence provides insights into fleshy fruit evolution. Nature 2012, 485:635–641.
12. Blanca J, Cañizares J, Cordero L, Pascual L, Diez MJ, Nuez F: Variation revealed by SNP genotyping and morphology provides insight into the origin of the tomato. PLoS One 2012, 7:10.
13. Miller JC, Tanksley SD: RFLP analysis of phylogenetic relationships and genetic variation in the genus Lycopersicon. Theor Appl Genet 1990, 80:437–448.
14. Jimenez-Gomez JM, Maloof JN: Sequence diversity in three tomato species: SNPs, markers, and molecular evolution. BMC Plant Biol 2009, 9. doi: 10.1186/1471-2229-9-85.
15. Ranc N, Muños S, Santoni S, Causse M: A clarified position for Solanum lycopersicum var. cerasiforme in the tomato (Solanaceae) evolutionary history. BMC Plant Biol 2008, 8:130.
16. Ranc N, Muños S, Xu J, Le Paslier MC, Chauveau A, Bounon R, Rolland S, Bouchet JP, Brunel D, Causse M: Genome-wide association mapping in tomato (Solanum lycopersicum) is possible using genome admixture of Solanum lycopersicum var. cerasiforme. G3– Genes Genomes Genetics 2012, 2:853–864.
17. Labate JA, Grandillo S, Fulton T, Muños S, Caicedo AL, Peralta I, Ji Y, Chetelat RT, Scott JW, Gonzalo MJ, Francis D, Yang W, van der Knaap E, Baldo AM, Smith-White B, Mueller LA, Prince JP, Blanchard NE, Storey DB, Stevens MR, Robbins MD, Fen Wang J, Liedl BE, O’Connell MA, Stommel JR, Aoki K, Iijima Y, Slade AJ, Hurst SR, Loeffler D, Steine MN, Vafeados D, McGuire C, Freeman C, Amen A, Goodstal J, Facciotti D, Van Eck J, Causse M: 1 Tomato. In“Genome Mapping and Molecular Breeding in Plants”, Volume 5, Vegetables. Edited by Kole C. Verlag Berlin Heidelberg: Springer; 2007:11–135. 18. Gur A, Zamir D: Unused natural variation can lift yield barriers in plant
breeding. PLoS Biol 2004, 2:e245.
19. Zamir D: Improving plant breeding with exotic genetic libraries. Nat Rev Genet 2001, 2:983–989.
20. Grandillo S, Chetelat R, Knapp S, Spooner D, Peralta I, Cammareri M, Perez O, Termolino P, Tripodi P, Chiusano ML, Ercolano MR, Frusciante L, Monti L, Pignone D: Solanum sect. Lycopersicon. In Wild Crop Relatives: Genomic and Breeding Resources. Edited by Kole C. Berlin Heidelberg: Springer; 2011:129–215.
21. Frary A, Nesbitt TC, Frary A, Grandillo S, Van Der Knaap E, Cong B, Liu J, Meller J, Elber R, Alpert KB, Tanksley SD: fw2.2: a quantitative trait locus key to the evolution of tomato fruit size. Science 2000, 289:85–88. 22. Tanksley SD, Ganal MW, Prince JP, De Vincente MC, Bonierbale MW, Broun
P, Fulton TM, Giovannoni JJ, Grandillo S, Martin GB, Messeguer R, Miller JC, Miller L, Paterson AH, Pineda O, Riider MS, Wu RAWW, Young ND: High density molecular linkage maps of the tomato and potato genomes. Genetics 1992, 132:1141–1160.
23. Park YH, West MAL, St Clair DA: Evaluation of AFLPs for germplasm fingerprinting and assessment of genetic diversity in cultivars of tomato (Lycopersicon esculentum L.). Genome 2004, 47:510–518.
24. Kenta S, Asamizu E, Fukuoka HA O, Sato S, Nakamura Y, Tabata S, Sasamoto S, Wada T, Kishida Y: An interspecific linkage map of SSR and intronic polymorphism markers in tomato. Theor Appl Genet 2010, 121:731–739. 25. Labate JA, Baldo AM: Tomato SNP discovery by EST mining and
resequencing. Mol Breeding 2005, 16:343–349.
26. Yamamoto N, Tsugane T, Watanabe M, Yano K, Maeda F, Kuwata C, Torki M, Ban Y, Nishimura S, Shibata D: Expressed sequence tags from the laboratory-grown miniature tomato (Lycopersicon esculentum) cultivar Micro-Tom and mining for single nucleotide polymorphisms and inser-tions/deletions in tomato cultivars. Gene 2005, 356:127–134.
27. Kenta S, Sachiko I, Hideki H, Asamizu E, Fukuoka H, Just D, Rothan C, Sasamoto S, Fujishiro T, Kishida Y, Kohara M, Tsuruoka H, Wada T, Nakamura Y, Sato S, Tababata S: SNP discovery and linkage map construction in cultivated tomato. DNA Res 2010, 17:381–391.
28. Van Deynze A, Stoffel K, Buell CR, Kozik A, Liu J, van Der Knaap E, Francis D: Diversity in conserved genes in tomato. BMC Genomics 2007, 8:465. 29. Labate JA, Robertson LD, Wu F, Tanksley SD, Baldo AM: EST, COSII, and
arbitrary gene markers give similar estimates of nucleotide diversity in cultivated tomato (Solanum lycopersicum L.). Theor Appl Genet 2009, 118:1005–1014.
30. Sim SC, Robbins MD, Chilcott C, Zhu T, Francis DM: Oligonucleotide array discovery of polymorphisms in cultivated tomato (Solanum lycopersicum L.) reveals patterns of SNP variation associated with breeding. BMC Genomics 2009, 10:10.
31. Hamilton JP, Sim S, Stoffel K, Van Deynze A, Buell CR, Francis D: Single nucleotide polymorphism discovery in cultivated tomato via sequencing by synthesis. The Plant Genome 2012, 5:17–29.
32. Sim SC, Van Deynze A, Stoffel K, Douches DS, Zarka D, Ganal MW, Chetelat RT, Hutton SF, Scott JW, Gardner RG, Panthee DR, Mutschler M, Myers JR, Francis DM: High-density SNP genotyping of tomato (Solanum lycopersicum L.) reveals patterns of genetic variation due to breeding. PLoS One 2012, 7(9):e45520. 33. Sim SC, Durstewitz G, Plieske J, Wieseke R, Ganal M, Van Deynze A, Hamilton
JP, Buell C, Causse M, Wijeratne S, Francis DM: Development of a large SNP genotyping array and generation of high-density genetic maps in to-mato. Plos One 2012, 7(7):e40563.
34. Cingolani P, Platts A, Coon M, Nguyen T, Wang L, Land SJ, Lu X, Ruden DM: A program for annotating and predicting the effects of single nucleotide polymorphisms, SnpEff: SNPs in the genome of Drosophila melanogaster strain w1118; iso-2; iso-3. Fly 2012, 6:80–92.
35. Yang W, Bai XD, Kabelka E, Eaton C, Kamoun S, van Der Knaap E, Francis D: Discovery of single nucleotide polymorphisms in Lycopersicon esculentum by computer aided analysis of expressed sequence tags. Mol Breeding 2004, 14:21–34.
36. Young ND, Zamir D, Ganal MW, Tanksley SD: Use of isogenic lines and simultaneous probing to identify DNA markers tightly linked to the Tm-2a gene in tomato. Genetics 1988, 120:579–585.
37. Paschold A, Jia Y, Marcon C, Lund S, Larson NB, Yeh CT, Ossowski S, Lanz C, Nettleton D, Schnable P, Hochholdinger F: Complementation contributes to transcriptome complexity in maize (Zea mays L.) hybrids relative to their inbred parents. Genome Res 2012, 22:2445–2454.
38. Davey JW, Hohenlohe PA, Etter PD, Boone JQ, Catchen JM, Blaxter ML: Genome-wide genetic marker discovery and genotyping using next-generation sequencing. Nat Rev Genet 2011, 12:499–510.
39. Rick CM: The role of natural hybridization in the derivation of cultivated tomatoes of western South America. Economic Bot 1958, 12:346–367. 40. Causse M, Saliba-Colombani V, Lecomte L, Duffé P, Rousselle P, Buret M:
Genetic analysis of fruit quality attributes in fresh market tomato. J Exp Bot 2002, 53:2089–2098.
41. Lecomte L, Saliba-Colombani V, Gautier A, Gomez-Jimenez MC, Duffé P, Buret M, Causse M: Fine mapping of QTLs for the fruit architecture and composition in fresh market tomato, on the distal region of the long arm of chromosome 2. Molecular Br 2004, 13:1–14.
42. Muños S, Ranc N, Botton E, Bérard A, Rolland S, Duffé P, Carretero Y, Le Paslier MC, Delalande C, Bouzayen M, Brunel D, Causse M: Increase in tomato locule number is controlled by two key SNP located near Wuschel. Plant Physiol 2011, 4:2244–2254.
43. Cavanagh C, Morell M, Mackay I, Powell W: From mutations to MAGIC: resources for gene discovery, validation and delivery in crop plants. Cur Op Plant Biol 2008, 11:215–221.
44. Xu J, Ranc N, Muños S, Rolland S, Bouchet JP, Desplat N, Le Paslier MC, Liang Y, Brunel D, Causse M: Association mapping for fruit quality traits in cultivated tomato and wild related species. Theor Appl Genet 2013, 126:567–581.
45. Edwards D, Henry RJ, Edwards KJ: Preface: advances in DNA sequencing accelerating plant biotechnology. Plant Biotech J 2012, 10:621–622. 46. Finkers R, Smit S, Peters S, Schijlen E, Van Heusden S, Zhang G: 150 tomato
genome (re-) sequencing project. Neuchatel: 9th Solanaceae conference; 2012. 47. Li H, Durbin R: Fast and accurate short read alignment with
Burrows-Wheeler transform. Bioinformatics 2009, 25(14):1754–1760. 48. Li H, Handsaker B, Wysoker A, Fennell T, Ruan J, Homer N, Marth G,
Abecasis G, Durbin R, Genome Project Data P: The sequence alignment/ Map format and SAMtools. Bioinformatics 2009, 25(16):2078–2079. 49. Koboldt D, Zhang Q, Larson D, Shen D, McLellan M, Lin L, Miller C, Mardis E,
Ding L, Wilson R: VarScan 2: somatic mutation and copy number alteration discovery in cancer by exome sequencing. Genome Res 2012. doi: 10.1101/gr.129684.111.
50. Klambauer G, Schwarzbauer K, Mayr A, Clevert DA, Mitterecker A, Bodenhofer U, Hochreiter S: cn.MOPS: mixture of poissons for discovering copy number variations in next-generation sequencing data with a low false discovery rate. Nucleic Acids Res 2012, 40:e69.
51. Conesa A, Gotz S: Blast2GO: a comprehensive suite for functional analysis in plant genomics. Int J Plant Genomics 2008, 2008:619832.
52. Thorvaldsdóttir H, Robinson JT, Mesirov JP: Integrative genomics viewer (IGV): high-performance genomics data visualization and exploration. Brief Bioinform 2012. doi: 10.1093/bib/bbs017.
doi:10.1186/1471-2164-14-791
Cite this article as: Causse et al.: Whole genome resequencing in tomato reveals variation associated with introgression and breeding events. BMC Genomics 2013 14:791.
Submit your next manuscript to BioMed Central and take full advantage of:
• Convenient online submission
• Thorough peer review
• No space constraints or color figure charges
• Immediate publication on acceptance
• Inclusion in PubMed, CAS, Scopus and Google Scholar
• Research which is freely available for redistribution
Submit your manuscript at www.biomedcentral.com/submit