Original article
Assessment of errors caused by X-ray scatter and use
of contrast medium when using CT-based attenuation
correction in PET
Mohammad Reza Ay, Habib Zaidi
1Division of Nuclear Medicine, Geneva University Hospital 1211 Geneva 4, Switzerland
Received: 27 October 2005 / Accepted: 24 January 2006 / Published online: 19 April 2006 © Springer-Verlag 2006
Abstract. Purpose: Quantitative image reconstruction in positron emission tomography (PET) requires an accurate attenuation map of the object under study for the purpose of attenuation correction. Current dual-modality PET/CT systems offer significant advantages over stand-alone PET, including decreased overall scanning time and increased accuracy in lesion localisation and detectability. However, the contamination of CT data with scattered radiation and misclassification of contrast medium with high-density bone in CT-based attenuation correction (CTAC) are known to generate artefacts in the attenuation map and thus the resulting PET images. The purpose of this work was to quantitatively measure the impact of scattered radiation and contrast medium on the accuracy of CTAC. Methods: Our recently developed MCNP4C-based Monte Carlo X-ray CT simulator for modelling both fan- and cone-beam CT scanners and the Eidolon dedicated 3D PET Monte Carlo simulator were used to generate realigned PET/CT data sets. The impact of X-ray scattered radiation on the accuracy of CTAC was investigated through simulation of a uniform cylindrical water phantom for both a commercial fan-beam multi-slice and a proto-type cone-beam flat panel detector-based CT scanner. The influence of contrast medium was studied by simulation of a cylindrical phantom containing different concentrations of contrast medium. Moreover, an experimental study using an anthropomorphic striatal phantom was conducted for quantitative evaluation of errors arising from the presence of contrast medium by calculating the apparent recovery coefficient (ARC) in the presence of different concentrations of contrast medium.
Results: The analysis of attenuation correction factors (ACFs) for the simulated cylindrical water phantom in both fan- and cone-beam CT scanners showed that the contamination of CT data with scattered radiation in the
absence of scatter removal causes underestimation of the true ACFs, namely by 7.3% and 28.2% in the centre for the two geometries, respectively. The ARC was 190.7% for a cylindrical volume of interest located in the main chamber of the striatal phantom containing contrast medium corresponding to 2,000 Hounsfield units, whereas the ARC was overestimated by less than 5% for
the main chamber and by∼2% for the left/right putamen
and caudate nucleus compared with the absence of contrast medium.
Conclusion: Without X-ray scatter compensation, the visual artefacts and quantitative errors in flat panel detector-based cone-beam geometry are substantial and propagate cupping artefacts to PET images during CTAC. Likewise, contrast-enhanced CT images may create considerable artefacts during CTAC in regions containing high concentrations of contrast medium.
Keywords: PET – X-ray CT – Attenuation correction –
Scattered radiation– Contrast medium
Eur J Nucl Med Mol Imaging (2006) 33:1301–1313 DOI 10.1007/s00259-006-0086-6
Introduction
Diagnosis, monitoring and follow-up in clinical oncology traditionally are based on high-resolution anatomical computed tomography (CT) images. In recent years, functional positron emission tomography (PET) imaging using dedicated radiopharmaceuticals has been recognised as an important imaging modality and adjunct to CT by virtue of its provision of complementary metabolic information. To overcome the challenges of aligning PET and CT images, which are acquired in different conditions, hybrid PET/CT units have been designed and have been
commercially available since 2000 [1]. The PET/CT
scanner combines premier technology from the two imaging modalities, making it possible to obtain both
Habib Zaidi ())
Division of Nuclear Medicine, Geneva University Hospital, 1211 Geneva 4, Switzerland e-mail: [email protected]
Tel.: +41-22-3727258, Fax: +41-22-3727169 D
anatomical and functional information in a single proce-dure. PET/CT systems offer significant advantages over stand-alone PET, including decreased overall scanning time and increased accuracy in lesion localisation and
detectability [2]. However, the use of CT images for
attenuation correction of PET data is known to generate visible artefacts in the resulting PET images in some cases
[3]. Several investigators have tried to characterise
quantitatively the effect of physical and physiological parameters such as oral and intravenous contrast medium
[4–11], metallic implants [12–15] and respiratory motion
[16,17] on the accuracy of CT-based attenuation correction
(CTAC) in PET. Likewise, the contamination of CT data with scattered radiation, which depends on the geometry of the CT scanner and the object under study, reduces
reconstructed CT numbers [18] and introduces cupping
artefacts in the reconstructed images [19]. This effect will
be more pronounced in the next generation of CT scanners with flat panel detector-based cone-beam configurations, which are much less immune to scatter than fan-beam CT
scanners [20]. The magnitude and spatial distribution of
scattered radiation in X-ray CT for both fan- and cone-beam geometries should be accurately quantified for optimisation of scanner design geometry and development
of robust scatter correction techniques [21, 22]. This
problem has been historically addressed by different groups in the context of using CT for quantitative measurements by means of experimental studies, mathe-matical modelling and Monte Carlo simulations for both
fan- [18, 23–27] and cone-beam [20, 21, 28, 29]
geometries. It should be noted that most published papers assessing the distribution of scattered radiation in the fan-beam geometry used either straightforward experimental measurements or in-house developed Monte Carlo simu-lators modelling old CT scanner technologies based on gaseous (xenon) detectors, whereas the characterisation of scattered radiation in current generation CT scanners with accurate modelling of single- and multi-row scintillation detectors technology has been addressed recently by our
group [30]. In addition, to the best of our knowledge,
assessment of the impact of scattered radiation in CT images on the accuracy of CTAC has not been undertaken previously, either in the fan-beam geometry with multi-row detector configuration or in the cone-beam geometry with flat panel detectors. It is worth emphasising that a limited number of studies have addressed the contribution of scattered radiation in radionuclide transmission scans for
stand-alone PET systems [31,32]. It has been shown that
the acceptance of scattered radiation can be minimised by setting lower energy discriminator thresholds owing to the
fact that PET detectors work in pulse mode [33]. Such a
technique is impractical in X-ray CT imaging since the detectors operate in current mode.
Although diagnostic quality CT relies on the adminis-tration of oral or intravenous contrast agents to allow improved lesion delineation, the presence of positive contrast agents in dual-modality PET/CT systems signifi-cantly overestimates the attenuation map in some cases and
may generate artefacts during CTAC [4,5,10,11]. This is
due to the high attenuation coefficient of these materials at the low effective energy of the corresponding X-ray spectra, which results in high CT numbers in the region of contrast agent accumulation through misclassification
with high-density cortical bone [8]. Currently available
algorithms for conversion from CT numbers to linear attenuation coefficients at 511 keV are based on the assumption that image contrast in the CT data is
contributed by mixtures of air, soft tissue and bone [34].
The presence of contrast medium complicates this process since two regions that have the same image contrast may indeed have different compositions, for example contrib-uted by bone and soft tissue in one case and iodine/barium
contrast and soft tissue in another [2]. These artefacts are
most severe in cases where the contrast medium is concentrated, for example in abdominal imaging after the patient swallows a bolus of oral contrast. In this case, the higher densities contributed by the oral contrast medium can lead to overestimation of the PET activity
concentra-tion [3]. The limited number of publications assessing the
impact of contrast medium using phantom studies where the ground truth is known and their limitations in terms of the complexity of simulated shapes, usually restricted to
simple uniform cylindrical phantoms [8,9,11], spurred the
research presented in this paper, where a more realistic anthropomorphic striatal phantom and accurate modelling of contrast medium through Monte Carlo simulations combined with partial volume correction for accurate quantitative analysis were used.
One can account for attenuation differences between iodine and bone by using a technique that generates a calibration curve for contrast media; for this purpose a method is employed that is similar to that referenced above for soft tissue and bone alone, where separate calibration curves are generated for each material (i.e. iodine vs bone) for different X-ray potentials used to acquire CT scans and
for different photon energies [35]. Some investigators have
proposed using image segmentation methods of converting CT numbers to attenuation coefficients that correctly scale
contrast-enhanced CT images for intravenous [35] and oral
[36] agents. In addition, other strategies including the
acquisition of both pre- and post-contrast CT scans can be used to minimise possible artefacts contributed by the presence of contrast media when the CT scan is to be used
as an attenuation map for correction of the PET data [1].
More recently, a segmented contrast correction (SCC)
method was proposed by Nehmeh et al. [8] to correct for
oral contrast medium artefact in CTAC PET images. This method was evaluated using both phantom and clinical studies and proved to accurately recover lesion size and uptake.
The aim of this study was to investigate the impact of X-ray scatter and contrast medium in CT images on the accuracy of CTAC at different levels, including raw data acquisition, attenuation maps, attenuation correction fac-tors (ACFs) and reconstructed PET emission images, using
dedicated X-ray CT [30] and 3D PET [37] Monte Carlo
simulations combined with experimental phantom studies. Both commercially available fan-beam multi-slice and
future generation cone-beam flat panel detector-based CT scanners were considered. For the latter, a hypothetical cone-beam CT mimicking the geometry of a prototype flat
panel detector-based CT scanner [21] adjusted to the
dimensions of large area panel PET detectors under development by CPS Innovations (Knoxville, TN, USA)
[1] for next generation PET/CT systems was simulated.
Moreover, the SCC method discussed above for oral contrast agents was extended and generalised for intrave-nous contrast medium.
Materials and methods
Monte Carlo simulations
The MCNP4C-based Monte Carlo X-ray CT simulator [30] was used for simulation of LightSpeed four-slice CT scanner (GE Healthcare Technologies, Waukesha, WI, USA) and cone-beam panel detector-based CT scanner detector-based on the geometry of a prototype flat panel detector-based CT scanner [21] modified to fit the size of LSO detector modules proposed for a flat panel-based PET scanner [1] for similar axial coverage. Full simulation of X-ray spectra, including tracking the electrons into the X-ray tube target for the calculation of bremsstrahlung and produced characteristic photons, was considered [38]. All photon interaction processes such as photoelectric absorp-tion, incoherent and coherent scatterings as well as full primary and secondary electrons transport were considered during Monte Carlo simulations of X-ray CT since the MCNP4C code was run in E/P (electron and photon) mode. The collimator inside the detector housing (septa) in the LightSpeed scanner was accurately modelled through full photons transport inside the septa plates. It should be noted that antiscatter grids were not considered during simulation of the cone-beam geometry to replicate current prototype flat panel detector-based CT scanners [21]. After simulation of all views, a filtered backprojection reconstruction algorithm was used for image reconstruction of the simulated data sets. Likewise, the Eidolon 3D PET Monte Carlo simulator [37] was used to acquire emission data corresponding to the geometry of the ECAT ART PET scanner (CTI/ Siemens, Knoxville, TN, USA). Experimental and/or clinical validation of the PET and CT simulators has been described elsewhere [30,37,39].
Experimental measurements
A polyethylene cylindrical phantom (250±0.5 mm diameter) contain-ing 16 cylindrical holes (20±0.5 mm diameter) was constructed. Fourteen syringes were filled with a solution of K2HPO4and water
with concentrations varying between 50 mg/cm3and 900 mg/cm3to
simulate cortical bone with different densities. The prepared syringes and two additional syringes containing water and air were inserted into the polyethylene phantom’s holes. Thereafter, the phantom was scanned using the LightSpeed four-slice CT scanner to calculate the calibration curve for conversion from CT numbers to linear attenu-ation coefficients at 511 keVaccording to the method proposed by Bai et al. [34]. The XCOM photon cross-section library [40] was used for calculation of the linear attenuation coefficients of the inserted solutions at 511 keV.
To investigate the effect of contrast medium on CTAC, experimental measurements of the anthropomorphic striatal phantom
(Radiology Support Devices Inc., Long Beach, CA, USA) were performed. This phantom consists of four small cavities that can be filled independently and represent the left and right caudate and left and right putamen. In addition, there is a larger main chamber surrounding the four small cavities representing the rest of the brain. The main chamber itself is embedded in a bone-like structure representing the skull. This arrangement provides properties similar to the human head, suitable for mimicking PET studies of the presynaptic and postsynaptic dopaminergic system. For an activity concentration ratio of 1:8 between the main chamber and small cavities, 2.94 MBq of 18F (in 0.9 ml, 0.9% NaCl) was diluted in distilled water. A total activity of 13.2 MBq18F diluted into 1.1 ml
NaCl was filled into the main chamber. Subsequently, the main chamber was totally filled with distilled water. The fully 3D emission study lasted 25 min whereas the CT data of the same phantom were acquired using the Aquilion CT scanner (Toshiba Medical Systems Corporation, Tokyo, Japan) at 120 kVp and 240 mA.
Attenuation correction and image reconstruction
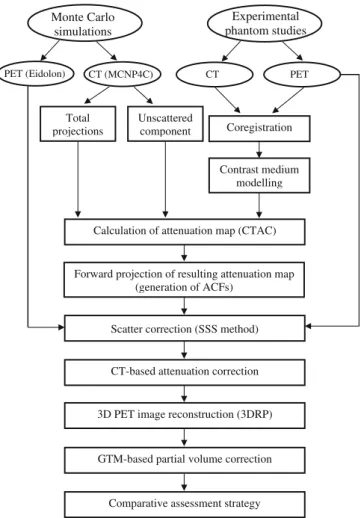
The reconstructed CT images (512×512 matrix size) were down-sampled to 128×128 to match the resolution of PET images followed by Gaussian smoothing using a 6-mm kernel. The calculated bi-linear calibration curve was used to convert CT pixel values in Hounsfield units (HU) to an attenuation map (μmap) at 511 keV. The resulting μmap was forward projected according to the PET scanner geometry to generate ACFs. The ECAT 7.2.1 software was used for attenuation and scatter corrections and reconstruction of the emission data using the 3DRP reprojection algorithm with a maximum acceptance angle corresponding to 17 rings and a span of 7. The default parameters used in clinical routine were applied (ramp filter, cut-off frequency 0.35 cycles/pixel). The reconstructed images consist of 47 slices with 128×128 resolution and a voxel size set to 1.72×1.72×3.4 mm3. Since the PET and CT data used in this study were acquired on separate PET and CT scanners, PET to CT image coregistration was performed using the commercial Hermes multi-modality fusion software (Nuclear Diagnostics AB, Stockholm, Sweden). In order to increase the accuracy of quantitative analysis of reconstructed PET images, correction for partial volume effect was performed using the popular geometric transfer matrix (GTM)-based method proposed by Rousset et al. [41], which allows corrected estimates to be computed without a priori knowledge on any activity level. Figure1shows a flow chart describing the different steps of the study design.
Scattered radiation modelling
To evaluate the impact of scattered radiation on CT images during CTAC in both fan-beam multi-slice and cone-beam panel detector-based CT, a cylindrical water phantom (200 mm diameter) was simulated for both geometries. Likewise, PET data of the same phantom with uniformly distributed activity of18F were simulated using Eidolon. The scatter contribution during the simulation of CT data was separated from the primary component using the surface source method implemented in the MCNP4C Monte Carlo code. In this method, a virtual plane is considered after the scatter medium (water phantom) and the direction, energy and history of each photon passing through this plane have been registered. In the next step, the scatter component is calculated by considering only photons which had at least one interaction before hitting this plane towards the detection system. The unscattered component is calculated using the same method by considering only photons which had no interaction
before hitting the virtual plane. The beam-hardening effect was removed from the projections according to the method described by Kanamori et al. [18] to isolate its effects from scatter. The accuracy of beam-hardening removal was validated by comparing corrected profiles with those simulated using monoenergetic photons with the effective CT energy (72 keV for the LightSpeed CT scanner operated at 120 kVp). The latter was calculated using experimental measurements based on the method proposed by Bai et al. [34]. Scatter correction of the simulated CT data was not performed for either the fan- or the cone-beam geometry to allow the assessment of the impact of X-ray scatter on the accuracy of CTAC in the absence of antiscatter grids and robust scatter correction algorithms. How-ever, the physical scatter rejection components (septa) always present in multi-slice CT scanners were accurately modelled during the simulation. Thereafter, the simulated primary and total (sum of primary and scattered photons) projections were reconstructed using a filtered backprojection algorithm.
To assess the differences between the energy-dependent scatter components when using X-ray CT and radionuclide-based transmis-sion scanning at 511 keV (e.g.68Ga/68Ge), theμmap was generated
for both conditions, i.e. using the polyenergetic X-ray spectra and monoenergetic 511-keV photons as input to the Monte Carlo CT simulator. To avoid the effect of using different imaging geometries and source configurations, the projections were simulated for both energies using the same scanner (LightSpeed CT).
Contrast medium modelling
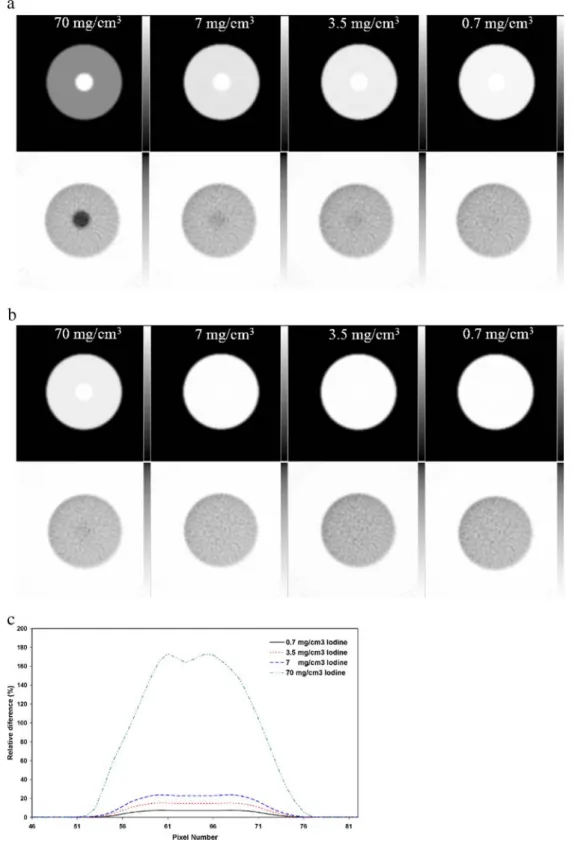
Two experiments were carried out to assess the impact of contrast medium on CTAC. Firstly, CT scans of a cylindrical water phantom (200 mm diameter) containing a centred cylinder (50 mm diameter) filled with different concentrations of iohexol (Omnipaque 350, Nycomed, Princeton, NJ, USA) were simulated. Iodine concentra-tions of 0.7 mg/cm3, 3.5 mg/cm3, 7 mg/cm3and 70 mg/cm3were considered for simulation of contrast agent solution (dilution of 1:500, 1:100, 1:50 and 1:5 of iohexol, respectively). This simple configuration aims to emulate typical concentrations of oral contrast media in the colon in clinical studies. Iohexol contrast media was used as reference to validate simulated CT images by comparison with similar published experimentally measured CT numbers [9] for the chosen concentrations. Thereafter, the reconstructed CT images were used for attenuation correction of the equivalently simulated PET data sets.
In the second experiment, CT images of the anthropomorphic striatal phantom were modified by inserting a cylindrical region (20 mm diameter) in the main chamber to simulate the presence of positive contrast agents with various concentrations corresponding to CT numbers of 50, 100, 200, 500, 1,000, 1,500 and 2,000 HU. This choice was motivated by the consideration that in clinical studies, CT numbers for regions where the contrast medium is concentrated can range from a few HU to the maximum CT number (∼4,000 HU), depending on the contrast medium concentration [8]. Thereafter, the resultant CTAC μmap was calculated and used for attenuation correction of emission data. To correct artefacts caused by contrast media in the modified striatal phantom images, the SCC method originally proposed by Nehmeh et al. [8] for oral contrast agents was extended and generalised to intravenous contrast agents. In this method, the CT numbers of pixels belonging to the region containing contrast medium are substituted with their equivalent effective bone CT numbers since the commonly used bi-linear calibration curve is calculated based on the assumption that positive CT numbers are contributed by a mixture of tissue and bone. The related bi-linear calibration curve was calculated for the Aquilion CT scanner using different concentrations of intravenous contrast agent.
Monte Carlo simulations Unscattered component Experimental phantom studies
PET (Eidolon) CT (MCNP4C) CT PET
Total
projections Coregistration
Contrast medium modelling
Calculation of attenuation map (CTAC)
Forward projection of resulting attenuation map (generation of ACFs)
Scatter correction (SSS method)
CT-based attenuation correction
3D PET image reconstruction (3DRP)
GTM-based partial volume correction
Comparative assessment strategy
Fig. 1. Flow chart illustrating the different steps of the study design used to investigate the impact of X-ray scatter and contrast medium on CTAC in PET using both Monte Carlo simulations and experimental phantom studies
0.E+00 5.E+01 1.E+02 2.E+02 2.E+02 3.E+02 40 140 240 340 440 540 640 740 Detector Number Iscatter
Fig. 2. Simulated scatter profiles for a cylindrical water phantom (200 mm diameter) in both 120 kVp X-ray spectra (dotted line) and monoenergetic 511-keV photons (solid line) using a dedicated Monte Carlo X-ray CT simulator
Results
Impact of scattered radiation
Figure 2shows Monte Carlo simulated scatter profiles for
the cylindrical water phantom (200 mm diameter) calculated for CT (X-ray spectra, 120 kVp) and PET
(511 keV) energies. A total number of 1.9×10⁹ photons
was simulated. The fan-beam angle was adjusted to cover the water phantom in order to increase the simulation efficiency. The magnitude and spatial distribution of the scatter component for the X-ray spectra is quite different from the scatter component at 511 keV owing to the difference in terms of dominations by photoelectric and Compton interactions occurring in different energy ranges, which might preclude application of scatter correction algorithms developed for radionuclide transmission
scan-ning to CT data even with appropriate rescaling [42].
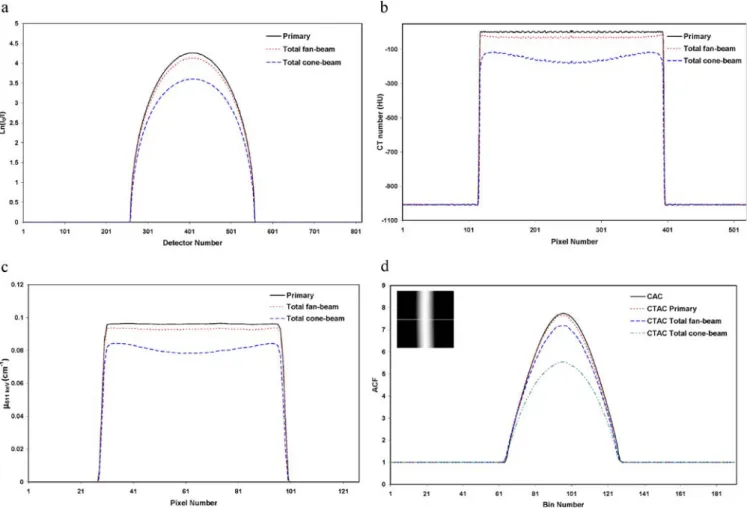
The comparison of simulated attenuation profiles for primary and total projection data of the cylindrical water phantom in both fan- and cone-beam CT geometries is
shown in Fig.3a. It should be noted that the total profile for
the cone-beam CT was taken from the central elements of the flat panel detector for comparison with the fan-beam
geometry. The maximum value for primary and total fan-beam and cone-fan-beam profiles is 4.26, 4.13 and 3.61, respectively. The underestimation of attenuation profiles for the cone-beam geometry is the consequence of a substantial contribution of scattered radiation. The central profile of the corresponding reconstructed CT images is
shown in Fig.3b. The typical cupping artefact apparent on
the reconstructed images for the cone-beam geometry illustrates the important influence of scattered radiation on the quality of reconstructed CT images. It should be noted that the effect of beam hardening was removed from the
profiles before reconstruction [18]. The central profile of
the corresponding CTAC-based μmap of the cylindrical
water phantom at monoenergetic 511-keV photons is
shown in Fig. 3c. The calculated linear attenuation
coefficient in the central region of μmaps created from
the primary, total fan-beam and cone-beam CT images is
0.0958, 0.0926 and 0.0782 cm−1, respectively. The latter
value deviates considerably from the theoretical linear
attenuation coefficient in water at 511 keV (0.096 cm−1).
Figure3d compares central profiles (view 23/47) of ACFs
computed using calculated AC (CAC) based on the theoretical value of the linear attenuation coefficient of
511-keV photons in water and the generatedμmaps using
Fig. 3. Monte Carlo simulations of the cylindrical water phantom (200 mm diameter) in both fan- and cone-beam CT geometries showing: a attenuation profiles of primary and total photons, b central profiles through reconstructed CT images, c central profiles through
attenuation maps at 511 keV generated using the bi-linear transfor-mation method and d central profiles through ACF sinograms calculated from attenuation maps shown in c
CTAC. The maximum ACF in the central part is 7.73, 7.64, 7.18 and 5.55 when using CAC and CTAC primary, total fan-beam and total cone-beam, respectively. This reveals that the contamination of CT data with scattered radiation in the absence of scatter removal causes underestimation of the true ACFs in the centre of the cylindrical phantom by 7.3% and 28.2% for fan-beam and total cone-beam geometries, respectively.
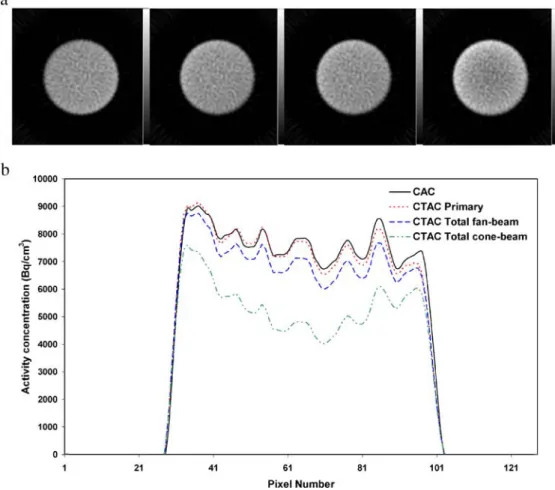
The reconstructed images after attenuation correction of simulated emission data using the ACF sinograms
calculated with different methods are shown in Fig. 4a.
Figure 4b shows central profiles of activity concentration
from the reconstructed images. The average relative difference between the profiles drawn on images recon-structed using the different methods for deriving the CT-based attenuation map and CAC serving as gold standard is 1.58%, 7.98% and 30.18%, respectively.
Impact of contrast medium
As an illustration of the effect of the presence of positive contrast medium in a circular region located at the centre of
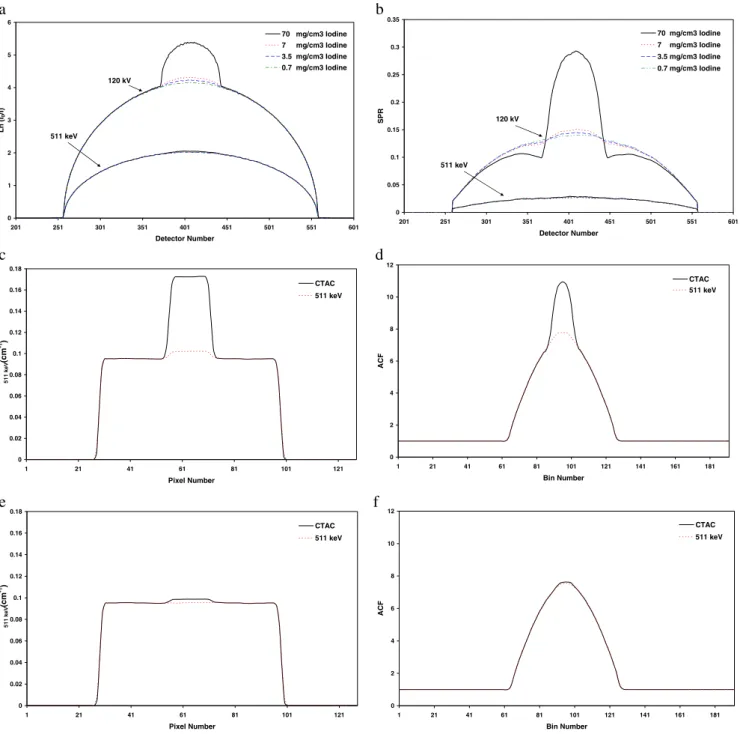
a water-filled cylinder, Figs.5a and5b show Monte Carlo
generated attenuation profiles and scatter to primary ratios (SPR) using different concentrations of contrast medium for both X-ray spectra and 511 keV. The attenuation profiles illustrate the significant difference in photon
attenuation by contrast media between the two energies.
The SPR is a good indicator of the scatter component’s
magnitude in the acquired data. The corresponding central
profiles of the derivedμmaps from reconstructed images
and computed ACFs in both energies and for two extreme
cases of iodine concentration (maximum of 70 mg/cm3and
minimum of 0.7 mg/cm3) are also shown (Fig. 5c–f) to
illustrate the impact of using contrast media on generated μmaps and ACFs. The computed ACF sinograms were used for attenuation correction of simulated emission data.
Figure 6 illustrates the μmaps and corresponding
recon-structed emission images corrected for attenuation using
CTAC (Fig.6a) and 511 keV-based simulations (Fig.6b)
for different concentrations of iodine. The relative percentage difference between central profiles of the PET
images is shown in Fig.6c. As expected, the difference is
increased by increasing the concentration of contrast medium. The simulated attenuation profiles for both energies are further validated by comparing average CT numbers in the contrast region of the uniform cylindrical phantom with published experimentally measured values
[9] and theoretical linear attenuation coefficients computed
using the XCOM photon cross-section library [40] at
511 keV (Table1).
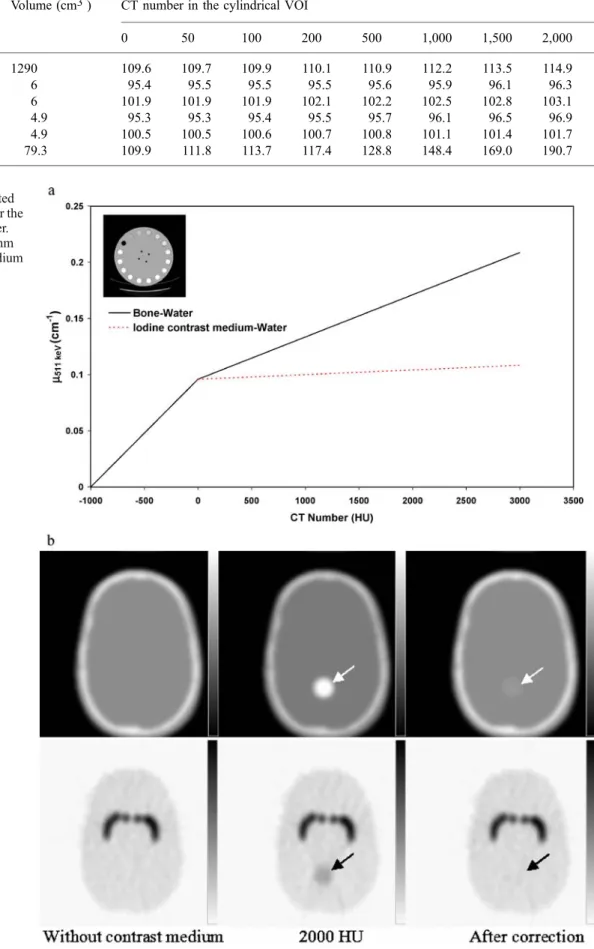
Figure7a showsμmaps resulting from the conversion of
CT images of the RSD striatal phantom modified by inserting positive contrast medium in a cylindrical region (20 mm diameter) in the main chamber containing different
Fig. 4. a Reconstructed images of Monte Carlo simulated emission data corrected for attenuation using, from left to right: CAC, CTAC primary, CTAC total fan-beam and CTAC total cone-beam. b Central profile through images shown in a
concentrations of contrast medium. The corresponding emission data corrected for attenuation using the generated μmaps and reconstructed using a filtered backprojection
algorithm are also shown (Fig.7b). Figure7c illustrates the
overestimation of activity concentration in the region containing contrast medium on horizontal profiles drawn at the level of this region. A more rigorous quantitative measure of the effect of contrast medium is also given in
Table 2, which shows the apparent recovery coefficients
(ARCs) calculated for six different regions in the RSD striatal phantom after partial volume correction using the
GTM-based method [41]. The ARC represents the apparent
(observed or partial volume corrected) regional radioac-tivity concentration to true acradioac-tivity ratio. The segmented contrast correction (SCC) method proposed by Nehmeh et
al. [8] was extended for intravenous contrast medium using
calculated calibration curves for both bone–water and
intravenous contrast medium–water assumptions (Fig.8a).
0 1 2 3 4 5 6 201 251 301 351 401 451 501 551 601 Detector Number Ln ( I0 /I ) 70 mg/cm3 Iodine 7 mg/cm3 Iodine 3.5 mg/cm3 Iodine 0.7 mg/cm3 Iodine 120 kV 511 keV 0 0.05 0.1 0.15 0.2 0.25 0.3 0.35 201 251 301 351 401 451 501 551 601 Detector Number SPR 70 mg/cm3 Iodine 7 mg/cm3 Iodine 3.5 mg/cm3 Iodine 0.7 mg/cm3 Iodine 120 kV 511 keV 0 0.02 0.04 0.06 0.08 0.1 0.12 0.14 0.16 0.18 1 21 41 61 81 101 121 Pixel Number 511 keV (cm -1) CTAC 511 keV 0 2 4 6 8 10 12 1 21 41 61 81 101 121 141 161 181 Bin Number AC F CTAC 511 keV 0 0.02 0.04 0.06 0.08 0.1 0.12 0.14 0.16 0.18 1 21 41 61 81 101 121 Pixel Number 511 keV (cm -1) CTAC 511 keV 0 2 4 6 8 10 12 1 21 41 61 81 101 121 141 161 181 Bin Number ACF CTAC 511 keV a c e f d b
Fig. 5. Monte Carlo study of the impact of contrast medium in a cylindrical water phantom (200 mm diameter) containing a centred cylinder (50 mm diameter) having different concentrations of iohexol for both CT and monoenergetic 511-keV energies showing: a attenuation profiles, b scatter to primary ratios (SPR), and c and d
central profiles through attenuation maps and ACFs for maximum concentration (70 mg/cm3iodine) of contrast medium. e and f are the same as c and d but for minimum concentration (0.7 mg/cm3 iodine) of contrast medium
Thereafter, the SCC algorithm was applied to the μmap corresponding to the maximum concentration of contrast
medium (2,000 HU) (Fig.7a). Figure8b shows theμmaps
and reconstructed images before and after correction using a priori knowledge of the presence of contrast medium. The ARCs after partial volume correction in the region containing contrast medium before and after applying the
SCC algorithm are 190.7% and 115.8%, respectively. It should be noted that the ARC in the same region in the absence of contrast medium is 109.9%, which could be explained in part by neglecting the scatter component during the derivation of calibration curves and application of the CTAC procedure.
Fig. 6. Representative slice of calculated attenuation maps and reconstructed emission images for different concentrations of contrast medium at CT energy (a) and 511-keV monoenergetic photons (b). c Relative per-centage difference between the activity concentrations in the central profile for images corrected using a and b
Discussion
PET/CT has now emerged as an important and
cost-effective method of performing anatomical–functional
correlations in a way that improves patient management. The adoption of this technology has been rapid, and it is anticipated that the next phase of PET/CT will likely combine 3-D PET with volumetric cone-beam CT. This study revealed that the contamination of CT data with
scattered radiation could generate some additional
uncertainties during quantitative analysis of PET images when using CTAC if the CT images are not corrected for
scatter [42]. The magnitude of propagated errors resulting
from the contribution of scatter in CT images depends on the object size and its chemical composition and, more importantly, on the geometry of the CT scanner. The scatter component in the next generation of cone-beam CT scanners based on flat panel detector geometry is signifi-cant and should be addressed to keep technology moving forward. The detailed scatter characterisation made possi-ble through simulation further asserts that the ideal research tool for scatter modelling and evaluation of scatter correction strategies is the Monte Carlo method. The latter approach gives further insight and might offer a possible correction procedure analogous to approaches reported for
PET [39].
The bell shape of the scatter profile at 511 keV (Fig.2)
is due to the fact that the dominant interaction in this energy is Compton forward scattering. The higher value in the centre of the profile is the consequence of increased probability of Compton scattering with increasing attenu-ation length in the central area of the cylindrical water phantom. The two peaks visible on the scatter profile at CT energy are the result of an increase in the transmission probability of scattered photons with decreasing attenua-tion length at the edges of the water phantom. It is worth emphasising that the lower number of scattered photons in the centre of the profile for the CT energy is the result of either photoelectric absorption of incoming photons before undergoing Compton or coherent scattering or their absorption after scattering. Although the amplitude of the
scatter profile for 511 keV is higher, the acceptance of scattered photons in conventional radionuclide transmis-sion scanning can be minimised by setting an appropriate energy discrimination window to reject scattered photons [33].
The underestimation of attenuation profiles for the cone-beam geometry is due to the high contamination of
projection data with scattered radiation (Fig. 3). The
magnitude of this contamination is rather small for the fan-beam geometry owing to the fact that scattered photons are either absorbed in septa plates placed between the detector elements or do not hit the detector elements because of the limited detector aperture in the z-axis (4 cm in multi-slice scanners). The underestimation of attenuation profiles reduces CT numbers in the central area of reconstructed images and creates cupping artefacts. Consequently, cupping artefacts in CT images will result in the under-estimation of linear attenuation coefficients in the central
area ofμmaps generated using CTAC and thus the ACFs to
be used for attenuation correction of the emission data. The underestimation of ACFs will induce underestimation of activity concentration in the central area of PET images
(Fig. 4). In this study, the magnitude of the scatter
component in both commercial multi-slice and prototype flat panel detector geometries was assessed. Moreover, the contribution of scattered radiation during CTAC of PET images was quantified and used to identify correction strategies for better management of deleterious scatter effect, especially for the new generation of flat panel detector-based cone-beam CT scanners that may be combined with future generation panel-based PET scanners
[1] to bring in a new design for large axial field of view
PET/CT.
The effects related to the use of contrast media are likely the same for current PET/CT systems compared with those that would be obtained with volumetric CT imaging chains. Several articles have reported perturbations contributed by
iodinated contrast media in PET/CT studies [4–11].
However, in a realistic clinical setting, these perturbations appear to have a relatively minor impact on diagnostic interpretation. In addition, challenges introduced by the use of contrast media certainly have not impeded the clinical adoption of PET/CT. The impact of the presence of positive contrast agents on the accuracy of CTAC was investigated in both the effective energy of the X-ray tube and monoenergetic 511-keV photons at the level of CT images,
resulting μmaps, ACF sinograms and finally the
recon-structed emission images (Fig.5). The first objective was
reached through Monte Carlo simulations to confirm that the behaviour of contrast medium with respect to photon absorption and scattering is completely different between CT and 511-keV energies. The remaining experiments aimed to study the impact of contrast medium quantita-tively by calculating ARCs in different regions of the RSD striatal phantom corrected for attenuation using CTAC for
different concentrations of contrast medium (Table2). The
difference between attenuation profiles for different
concentrations of contrast medium at CT energy
(120 kVp) and 511 keV is due to the difference between
Table 1. Comparison of average simulated and published measured CT numbers and simulated and theoretical linear attenuation coefficients in both CT (120 kVp) and 511-keV monoenergetic energies Concentration of iodine in solution Measured CT number (HU) [9] Simulated CT number (HU) Theoretical μ511 keV (cm−1) XCOM [40] Simulated μ511 keV (cm−1) MCNP4C 70 mg/cm3 1,445.3 1,434.8 0.1026 0.1028 7 mg/cm3 205.7 193.2 0.0965 0.9677 3.5 mg/cm3 128.2 118.2 0.0962 0.0964 0.7 mg/cm3 65.3 50.2 0.0959 0.0961 0 mg/cm3 9.7 1.3 0.0958 0.0960
the photon interaction cross-sections at these energy ranges
(Fig. 5a). The difference between attenuation profiles
calculated at 511 keV for different concentrations of contrast medium is insignificant whereas there is a significant difference between attenuation profiles calcu-lated at CT energy. The high value of SPR in the region
containing contrast medium at CT energy (Fig.5b) is due to
the high absorption of primary photons by the contrast
medium since the scatter distribution is approximately uniform. The curvature of SPR at 511 keV is due to the variable transmission probability of primary photons, which depends on the angle-dependent pathlength of attenuating media. It should be noted that the presence of contrast medium in the central area of the phantom has a negligible impact on the SPR profile at 511 keV while its effect is significant at CT energy. The difference between
Fig. 7. a Calculated attenuation map following modification of the striatal phantom by insertion of a cylindrical area containing different concentrations of con-trast medium. b Reconstructed PET emission images of the same phantom. c Horizontal profiles through PET images shown in b at the level of the circular region concentrating contrast medium
Fig. 8. a Plot of the calculated bi-linear calibration curve for the Toshiba Aquilion CT scanner. b Validation of SCC algorithm for intravenous contrast medium
Table 2. Apparent recovery coefficients (ARCs) for different volumes of interest (VOIs) after partial volume effect correction in the modified RSD anthropomorphic striatal phantom following insertion of a cylindrical VOI containing contrast medium in CT images
VOI Volume (cm3) CT number in the cylindrical VOI
0 50 100 200 500 1,000 1,500 2,000
Main chamber 1290 109.6 109.7 109.9 110.1 110.9 112.2 113.5 114.9
Left putamen 6 95.4 95.5 95.5 95.5 95.6 95.9 96.1 96.3
Right putamen 6 101.9 101.9 101.9 102.1 102.2 102.5 102.8 103.1
Left caudate nucleus 4.9 95.3 95.3 95.4 95.5 95.7 96.1 96.5 96.9
Right caudate nucleus 4.9 100.5 100.5 100.6 100.7 100.8 101.1 101.4 101.7
μmaps and ACF sinograms generated using simulated CT
images at CT energy and 511 keV (Fig.5c–f) for minimum
(0.7 mg/cm3 iodine) and maximum (70 mg/cm3 iodine)
concentrations of contrast medium is a nice illustration of extreme imaging conditions and the propagation of errors in attenuation correction factors to the emission data during
attenuation compensation (Fig. 6). The overestimation of
activity concentration in the central area of PET images
corrected usingμmaps derived at CT energies (Fig.6a) is
due to overestimation of ACFs in the related region whereas the effect of contrast medium at 511 keV is
negligible (Fig.6b), even with the highest concentration of
iodine (70 mg/cm3). The same observations were made
using the RSD striatal phantom’s data corrected for
attenuation using CTAC for different concentrations of
contrast medium in a cylindrical region (Fig. 7). The
overestimation of activity in the cylindrical region is significant when using a high concentration of contrast medium (90% for 2,000 HU). However, it produces a negligible effect on the remotely located brain regions, namely less than 2% for the small regions (left putamen, right putamen, left caudate nucleus, right caudate nucleus)
and 6% in the main chamber (Table 2).
The SCC algorithm proposed by Nehmeh et al. [8] for
correction of oral contrast agents was extended for intravenous contrast agents using suitable calibration
curves calculated for related materials (Fig. 8a). In this
approach, the CT numbers of pixels belonging to the contrast medium region are substituted with their
equiva-lent effective bone CT numbers (Fig. 8b). The SCC
algorithm is efficient but still limited to simple shapes reflecting the spatial distribution of contrast medium. For wider applicability, the algorithm needs to be improved by developing an automatic segmentation algorithm for classification of irregular shapes of regions containing contrast medium usually found in clinical studies.
Consistent with other studies, it was observed that the presence of contrast medium (oral or intravenous) in CT images can be misclassified with high bone density and can
result in building an incorrectμmap [3]. Subsequently, this
misclassification and overestimation of attenuation coeffi-cients results in overestimation of the activity concentration in the region containing a high concentration of contrast medium. The issue of whether the use of contrast medium in dual-modality PET/CT scanning produces medically significant artefacts is still controversial, with some studies
corroborating [5,6,10,11] and others contradicting [8,9,
43] the fact that the presence of contrast medium can be a
source of errors and artefacts when the CT data are used for attenuation correction of PET images. The quantification of a lower concentration threshold below which the use of contrast medium is risk free proved to be a difficult task. The optimal quantity and route of administration of contrast medium and potential correction schemes are still open questions which require further research and development efforts.
Conclusion
The impact of contrast medium and X-ray scatter in CT images on the accuracy of CTAC in PET was studied using Monte Carlo simulations combined with experimental phantom studies. The latter aspect has not been addressed previously to the best of our knowledge. The contribution of X-ray scatter during the CTAC procedure was quantified for commercially available fan-beam multi-slice CT and prototype large area flat panel detector-based cone-beam CT scanners. The magnitude of scatter in CT images for the cone-beam geometry is significant and might create cupping artefacts in reconstructed PET images during CTAC; while its effect is small for current generation multi-slice fan-beam CT scanners using septa between detector elements, it should preferably be corrected during CT reconstruction to avoid quantification bias. These results substantiate the important role of antiscatter colli-mation and robust scatter correction algorithms which certainly will be implemented in future generation flat panel-based PET/CT scanners when used for quantitative measurements. Contrast-enhanced CT images may create visible artefacts in regions containing high concentrations of contrast medium. This study reports results from a limited set of computer simulations of realistic PET and CT systems combined with experimental measurements using validated techniques. Further research using experimen-tally measured whole-body dynamic anthropomorphic phantoms on operational PET/CT systems (64-slice CT) to be installed in our department with a broader range of contrast medium concentrations, as well as more realistic geometries and sizes of the opacified structures represen-tative of those imaged in clinical settings, is guaranteed.
Acknowledgements. This work was supported by the Swiss National Science Foundation under grant SNSF 3152A0–102143. The authors would like to thank Dr. O.G. Rousset for providing the PVC software and F. Schoenahl, T. Ruest and N. Andreini, for their valuable support.
References
1. Townsend DW, Carney JPJ, Yap JT, Hall NC. PET/CT today and tomorrow. J Nucl Med 2004;45:4s–14s
2. Hasegawa BH, Zaidi H. Dual-modality imaging: more than the some of its components. In: Zaidi H, editor. Quantitative analysis in nuclear medicine imaging. Berlin Heidelberg New York: Springer; 2005; p. 35–81
3. Zaidi H, Hasegawa BH. Determination of the attenuation map in emission tomography. J Nucl Med 2003;44:291–315 4. Antoch G, Freudenberg LS, Stattaus J, Jentzen W, Mueller SP,
Debatin JF, et al. Whole-body positron emission tomography-CT: optimized CT using oral and IV contrast materials. AJR Am J Roentgenol 2002;179:1555–1560
5. Antoch G, Freudenberg LS, Beyer T, Bockisch A, Debatin JF. To enhance or not enhance?18F-FDG and CT contrast agents in dual-modality18F-FDG PET/CT. J Nucl Med 2004;45:56S–95S
6. Antoch G, Kuehl H, Kanja J, Lauenstein TC, Schneemann H, Hauth E, et al. Dual-modality PET/CT scanning with negative oral contrast agent to avoid artifacts: introduction and evaluation. Radiology 2004;230:879–885
7. Dizendorf EV, Treyer V, Von Schulthess GK, Hany TF. Application of oral contrast media in coregistered positron emission tomograhy-CT. AJR 2002;179:477–481
8. Nehmeh SA, Erdi YE, Kalaigian H, Kolbert KS, Pan T, Yeung H, et al. Correction for oral contrast artifacts in CT attenuation-corrected PET images obtained by combined PET/CT. J Nucl Med 2003;44:1940–1944
9. Nakamoto Y, Chin BB, Kraitchman DL, Lawler LP, Marshall LT, Wahl RL. Effects of nonionic intravenous contrast agents in PET/CT imaging: phantom and canine studies. Radiology 2003;227:817–824
10. Yau Y-Y, Chan W-S, Tam Y-M, Vernon P, Wong S, Coel M, et al. Application of intravenous contrast in PET/CT: does it really introduce significant attenuation correction error? J Nucl Med 2005;46:283–291
11. Dizendorf E, Hany TF, Buck A, von Schulthess GK, Burger Cl. Cause and magnitude of the error induced by oral CT contrast agent in CT-based attenuation correction of PET emission studies. J Nucl Med 2003;44:732–738
12. DiFilippo FP, Brunken RC. Do implanted pacemaker leads and ICD leads cause metal-related artifact in cardiac PET/CT? J Nucl Med 2005;46:436–443
13. Goerres GW, Hany TF, Kamel E, von Schulthess GK, Buck A. Head and neck imaging with PET and PET/CT: artefacts from dental metallic implants. Eur J Nucl Med Mol Imaging 2002;29:367–370
14. Goerres GW, Ziegler SI, Burger C, Berthold T, Von Schulthess GK, Buck A. Artifacts at PET and PET/CT caused by metallic hip prosthetic material. Radiology 2003;226:577–584 15. Kamel E, Burger C, Buck A, Von Schulthess GK, Goerres G.
Impact of metallic dental implants on CT-based attenuation correction in a combined PET/CT scanner. Eur Radiol 2003;13:724–728
16. Goerres GW, Burger C, Kamel E, Seifert B, Kaim AH, Buck A, et al. Respiration-induced attenuation artifact at PET/CT: technical considerations. Radiology 2003;226:906–910 17. Osman MM, Cohade C, Nakamoto Y, Wahl RL. Respiratory
motion artifacts on PET emission images obtained using CT attenuation correction on PET-CT. Eur J Nucl Med Mol Imaging 2003;30:603–606
18. Kanamori H, Nakamori N, Inoue K, Takenaka E. Effect of scattered x-ray on CT images. Phys Med Biol 1985;30:239–249 19. Colijn AP, Beekman FJ. Accelerated simulation of cone beam X-ray scatter projections. IEEE Trans Med Imaging 2004;23:584–590
20. Siewerdsen JH, Jaffray DA. Cone-beam computed tomography with flat-panel imager: magnitude and effects of x-ray scatter. Med Phys 2001;28:220–231
21. Ning R, Tang X. X-ray scatter correction algorithm for cone beam CT imaging. Med Phys 2004;31:1195–1202
22. Ohnesorge B, Flohr T, Klingenbeck-Regn K. Efficient object scatter correction algorithm for third and fourth generation CT scanners. Eur Radiol 1999;9:563–569
23. Tofts PS, Gore JC. Some sources of artefact in computed tomography. Phys Med Biol 1980;25:117–127
24. Glover GH. Compton scatter effects in CT reconstructions. Med Phys 1982;9:860–867
25. Johns PC, Yaffe M. Scattered radiation in fan beam imaging systems. Med Phys 1982;9:231–239
26. Joseph PM, Spital RD. The effects of scatter in x-ray computed tomography. Med Phys 1982;9:464–472
27. Merritt RB, Chenery SG. Quantitative CT measurements: the effect of scatter acceptance and filter characteristics on the EMI 7070. Phys Med Biol 1986;31:55–63
28. Endo M, Tsunoo T, Nakamori N, Yoshida K. Effect of scatter radiation on image noise in cone beam CT. Med Phys 2001; 28:469–474
29. Malusek A, Seger MM, Sandborg M, Alm Carlsson G. Effect of scatter on reconstructed image quality in cone beam computed tomography: evaluation of a scatter-reduction optimisation function. Radiat Prot Dosimetry 2005;114:337–340
30. Ay MR, Zaidi H. Development and validation of MCNP4C-based Monte Carlo simulator for fan- and cone-beam x-ray CT. Phys Med Biol 2005;50:4863–885
31. Digby WM, Hoffman EJ. An investigation of scatter in attenuation correction for PET. IEEE Trans Nucl Sci 1989;36:1038–1042
32. Wegmann K, Adam L-E, Livieratos L, Zaers J, Bailey DL, Brix G. Investigation of the scatter contribution in single photon transmission measurements by means of Monte Carlo simula-tions. IEEE Trans Nucl Sci 1999;46:1184–1190
33. Dahlbom M, Hoffman E. Problems in signal-to-noise ratio for attenuation correction in high resolution PET. IEEE Trans Nucl Sci 1987;34:288–293
34. Bai C, Shao L, Da Silva AJ, Zhao Z. A generalized model for the conversion from CT numbers to linear attenuation coefficients. IEEE Trans Nucl Sci 2003;50:1510–1515 35. Tang HR, Brown JK, Da Silva AJ, Matthay KK, Price DC,
Huberty JP, et al. Implementation of a combined X-ray CT-scintillation camera imaging system for localizing and measur-ing radionuclide uptake: experiments in phantoms and patients. IEEE Trans Nucl Sci 1999;46:551–557
36. Carney J, Beyer T, Brasse D, Yap JT, Townsend DW. CT-based attenuation correction for PET/CT scanners in the presence of contrast agent. IEEE Nucl Sc Symp Conf Rec 2002;3:1443–1446 37. Zaidi H, Scheurer AH, Morel C. An object-oriented Monte Carlo simulator for 3D cylindrical positron tomographs. Comput Methods Programs Biomed 1999;58:133–145 38. Ay M, Shahriari M, Sarkar S, Adib M, Zaidi H. Monte Carlo
simulation of x-ray spectra in diagnostic radiology and mammography using MCNP4C. Phys Med Biol 2004;49: 4897–4917
39. Zaidi H. Comparative evaluation of scatter correction techniques in 3D positron emission tomography. Eur J Nucl Med 2000; 27:1813–1826
40. Berger MJ, Hubbell JH, Seltzer SM, Chang J, Coursey JS, Sukumar R, et al. XCOM: photon cross sections database. NBSIR 87–3597. 1998; http://physics.nist.gov/PhysRefData/ Xcom/Text/XCOM.html
41. Rousset OG, Ma Y, Evans AC. Correction for partial volume effects in PET: principle and validation. J Nucl Med 1998; 39:904–911
42. Zaidi H, Koral KF. Satter modelling and compensation in emission tomography. Eur J Nucl Med 2004;31:761–782 43. Berthelsen AK, Holm S, Loft A, Klausen TL, Andersen F,
Hojgaard L. PET/CT with intravenous contrast can be used for PET attenuation correction in cancer patients. Eur J Nucl Med Mol Imaging 2005;32:1167–1175