HAL Id: hal-01801981
https://hal.archives-ouvertes.fr/hal-01801981
Submitted on 28 May 2018
HAL is a multi-disciplinary open access
archive for the deposit and dissemination of sci-entific research documents, whether they are pub-lished or not. The documents may come from teaching and research institutions in France or abroad, or from public or private research centers.
L’archive ouverte pluridisciplinaire HAL, est destinée au dépôt et à la diffusion de documents scientifiques de niveau recherche, publiés ou non, émanant des établissements d’enseignement et de recherche français ou étrangers, des laboratoires publics ou privés.
Valérie Allasia, Benoit Industri, Michel Ponchet, Michaël Quentin, Bruno
Favery, Harald Keller
To cite this version:
Valérie Allasia, Benoit Industri, Michel Ponchet, Michaël Quentin, Bruno Favery, et al.. Quantification of salicylic acid (SA) and SA-glucosides in Arabidopsis thaliana. Bio-protocol , Bio-protocol LCC, 2018, 8 (10), pp.1-8. �10.21769/BioProtoc.2844�. �hal-01801981�
Quantification of Salicylic Acid (SA) and SA-glucosides in Arabidopsis thaliana
Valérie Allasia, Benoit Industri, Michel Ponchet, Michaël Quentin, Bruno Favery* and Harald Keller*
INRA, Université Côte d’Azur, CNRS, Institut Sophia Agrobiotech, Sophia-Antipolis, France *For correspondence: bruno.favery@inra.fr; harald.keller@inra.fr
[Abstract] Homeostasis between the cytoplasmic plant hormone salicylic acid (SA) and its’ inactive,
vacuolar storage forms, SA-2-O-β-D-glucoside (SAG) and SA-β-D-Glucose Ester (SGE), regulates the fine-tuning of defense responses to biotrophic pathogens in Arabidopsis thaliana. This protocol describes a simplified, optimized procedure to extract and quantify free SA and total hydrolyzable SA in plant tissues using a classical HPLC-based method.
Keywords: Salicylic acid, SA-glucoside, Defense hormone, Arabidopsis thaliana, HPLC
[Background] SA (2-hydroxybenzoic acid) is a plant hormone, which is synthesized in the chloroplast
in response to pathogen attack. It is then exported to the cytoplasm, where it establishes both local and systemic-acquired resistance (SAR). In a generalized scheme, plant resistance to biotrophic pathogens is thought to be mediated through SA signaling, whereas resistance to necrotrophic pathogens is controlled by jasmonic acid (JA) and ethylene (ET). SA and JA/ET signaling pathways interact antagonistically. SA accumulation to high concentrations is toxic and leads to cell- and tissue damage. Most pathogen-induced SA is thus glycosylated by UDP-glucosyltransferases (UGTs) to form hydrophilic, non-toxic SAG and SGE (Noutoshi et al., 2012; George Thompson et al., 2017). SAG and SGE are then sequestered in vacuoles, where they form reusable sources for hydrolysis to active SA. Increasing amounts of total SA (SA + SAG/SGE) in plant tissues thus reflect SA synthesis as a response to biotrophic pathogen attack. However, the amplitude of defense responses in infected plant tissues is determined by the amount of available cytoplasmic, unconjugated SA. To evaluate both the onset of SA-dependent defense responses and their amplitude, it is essential to quantify free and conjugated SA, respectively. This article describes a method for measuring conjugated and unconjugated SA levels in phase-partitioned extracts from A. thaliana seedlings. It is based on a protocol established for SA analysis in cucumber leaves (Meuwly and Métraux, 1993), which we optimized and downscaled for convenient, routine use.
Materials and Reagents
1. Pipette tips 2. Nitrile gloves
3. Microcentrifuge tubes (2 ml) (e.g., Thermo Fisher Scientific, Thermo ScientificTM, catalog
number: 69720)
Manufacturer: Sorenson Bioscience, catalog number: 11870.
6. Glass wool (e.g., Sigma-Aldrich, catalog number: 18421)
7. Ten-day-old Arabidopsis thaliana seedlings (e.g., different genetic wild-type or mutant backgrounds, inoculated with pathogen or otherwise treated)
8. Liquid nitrogen
9. Ethanol (EtOH; e.g., Sigma-Aldrich, catalog number: 24103) 10. 70% aqueous EtOH (v/v)
11. Methanol HPLC grade (MeOH; e.g., CARLO ERBA Reagents, catalog number: 412383) 12. 90% aqueous MeOH (v/v)
13. Trichloracetic acid (TCA; e.g., Sigma-Aldrich, catalog number: T9159) 14. 20% aqueous TCA (w/v)
15. Ethyl acetate, analytical grade (e.g., CARLO ERBA Reagents, catalog number: 448256) 16. Cyclohexane, analytical grade (e.g., CARLO ERBA Reagents, catalog number: 436903) 17. A mixture of ethyl acetate and cyclohexane (1:1, v:v)
18. Trifluoracetic acid (TFA; e.g., Sigma-Aldrich, catalog number: T62200) 19. 10% aqueous MeOH (v/v) with 0.1% TFA (v/v)
20. 82% aqueous MeOH (v/v) with 0.1% TFA (v/v)
21. Concentrated hydrochloric acid (HCl; 37%, 12 M; e.g., Sigma-Aldrich, catalog number: 30721) 22. Ultra-pure water
23. 2-Methoxybenzoic acid, o-Anisic acid (OAA; e.g., Sigma-Aldrich, catalog number: 169978) 24. Sodium salicylate (e.g., Sigma-Aldrich, catalog number: S3007)
25. o-Anisic acid 50x stock solution (see Recipes)
Equipment
1. Micropipettes (e.g., Gilson, model: P2, P20, P200, P1000) 2. Mortar (40 ml content) with pestle
3. Fume hood
4. Water purification system (Merck, EMD Millipore, catalog number: SYNS0HFWW) 5. Vortex (e.g., IKA, model: MS 1 minishaker)
6. Dry bath heating block for 2 ml microcentrifuge tubes (e.g., Major Science, model: EL-02) 7. Vacuum concentrator (e.g., Thermo Fisher Scientific, Thermo ScientificTM, model: Savant
SpeedVac Concentrator)
8. Vacuum pump (e.g., BÜCHI Labortechnik, model: V-300)
9. Microcentrifuge (e.g., Eppendorf, model: 5415 D with Rotor: Eppendorf, model: F45-24-11) 10. C18 HPLC column (e.g., Inertsil 5 ODS3, 5 µm, 250 x 4.6 mm i.d., Interchim, France) (GL
Sciences, model:Inertsil® ODS3)
2 solvent delivery units (Shimadzu Scientific, model: LC-20AD) A system controller (Shimadzu Scientific, model: CBM-20A) An autosampler (Shimadzu Scientific, model: SIL-20AC) A column oven (Shimadzu Scientific, model: CTO-20A)
A diode array detector (Shimadzu Scientific, model: SPD-M20A) A fluorescence detector (Shimadzu Scientific, model: RF-10AXL)
Software
1. Chromatography data system software (e.g., WATERS, Empower 3 Pro Chromatography Data Software)
2. Microsoft Excel
Procedure
A. Sample preparation
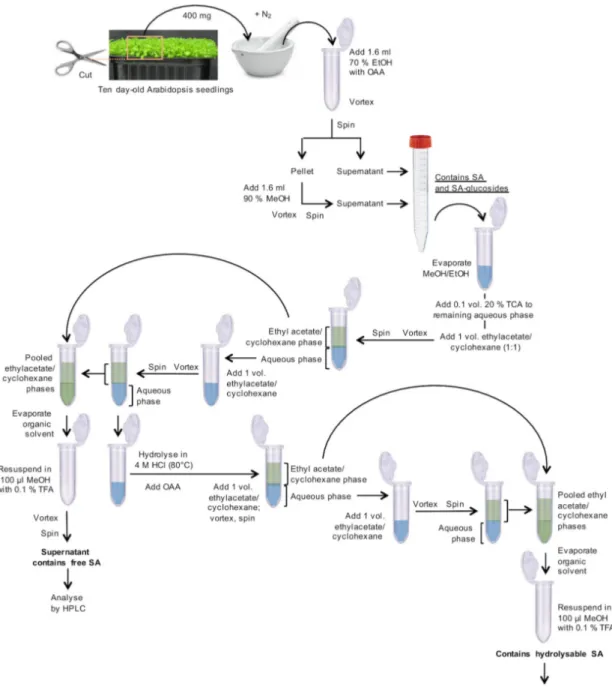
1. Harvest and weigh 10 day-old Arabidopsis plantlets with fully developed cotyledons, leaf primordia, and hypocotyls, as shown in Figure 1. Transfer 400 mg fresh material (corresponding to ~250 plantlets) to a mortar, which was pre-cooled with liquid nitrogen, and grind to a fine powder under liquid nitrogen. Transfer this powder to a 2 ml microcentrifuge tube. Add 1.6 ml of 70% aqueous EtOH (v/v) and 32 µl o-anisic acid (OAA) stock solution (15.25 ng/µl; Figure 1).
Figure 1. Flowchart for the preparation of SA-containing samples
2. Vortex for 1 min.
3. Centrifuge in a microcentrifuge for 10 min at 10,000 x g at room temperature. 4. Transfer supernatant to a 15 ml centrifuge tube.
5. From now on, use a fume hood. Add 1.6 ml of 90% aqueous MeOH (v/v) to the remaining pellet. 6. Vortex for 1 min for re-extraction.
7. Centrifuge in a microcentrifuge for 10 min at 10,000 x g at room temperature.
8. Add this supernatant to the previous supernatant in the 15 ml centrifuge tube from Step A4. 9. The pooled, clear supernatants contain free SA and SA-glucosides (Figure 1).
B. Extraction of free SA
1. Transfer 2 ml of the cleared supernatants to 2 ml microcentrifuge tubes (Figure 1).
2. Evaporate alcohol (EtOH and MeOH) in a vacuum concentrator (without heating) for ~1.5 h. 3. Transfer the remaining supernatant from the 15 ml centrifuge tube to the same 2 ml tube as
used in Step A1.
4. Continue evaporating the alcohol (EtOH and MeOH) in the vacuum concentrator for ~1.5 h. 5. To the remaining aqueous solution (~600 µl) in the 2 ml microcentrifuge tube, add 65 µl of 20%
aqueous TCA (w/v).
6. Add 650 µl of a 1:1 (v/v) mixture of ethyl acetate and cyclohexane. 7. Vortex for 30 sec.
8. Centrifuge in a microcentrifuge for 2 min at 10,000 x g at room temperature for phase separation. 9. Transfer the upper organic phase to a new 2 ml microcentrifuge tube.
10. Re-extract the aqueous phase with 650 µl of the ethyl acetate-cyclohexane mixture.
11. Centrifuge in a microcentrifuge for 2 min at 10,000 x g at room temperature for phase separation. 12. Pool the organic phases in the new 2 ml centrifuge tube. They contain free, unconjugated SA.
Store the aqueous phase for the treatment of SA-glucosides at 4 °C.
13. Evaporate the solvents to dryness in a vacuum concentrator for ~30-45 min.
14. Solubilize the dry residue in 100 µl of 10% aqueous MeOH (v/v) containing 0.1% aqueous TFA (v/v), vortex for 1 min. This fraction is ready for HPLC analysis (= free, unconjugated SA) (Figure 1).
C. Extraction of hydrolyzable SA
1. To the aqueous phase (B12; ~0.6 ml), add 0.5 volumes (~0.3 ml) of HCl (37%, 12 M) to obtain a final HCl concentration of 4 M (Figure 1).
2. Secure the tubes with microcentrifuge tube locks and heat them for 1 h at 80 °C in a dry bath heating block. Let cool down to room temperature for 20 min.
3. Add 0.02 volumes (18 µl) of 50x OAA stock solution.
4. Add 1 volume (0.9 ml) of the 1:1 ethyl acetate–cyclohexane (v/v) mixture. 5. Vortex for 30 sec.
6. Centrifuge in a microcentrifuge for 2 min at 10,000 x g at room temperature for phase separation. 7. Transfer the upper phase to a new 2 ml microcentrifuge tube.
8. Re-extract the aqueous phase with 1 volume (0.9 ml) of the 1:1 (v/v) mixture of ethyl acetate and cyclohexane.
9. Centrifuge in a microcentrifuge for 2 min at 10,000 x g at room temperature for phase separation. 10. Pool the organic phases in the 2 ml centrifuge tube. They contain SA, which results from the
acidic hydrolysis of SA-conjugates.
(v/v), vortex for 1 min. This fraction is ready for HPLC analysis (= total hydrolyzable SA) (Figure 1).
D. SA quantification by HPLC
1. Separations by HPLC are performed on a C18 column (250 x 4.6 mm, 5 µm) using a linear aqueous MeOH gradient from 10% to 82% (v/v), at a flow rate of 1 ml/min, over 30.4 min. Solvents contain 0.1% TFA (v/v) to maintain the protonated form of carboxylic acids. The column is maintained in an oven set at 30 °C. Eluates pass first the diode array detector, then the fluorescence detector.
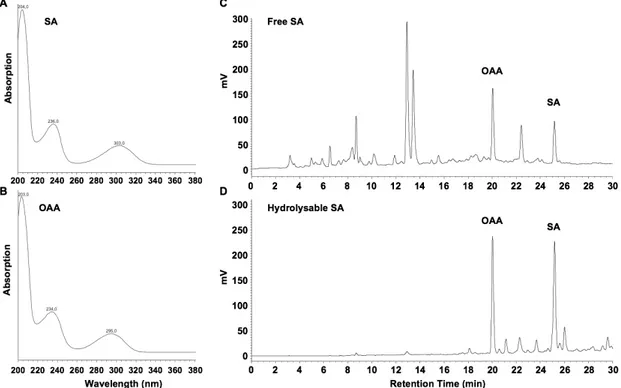
2. Inject 20 µl samples (B14 and C12) into the HPLC system. SA elutes at 25 min, OAA at 20 min. Determine the presence of SA and the internal standard with peak validation according to typical UV spectra (Figures 2A and 2B). Quantify with fluorimetric detection (excitation at 305 nm; emission at 407 nm) and determine areas under the corresponding peaks (Figures 2C and 2D). 3. Using the peak area, apply the standard curve and linear equation to determine the amount (ng)
of SA and of OAA in the injected 20 µl. Determine the correction factor by comparing the theoretic amounts of OAA in the samples with the experimentally measured ones. Multiply the measured SA amounts with this correction factor, calculate SA amounts (before and after hydrolysis), and express them as ng (SA and SAG/SGE, respectively; Note 5) per gram of cotyledon fresh weight as shown by Quentin et al. (2016).
Figure 2. UV spectra for SA (A) and OAA (B), and chromatograms of fluorescence-detected free SA (C) and SA-hydrolysates (D) in extracts from Arabidopsis seedlings, four days after inoculation with the Hyaloperonospora arabidopsidis isolate Waco 9
E. Calibration curves for SA and OAA
1. Prepare five solutions containing SA and OAA at different concentrations, ranging from 0.1 µg/ml to 5 µg/ml in 10% aqueous MeOH (v/v) containing 0.1% TFA (v/v).
2. Inject 20 µl from each preparation, run the linear gradient and detect as described in Step D1. Repeat two times.
3. Using the chromatography data system software, integrate the area under the peaks at 20 min (OAA) and 25 min (SA) for every concentration. Plot a graph of peak area versus ng of injected SA and OAA. Calculate the equation of the trend line using linear regression analysis (R2 must
be > 0.98).
Data analysis
1. At least three biological replicates should be used for the quantification of free and total hydrolyzable SA.
2. Statistical analysis should be performed by calculating means and standard deviations across these replicates. The significance of differences between two samples (different Arabidopsis genotypes or different treatments) might be estimated with the non-parametric Kruskal-Wallis test by ranks. Analyses can be performed with Microsoft Excel or comparable software.
Notes
1. Optional step after Step A8: If the pooled supernatants contain visible cellular debris, remove them by filtering through home-made glass wool-filled 1 ml pipet tips.
2. Vacuum concentrator and vacuum pump should be used in a fume hood or in appropriate areas, when evaporating organic solvents.
3. Fluorimetric detection with excitation at 305 nm and emission at 407 nm is optimal for SA, but not for OAA, which has maximum emission at 365 nm when excited at 305 nm. However, OAA gives quantifiable peaks at 407 nm (Figures 2C and 2D).
4. In our HPLC set-up, eluates pass the diode array detector first and then the fluorescence detector. This leads to a lag of ~0.1 min for fluorescence detection, when compared to UV detection.
5. It is established that SAG and SGE represent the large majority of stress-induced SA conjugates in wild-type Arabidopsis (Zhao et al., 2017). However, when transposing the protocol to other plants, or to Arabidopsis lines harboring mutations and transgenes that affect the plant secondary metabolism, SAG and SGE must first be confirmed as main SA conjugates. This might be achieved by enzymatic cleavage of SAG and SGE with β-glucosidase and short chain esterase, respectively (Enyedi et al., 1992). Obtaining comparable recovery of SA from double enzymatic digestion and acid hydrolysis is a prerequisite to express results as the amount of SA released from SAG + SGE.
1. 2-Methoxybenzoic acid (o-Anisic acid, OAA; internal standard) stock solution (50x, 0.1 µM) Dissolve 152 mg OAA in 10 ml 70% aqueous EtOH (v/v) and dilute 1:1,000 in ultra-pure water
Acknowledgments
This protocol was modified from previously published works (Meuwly and Métraux, 1993; Quentin
et al., 2016). The work was supported by the French Government (National Research Agency, ANR)
through the ‘Investments for the Future’ LABEX SIGNALIFE [program reference #ANR-11-LABX-0028-01]. The authors declare no conflicts of interest or competing interests.
References
1. Enyedi, A. J., Yalpani, N., Silverman, P. and Raskin, I. (1992). Localization, conjugation, and function of salicylic acid in tobacco during the hypersensitive reaction to tobacco mosaic virus.
Proc Natl Acad Sci U S A 89: 2480-2484.
2. George Thompson, A. M., Iancu, C. V., Neet, K. E., Dean, J. V. and Choe, J. Y. (2017). Differences in salicylic acid glucose conjugations by UGT74F1 and UGT74F2 from Arabidopsis
thaliana. Sci Rep 7: 46629.
3. Meuwly, P. and Métraux, J. P. (1993).Ortho-anisic acid as internal standard for the simultaneous quantitation of salicylic acid and its putative biosynthetic precursors in cucumber leaves. Anal
Biochem 214(2): 500-505.
4. Noutoshi, Y., Okazaki, M., Kida, T., Nishina, Y., Morishita, Y., Ogawa, T., Suzuki, H., Shibata, D., Jikumaru, Y., Hanada, A., Kamiya, Y. and Shirasu, K. (2012). Novel plant immune-priming compounds identified via high-throughput chemical screening target salicylic acid glucosyltransferases in Arabidopsis. Plant Cell 24(9): 3795-3804.
5. Quentin, M., Baurès, I., Hoefle, C., Caillaud, M. C., Allasia, V., Panabières, F., Abad, P., Hückelhoven, R., Keller, H. and Favery, B. (2016). The Arabidopsis microtubule-associated protein MAP65-3 supports infection by filamentous biotrophic pathogens by down-regulating salicylic acid-dependent defenses. J Exp Bot 67(6): 1731-1743.
6. Zhao, P., Lu, G. H. and Yang, Y. H. (2017). Salicylic acid signaling and its role in responses to stresses in plants. In: Pandey, G. K. (Ed.). Mechanisms of Plant Hormone Signaling under Stress. John Wiley & Sons 413-441.