HAL Id: cea-02338718
https://hal-cea.archives-ouvertes.fr/cea-02338718
Submitted on 24 Feb 2020
HAL is a multi-disciplinary open access
archive for the deposit and dissemination of
sci-entific research documents, whether they are
pub-lished or not. The documents may come from
teaching and research institutions in France or
L’archive ouverte pluridisciplinaire HAL, est
destinée au dépôt et à la diffusion de documents
scientifiques de niveau recherche, publiés ou non,
émanant des établissements d’enseignement et de
recherche français ou étrangers, des laboratoires
B. Dinh, S. Grandjean, A. Salvatores, P. Baron
To cite this version:
B. Dinh, S. Grandjean, A. Salvatores, P. Baron. Potentialities os simulation Tools for NRTA.
Sympo-sium on International Safeguards : Building Future Safeguards facilities, Nov 2018, Vienne, Austria.
�cea-02338718�
POTENTIALITES OF SIMULATION TOOLS FOR NRTA
B. DINH, S.GRANDJEAN, A. SALVATORES, P. BARON Nuclear Energy Division
French Alternative Energies and Atomic Energy Commission Bagnols-sur-Cèze, France
Email: [email protected]
Abstract
For the design of purification cycles using liquid-liquid extraction techniques, a process development approach based on process modelling was chosen. This approach involved the development of a qualified simulation tool, which had been successfully used for process flowsheet design of industrial plants, and safety analysis of plant operation. Possible software applications to aid plant operation using this qualified simulation code were proposed, including: automatic flowsheet calculations; simulation tools for process monitoring or control; and a diagnostic tool. This third application allows detection of the occurrence of a process malfunction from data obtained in monitoring the state of process parameters. A combination of calculations, using the process simulation code and neural network techniques, is used to determine the nature of the malfunction (i.e. which operating parameter has changed), the amplitude of the parameter change, and the time at which the malfunction has occurred. Such a diagnostic application is possible because of the reliability and speed of the process simulation. The tool’s ability, following detection of a malfunction, to identify the changes in operating parameter responsible for the malfunction using an appropriate process monitoring treatment could be an example of a feature of interest for NRTA purposes.
This paper will present the process simulation tool and the diagnostic tool, to illustrate what could be achieved using existing qualified simulation tools. There are still further developments required, but the application is considered worthy of further consideration.
1. THE PAREX CODE [1]
Process development in CEA is based on a modelling approach which results in a qualified numeric code for solvent extraction operations simulation. The PAREX code is able to simulate the behaviour of the species of interest in the different solvent extraction operations of the PUREX process, in steady or transient state. It takes into account the specificity of the different types of contactors used in the process for a good simulation of their mass transfer efficiency.
Before its use for industrial applications, this code was qualified by confrontation with appropriate experimental data. The models of the main phenomenon embedded in the code (distribution models for species of interest, kinetics of mass transfer or of redox reactions) were qualified at first. Flow sheet experiments performed in or pilot of different scales, using different type of contactors (mixers-settlers, pulsed column or centrifugal contactors) were used for this purpose. The concentration profiles measured in steady-state are confronted to simulation results. Severe malfunction leading plutonium build-up and leakage were performed. The transient response of the process was compare to simulation results [2].
The PAREX code was used for the design of the industrial nuclear fuel reprocessing plant in La Hague. These tasks mainly included flowsheet design and optimisation of the solvent extraction purification cycles [3] [4] and safety analysis of their operation. This latter task consist in the determination of the available operating margin. Steady state simulations of the process with increasing deviations applied to operating parameters are performed to determine the level of deviation leading to the occurrence of critical events like plutonium build-up and leakage. These steady-state parametric simulation reveals also the process-state indicators, valuable for the design of the process monitoring system. Transient simulation are then performed in case of severe malfunction to select the process state indicators that allow early detection in order to allow in time corrective actions.
The PAREX code is also used on the La Hague site as an aid for plant operation either for safety considerations (operating margin evaluation in specific operating conditions) but also for process trouble shooting. Its ability of process simulation can help to analyse peculiar process deviation from nominal behaviour, thus giving a valuable insight of the process operation useful to decide for a corrective actions when needed [5].
2.THE DIAGNOSTIC TOOL
A diagnostic tool has been developed based on the PAREX code [6]. Its purpose was to detect the occurrence of a malfunction and propose a diagnostic of its origin, by the monitoring of process state indicators. The diagnostic given includes the nature of the malfunction (which operating parameter (s) has changed), the amplitude of the change and the time of occurrence. This work was done in the frame of a PhD thesis. These features are obtained using the PAREX code combined with a neural network technique, consisting in the establishment of a set of associative memories.
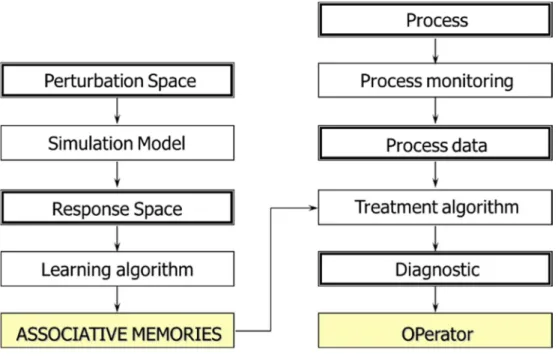
Figure 1- Principle of the diagnostic tool
The scheme presented in Figure 1 shows how the tool works. All possible process perturbations are defined in the perturbation space. For instance, a process perturbation is defined by an operating parameter of the process, its range of value, the time of its occurrence. The process dynamic responses corresponding to each of perturbation of the perturbation space will be calculated in a defined time frame using the PAREX code, generating the process response space.
The first step for the diagnostic tool is the learning step. It consists in associating the simulated process responses to the perturbation at its origin using different set of associative memories. A set of associative memories is used to associate an operating parameter to a process indicator. For one parameter the number of associative memories sets is equal to the number of process indicators to consider. In the diagnostic phase, the measured process indicator responses are send to the tool and the associative memories will determine the most probable perturbation that has occurred, precising which parameter is concerned, the magnitude of the parameter deviation and moreover, the time at which it has occurred. This result is obtained by confronting these experimental values to the set of associative memories available after the learning step.
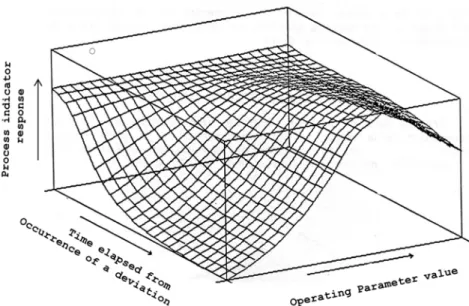
perturbation that has occurred at a given time t, defined by the nature of the deviated parameter (an input), and the process indicator (output), all the transient responses of the latter simulated over a time frame pre-defined corresponding to different values of the parameter are put together forming a 3D-image as shown in FIG 2
FIG 2- Example image associating an operating parameter to the transient responses of a process indicator
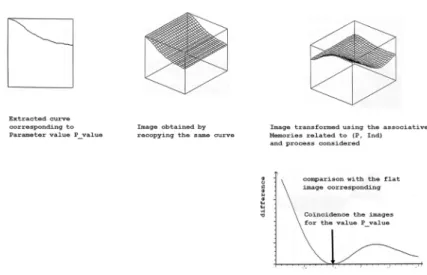
The association of this type of response to deviations applied to the considered operating parameter are determined so as to transform the so constructed 3D-image into a plane image as shown in
FIG 3.
FIG 3- Association of an operating parameter P and the transient responses of a process indicator:
transformation of the 3D initial image into a flat image
To illustrate how the diagnostic mode works, suppose we extract one of the transient responses of a process indicator (P_Ind) obtained with variations of operating parameter P (first image represented in
FIG 3), corresponding to a given value (P_value )of the operating parameter. Consider the image obtained by filling the area with the same curve. The treatment of this new image by the associative memories related to (P, Ind) give a new image. The comparison of this new image with the flat image obtained at the learning stage will only coincide at the parameter value (P_value) of the chosen response as an input for the diagnostic.
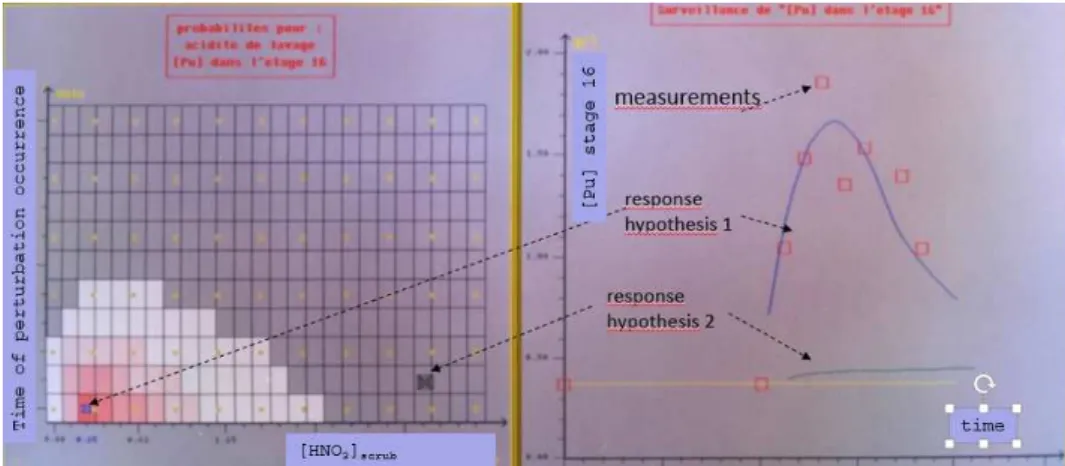
To allow the determination of the time of occurrence of an operating parameter change sets of associative memories are considered for different hypothesis of time occurrence. The results of the diagnosis are expressed through charts of the type shown in FIG 5 for a given choice of an operating parameter and a process indicator. Each square on the chart correspond to a perturbation defined by the parameter value (x axis) and time of the occurrence of the parameter change (y axis). The coloration of the squares represents the difference with the “flat” image: dark colorations means very weak difference (very probable perturbation hypothesis) and clear coloration very great difference (very improbable hypothesis).
The diagnostic tool has been tested to diagnostic a malfunction due to a sharp decrease in nitric acid concentration of the scrub phase in an extraction–scrubbing flow sheet of PUREX process. The diagnostic results are given on FIG 6. This malfunction was correctly detected considering the acid nitric of the scrub phase as input parameter and variation of the aqueous plutonium concentration in the last scrubbing stage (inlet of scrub phase). The right part of the chart give the output response corresponding to the supposed perturbation. This response fit well with experimental results in the case of hypothesis 1 (most probable perturbation) but not in the case of hypothesis 2.
FIG 6 – Application to the diagnostic of low acidity scrubbing in an extraction scrubbing flowsheet.
Left: most probable perturbation in red (time and acidity value) - right: corresponding simulated responses
3. POTENTIALITIES FOR NRTA APPLICATION
The perturbation space as well as the response space can be re-defined as to adapt the diagnostic tool to a different purpose, NRTA for example.
We have considered in the previous section a perturbation as a stepwise change of one operating parameter, but the perturbation could be re-defined to meet a specific diagnostic for NRTA purpose for example. It could be any combination of the available input of the process (operating parameter). Different forms of parameter change different from stepwise change could also be taken into account. This could be interesting to detect specific exploitation procedures. As the process perturbations are associated to their impact on all the available process indicators, the coherence of the process indicators can be checked, consolidating the diagnostics. For one perturbation, charts giving the probabilities of occurrence of this perturbation can be obtained using the different available process indicator. The superposition of their results can give a synthetic probabilities chart for this perturbation. Moreover, it could be also a way to detect abnormal response of one process indicator.
4.CONCLUSIONS
The diagnostic tool presented based on the use of a qualified process simulation tool and neural network technics proved to be efficient in process malfunction detection and is able to give precise valuable information about the perturbation, its nature, magnitude and time of occurrence. It could be interesting to adapt the proposed features for NRTA purpose by redefining the type of perturbations are worth to detect and analysed. This work is still to be done. But it is an interesting path that worth to be further developed for NRTA purpose.
5.REFERENCES
[1]
C. Sorel, M. Montuir, C. Balaguer, P. Baron, B. Dinh, X. Heres, V. Pacary and H. Roussel, “A powerful tool to modeland simulate solvent extraction operations,” in Proceedings of 19th ISEC, Santiago - Chili, 2011.
[2]
B. Dinh, M. Montuir and P. Baron, “PAREX, a numeric code for process design and integration,” in Global 2013,Salt-Lake City, 2013.
[3]
P. Baron, B. Boullis, M. Germain and J. P. Gué, “Extraction Cycles design for La Hague plant,” in Global 2013,Seattle, 1993.