LEEIXS and XPS studies of reactive unbalanced magnetron sputtered chromium oxynitride thin films with air
10
0
0
Texte intégral
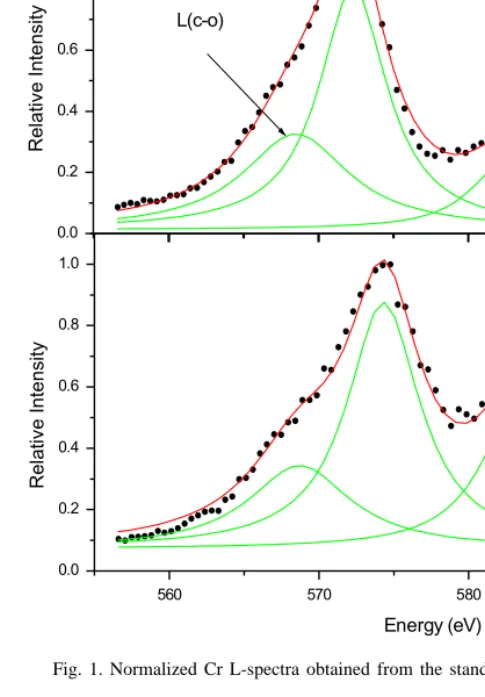
Figure

+2
Documents relatifs