HAL Id: hal-01574744
https://hal.laas.fr/hal-01574744
Submitted on 18 Aug 2017HAL is a multi-disciplinary open access archive for the deposit and dissemination of sci-entific research documents, whether they are pub-lished or not. The documents may come from teaching and research institutions in France or abroad, or from public or private research centers.
L’archive ouverte pluridisciplinaire HAL, est destinée au dépôt et à la diffusion de documents scientifiques de niveau recherche, publiés ou non, émanant des établissements d’enseignement et de recherche français ou étrangers, des laboratoires publics ou privés.
deposition on Al(111) substrate: linking material design
and elaboration process parameters through multi-levels
approach
Mathilde Guiltat, Nicolas Salles, Marie Brut, Georges Landa, Nicolas Richard,
Sébastien Vizzini, Anne Hémeryck
To cite this version:
Mathilde Guiltat, Nicolas Salles, Marie Brut, Georges Landa, Nicolas Richard, et al.. Modeling of the interface formation during CuO deposition on Al(111) substrate: linking material design and elaboration process parameters through multi-levels approach. Modelling and Simulation in Ma-terials Science and Engineering, IOP Publishing, 2017, Focus on MMM 2016, 25 (6), pp.064005. �10.1088/1361-651X/aa7bbc�. �hal-01574744�
Modeling Of The Interface Formation During CuO
Deposition On Al(111) Substrate: Linking Material Design
And Elaboration Process Parameters Through
Multi-Levels Approach
M Guiltat,1 N Salles,1 M Brut,1 G Landa,1 N Richard,2 S Vizzini 3 and A Hémeryck *1
1 LAAS-CNRS, Université de Toulouse, CNRS, UPS, Toulouse, France
2 CEA-DAM-DIF ; Bruyères-le-Châtel ; F-91297 Arpajon Cedex, France
3 Aix Marseille Univ, IM2NP, Fac Sci St Jérôme, F-13397 Marseille, France
corresponding author: [email protected]
Abstract — In this paper, we use a multi-levels modeling approach to describe the elaboration of directly integrated energetic materials. The deposition of copper oxide on aluminum substrate is described. Atomic scale calculations are first conducted to identify local mechanisms involved during the growth of CuO on Al(111). These atomic scale data are then used to parameterize a macroscopic code, inspired on a kinetic Monte Carlo methodology dedicated to simulate vapor like deposition process. The objective is to establish the link between the microstructure of materials and the way they are achieved, i.e. the process parameters such as temperature and gas pressure. This work is conducted in the context of the integration of nano-structured energetic thermites used as micro energy source in microelectronic devices. We show that the temperature of the deposition process appears as the driving parameter to tailor the thickness of interfacial layers.
Keywords: PACS: 68. Surfaces and interfaces; thin films and nanosystems (structure and nonelectronic properties), 60. Condensed Matter: Structural, Mechanical and Thermal Properties, 81. Materials science, 82. Physical chemistry and chemical physics.
1. Introduction
In the context of integration of materials toward improved and multi-functional electronic devices, an absolute control at the atomic scale of the material growth during the technological processes is required since it is this atomic arrangement at the nanoscale level which will ensure the final properties to the achieved materials [1-5]. Many Technological Computer Aided Design (TCAD) tools have demonstrated their interest to the understanding and to the improvement of new devices but few of them are devoted to the simulation of the elaboration phase [6-12]. Developing the means of predicting and controlling the structures of integrated materials at the nanometer scale will thus help to push forward their elaboration. Predictive simulation of the deposition process is strategic since it could help to tailor the composition of the achieved layers, and especially in the case of multilayered or stacked materials, it could help to master the formation of interfaces.
In the following, we present a conventional multi-levels modeling approach, combining Density Functional Theory calculations (DFT) and kinetic Monte Carlo (kMC) simulation. This modeling approach is conducted with the objective to provide a TCAD tool endowed by an atomistic granularity to the industry of Microelectronics, as a tool-for-the-engineer dedicated to the design of tailored integrated material. The multi-levels modeling study is detailed where atomic-scale observations are used as input data to parameterize a macroscopic code, inspired on a kinetic Monte Carlo (kMC) methodology. This code is able to simulate vapor-like deposition process and to predict the interface composition as a function of the applied process parameters. The developed code will help to understand how matter organizes at the atomic scale, and it will help to predict and evaluate the influence of the experimental conditions on the material nanostructuring, linking design and manufacturing. This multi-levels approach has been already applied for instance to the thermal oxidation of silicon [13], atomic layer deposition simulations [9,10] and epitaxial growth [14].
In this paper, the multi-levels modeling approach is applied for the deposition of CuO on Al(111) substrate. AlCuO nano-thermites are energetic materials, able to release a high amount of energy on request by using an appropriate stimulus [15]. Those materials can be elaborated as nanometer-thick multi-layered foils using sputtering deposition process [16,17]. However, during such a deposition process, the formation of uncontrolled interfacial layers is observed between the Al and CuO layers due to the atomic diffusion at the interface between
both materials [16-18]. These interfacial layers are shown as barrier layers that will determine the final properties of the materials [19]. With the objective to achieve tailored materials with dedicated performances, it is therefore crucial to be able to master the formation of these interfacial layers. A fundamental understanding and a predictive modeling approach appear here as a key strategy to predict their formation.
First, the atomic scale investigation for the identification of the local mechanisms involved during the growth is described using DFT calculations. As during the first step of the deposition a dissociative adsorption of CuO(g) is observed on Al(111) [18], we study separately the deposition and the dynamics of O atoms and Cu atoms on the Al(111) surface [18,20-22]. We focus on the diffusions of both species on the Al(111) surface, where the formation of close packed islands is observed. We also study their ability to insert in the topmost layer and deeper in the substrate. Some couple effects between Cu and O species have been also investigated [18]. Then, the identified favorable structures and associated energetics are used as input data to feed a macroscopic homemade TCAD tool based on a kinetic Monte Carlo methodology. This software simulates the deposition of CuO on Al(111) and takes into account the process parameters such as temperature and gases pressure. Results on the effect of substrate temperature on the thickness of the grown interfacial layer are given.
2. Climbing the scales: A multi-levels strategy
2.1 Atomistic investigations of the growth local mechanisms using DFT calculations
Large amount of DFT calculations is performed in order to identify the local mechanisms as they could occur during the growth of materials with an atomic scale insight. All the atomic diffusions are then precisely characterized in terms of energetics (activation barriers and energy gains). All the results presented in this work have been conducted using DFT methodology as implemented into VASP 5.3.3 software [23-26] with the Perdew-Burke-Ernzerhof functional in the Generalized Gradient Approximation (PBE-GGA) [27]. We used a plane wave basis set for the Kohn-Sham Bloch functions, with a cut off energy of 400 eV to account for valence electrons. Ions are relaxed with a conjugate-gradient algorithm. The sampling of the Brillouin zone was performed using a Monkhorst-Pack [28] mesh of 2×2×1 k-points and projected-augmented waves (PAW) [29,30] to represent inner electrons. All the activation energies were determined using the Nudged Elastic Band (NEB) method [31]. The
Al(111) slab is built as an orthorhombic supercell of (4×2) surface unit cells. A vacuum zone of 15 Å is added following the z-axis, in order to model the surface. The system contains 96 atoms distributed in 6 layers of 16 atoms corresponding to slab dimensions of 11.43×9.90×25.00 Å3. These simulation cell parameters have been checked to avoid any interaction with other periodic cells. Al atoms at the bottom of the cell are kept fixed during geometry optimizations, reproducing thereby the bulk behavior. All other atoms are free to relax.
On this modeled Al(111) slab, CuO molecule, Cu and O atoms are adsorbed and then their dynamics on the surface and deeper into the bulk are investigated. In the following, the adsorption energies (𝐸!"#$%&'($)) are
calculated as follow:
𝐸!"#$%&!"#$= 𝐸!"!#$− 𝐸!"#$%&'"! !"#$− 𝐸!"#$
With:
𝐸!"!#$ the total energy of the system in a given adsorbed configuration.
𝐸!"#$%&'"! !"#$ the reference energy of an atomic Cu or O.
𝐸!"#$ the reference energy of the Al(111) Slab.
2.2 Simulation of the deposition process: a kinetic Monte Carlo inspired algorithm
Atomic scale data are then implemented as input data into the tool based on a kinetic Monte Carlo (kMC) methodology, for the simulation of the deposition process. This tool mixes all the atomic scale events identified using DFT. It simulates CuO deposition on Al(111) substrate as a function of realistic process parameters taking into account the gases and substrate temperatures, the deposition duration, the gases pressures… This level of modeling reaches size and time scales characteristic of the technological process [13].
At each step of the kMC cycle, each site of the system is scanned in order to identify all the possible events that can occur in the given state. For each possible event, an occurrence probability P! is associated. Two kinds of
events are defined, namely Arrivals and Diffusions.
P! = C !!"#!
!!!"# (1)
where Tgas is the chamber temperature, Pgas the gas pressure, M the molar mass, S the surface of the unit cell determined considering the cell parameter of the aluminum crystal and C a constant. Using this approach, we introduce a matter supply into the simulation and we will be able to take into account the process parameters Pgas and Tgas, as applied during the technological deposition.
Concerning Diffusion events, Cu and O atomic surface diffusions, Cu insertions and diffusions into the bulk were implemented as identified through DFT calculations (see part 3.1 for the details).
The occurrence probability of a diffusion of an O atom on the surface (related to mechanisms described in parts 3.1.1, 3.1.2) and of the insertion of a Cu atom in the topmost layer (related to the mechanisms described in 3.1.3) are calculated using the Arrhenius’ Law formula given in (2):
P!= v. e
!!!
!!! (2)
where Ei is the activation barrier of the diffusion i determined thanks to DFT calculations, kB is the Boltzmann constant and T is the temperature of the substrate. ν is the attempt frequency which can be associated to a vibration mode of the crystal. In our case and considering the temperature range, we consider ν = 1012 s-1, as the vibration mode of the phonons in aluminum crystal [32,33]. This value can depend of the local environment from the surrounding atoms. In this work it is taken as uniform because the variations of the occurrence probabilities come predominantly from the difference between the activation barriers compared to the difference between ν for selected atomistic mechanisms.
Then the Poisson formula (3) is used to associate an occurrence time to the occurrence probability as:
t!= t!"#$%&'"()−!" !
!! (3)
This time can be seen as the residence time for one event to be realized. This enables us to introduce a time dependency in the simulation and to reach a realistic time simulation comparable with experiments.
2.2.1 Specific implementation for the O species
We demonstrate that the extraction mechanism resulting in the formation of an oxide nucleus [see 21 for details] occurs as a consequence of the arrival of one O atom above an oxygen island with a minimal size of four O atoms. Such an atomistic event is implemented by checking the size of the oxygen island, as a non-thermally activated event, where the final configuration is directly modified after an Arrival on a suitable O island.
2.2.2 Specific implementation applied for the Cu species
Concerning the diffusion of an isolated Cu on the Al(111) surface (see also part 3.1.1), DFT calculations have revealed that the diffusion of copper atom exhibits a very low activation barrier of 0.03 eV, so that Cu atoms will diffuse back and forth on the Al(111) substrate before being trapped by other copper atoms gathered as an island configuration or near an oxide nucleus [18]. In order to avoid to compute the diffusion of an isolated Cu atom as an atomistic event, a special treatment of the isolated Cu atom is introduced into the kinetic Monte Carlo procedure as a macroscopic diffusion based on the Fick’s Law. We calculate that an isolated Cu atom can be trapped near another isolated Cu atom or near an already formed Cu island or near an oxide nucleus on the aluminum surface [21]. For such a macroscopic treatment for the isolated Cu on the surface, we consider consequently that an arriving Cu atom will directly diffuse toward one of those trapping sites. The search for such a trapping site is conducted through an iterative method using concentric circles. Once the trapping site is identified, the code searches for an empty site in the nearest neighborhood picked randomly. The way the search procedure is developed allows the formation of close-packed island. Once the final position is localized, the diffusion distance is determined by counting the number of crossed sites 𝜕 introduced in equation (4) as a dimensionless parameter by scaling the total diffusion distance to the dimension of the cell.
t! = t!"#$%&'"()−!" !
!! ∗ 𝜕
! (4)
Concerning the diffusion of Cu species deeper into the bulk (related to mechanisms described in part 3.1.4), our DFT investigation reveals that it is not easy for Cu atoms to diffuse into the bulk through concerted exchange with the aluminum species (not detailed here). Nevertheless, considering vacancy in the substrate favors copper diffusion. Vacancies are introduced in our model as vacancies are equilibrium defects that exist notably in metallic systems and alloys [34]. Here, in order to save simulation time and cost, the vacancy is not physically represented but it is introduced as an equilibrium concentration estimated at 10-4 % [35-38]. The occurrence probability of such a vacancy-enhanced diffusion is calculated using the Arrhenius’ Law (see equation (2)) and considering an existing vacancy through a concentration rate. The probability of diffusion of a Cu atom considering an existing vacancy in its close neighborhood (first neighbor) is thus estimated as an average value determined by considering also the possible diffusions of surrounding Al atoms toward this vacancy [34,39,40]. The corresponding formula for the calculation of the residence time of the diffusion of a Cu atom deep in the Al substrate is given in equation (4) [40]:
∆t = ! !!(!")!!(!")∗ ! !! !" !!! (5)
with Ns(Al) the number of Al atoms in first neighborhood of the vacancy, Cv(Al) the vacancy concentration and P! the diffusion probability of each atom surrounding the vacancy.
3. Results and discussion
3.1 Complex chemistry during the formation of interfacial layer 3.1.1. Adsorption and surface diffusion of O and Cu species
DFT calculations have been carried out to investigate the atomic scale reorganization occurring during CuO deposition on Al(111). Some results already published in [18,20,21] are summarized in the following. The adsorption of CuO on Al(111) is dissociative with an adsorption energy of -7.57 eV or -7.17 eV depending on the dissociated O atom adsorbed on fcc or hcp site respectively.
A separate study of the adsorption and of the diffusion of Cu and O can thus be conducted.
The adsorption energy of O on Al(111) is -4.82 eV and -4.41 eV on fcc and hcp sites respectively [20,21]. Isolated O atom exhibits a thermally activated surface diffusion behavior (with activation barriers of 0.79 eV from fcc to hcp and 0.31 eV from hcp to fcc) [20].
The adsorption energy of Cu on Al(111) is -2.80 eV. Then Cu atoms will diffuse back and forth on the surface due to a non-existing diffusion barrier when isolated (around 0.03 eV). This Cu diffusion barrier increases to 0.32 eV when the Cu atom fall from a step defect of the Al(111) surface, due to the Ehrlich-Schwoebel effect [41].
3.1.2. Surface clustering
Both Cu and O atoms tend to form close-packed islands on the Al(111) surface. An increase of the activation barrier of the oxygen diffusion estimated at 0.20 eV is observed when the O atom leaves a close-packed position. This value is due to an increase of the electrostatic interaction energy between O and Al atoms with the clustering of O atoms. In the case of the Cu species, the diffusion barriers to go out from a copper island also increase considerably. These barriers have been estimated to be higher than 0.50 eV indicating that the Cu atoms will not move away from the island once agglomerated [18]. The increase of the activation barriers for both species favors the clustering on the surface [20].
3.1.3. Insertion in the topmost layer of the aluminum substrate
No insertion of the O species was observed, but an oxide nucleus can be formed from an oxygen island through a not thermally activated mechanism. This last mechanism is characterized by the extraction of the Al atoms of the surface from the substrate [21].
In the opposite way, it is observed experimentally that the Cu atoms will diffuse deep into the Al(111) substrate [17,42]. The insertion of the Cu species into the topmost layer is identified as a concerted displacement between a Cu atom and an Al atom of the surface layer [21]. Here the Al atom is extracted from the surface and replaced by the Cu atom, creating Al ad-atom on the surface. This Cu insertion in the topmost layer depends on the Cu coverage on the surface and will be intimately correlated to the temperature and the pressure of the applied process: when a Cu atom is isolated on the surface the calculated insertion energy is 0.54 eV whereas when a
neighboring Cu atom exists the insertion energy decreases to 0.39 eV. For a larger number of neighbors, the insertion energy increases up to 0.76 eV because of electrostatic effects.
Consequently, the technological process parameters will influence the atomic organization on the surface. At elevated pressure or low temperature, large Cu islands would be formed and the insertion of Cu into the topmost layer will not be favored. At low pressure or high temperature, small Cu islands would be formed favoring Cu insertions into the substrate.
3.1.4. Deeper diffusion of Cu species in the substrate
Once the Cu species is inserted, we consider a Cu diffusion deeper into the aluminum substrate using vacancy defects. Actually, no DFT calculation was successful to identify diffusing process favoring the diffusion of a Cu atom located on a substitutional site of the aluminum substrate toward deeper layers into the bulk. Local mechanisms like the direct exchange, indirect exchange, cyclic exchange and interstitial exchange were investigated and failed or were associated to very high activation barriers.
Diffusion using vacancy species appears as the easiest and consequently as the most probable diffusion to occur. More, the vacancies can be considered in such modeling atomistic approach since they are equilibrium defects existing in metals regardless the fabrication method. Diffusions enhanced by vacancies are known as the favored mechanism for the diffusions of substitutional species into a solid [25]. As we focus on the Cu diffusion deeper into the substrate, we only study the diffusion toward vacancy located under a Cu atom in the (100) plane as it appears as the most favorable diffusion plane leading to the formation of Guinier Preston zones [19,42]. All the following activation barriers were calculated for a same diffusion direction in the (100) plane.
The results reveal that the activation barriers depend on the neighborhood and the depth from the surface layer. When considering the case of the diffusion of an isolated Cu atom inserted into the topmost layer, the first diffusion from the surface layer to the surface-1 layer (see Figure 1) exhibits an activation barrier large of 0.30 eV with an energy gain of -0.16 eV in the final configuration. For the diffusion between surface-1 and surface-2 layers, the diffusion barrier rises to 0.51 eV associated with an energy gain of -0.10 eV. Finally, for the diffusions between surface-2 and surface-3 layers and deeper, the activation barrier is 0.56 eV and no more stabilization of
the system is observed. From this point, the diffusing Cu atom reaches the bulk and it does not feel surface effects anymore.
Figure 1: Cu diffusion toward a vacancy located in the (100) plane for systems containing one Cu atom.
Considering that we introduce a vacancy in the close vicinity of a Cu species, it is necessary to study the ability for the surrounding Al atoms to diffuse toward this vacancy. We observed the same tendency for the Al atoms in terms of the variation of the activation barriers as a function of the depth of diffusion: smaller activation barriers for aluminum diffusion toward the vacancy were obtained in the topmost layers. We also noticed that the activation barriers for an Al atom to diffuse toward the vacancy is always smaller by 0.15 eV than a copper diffusion, indicating that Al atoms will diffuse more rapidly in the vacancy compared to the Cu species. These diffusions are illustrated in the figure 1.
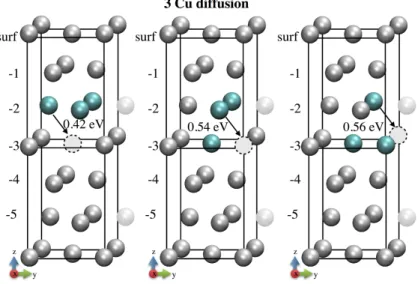
In order to investigate the effect of the Cu coverage on the deep insertion of Cu into the Al substrate, we study the deep diffusion of a Cu atom in a rich copper zone. This study is conducted when considering a Cu island containing three Cu atoms inserted in the aluminum slab starting from the surface layer to surface-6 layer. Such study is depicted on Figure 2, where the initial three inserted Cu atoms is located on surface-2 layer.
Figure 2: Cu diffusion toward a vacancy located in the (100) plane for a system containing three Cu atoms.
From the configuration where the three Cu atoms are inserted as a group in the same layer, a diffusion direction is favored for the first moving Cu atom leaving the group toward the layer below to align the three Cu atoms in the (100) plane. This diffusion is highly facilitated for the diffusion from surface to surface -1 layer, with a reduced activation barrier of 0.08 eV. Then the same diffusion occurring deeper in the substrate exhibits an activation barrier of 0.42 eV. If we consider the diffusion of the two other Cu atoms above breaking the rich favored copper plane the calculated activation barrier is the same as the one calculated for an isolated Cu atom in the bulk that is 0.56 eV. This reveals a privileged Cu atoms diffusion plane and an enhanced diffusion for copper species in a rich Cu environment, leading to the formation of rich copper Guinier Preston areas under the surface [19,43].
3.1.5. Coupled effects of the adsorption of Cu and O on Al(111)
Concerning coupled effects between Cu and O species, an oxide nucleus will trap Cu species in the surface layer [18]. A static study was performed on the insertion of Cu species near and below an oxide nucleus. The most stable configuration is observed when the Cu atom is as first neighbor of the oxide nucleus. Then we notice a destabilization of the inserted Cu atom under the oxide (with an average of 0.20 eV) when moving it away from the oxide nucleus (Figure 3 and Table 1). An oxide nucleus will thus prevent the inserted Cu atom to diffuse deeper into the bulk. Considering this point, we do not determine activation barriers.
Figure 3: Side view of an oxide nucleus on the Al(111) surface with a Cu atom inserted as a substitutional species in its neighborhood. Seven inserted Cu configurations have been investigated, numbered from #0 to #6. The
stability of the different positions for the Cu atom is given in Table 1.
Table 1: Stability (∆E) of the configurations of inserted Cu as a substitutional species in close neighborhood of an oxide nucleus as referred in Figure 3.
Positions (#) 0 1 2 3 4 5 6
∆E (eV) 0 0.15 0.19 0.21 0.20 0.21 0.23
3.1.6. Comments on the identification of the local mechanisms of the growth
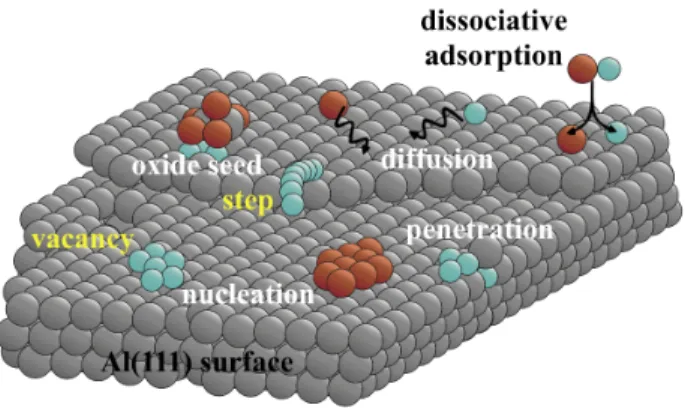
All the DFT mechanisms mentioned above are schematized in the Figure 4.
The obtained tendencies highlight the complex chemistry occurring during the interfacial layer growth and the nanostructuring of the layer. We observe that both species tend to agglomerate and to form compact island on the surface. The O species forms oxide on the surface and will not insert into the aluminum substrate. An opposite behavior is observed for the Cu species characterized by a deep diffusion into the Al(111) substrate. This deep insertion does not occur anymore when the Cu species is trapped near an oxide nucleus. We also identify that the external parameters such as temperature and pressure as encountered in vapor like technological deposition processes, can play a role into the interface formation.
At this stage, only based on DFT results, we are not able to depict and predict the interface formation at the macroscale, and we need to go beyond DFT. The second step of our modeling approach is to resort to macroscopic modeling methodology inspired from a kinetic Monte Carlo (kMC) formalism to mix all the identified atomistic events and to run simulations to reach larger time and size scales
Figure 4: Schematic of investigated local mechanisms using DFT, where Al, Cu, and O are represented by grey, blue and red balls, respectively.
3.2 Design the material elaboration thanks to the control of kinetics at the atomic scale
Using this atomic scale investigation, we develop a macroscopic modeling tool endowed by an atomistic granularity for the simulation of the deposition of CuO on Al(111). The aim is to study the effect of the atomistic local mechanisms on the nanostructuring of the layer and to put them in confrontation with the external parameters as applied during the technological process. The goal here is to prove that the fundamental knowledge of atomistic events will help to design tailored materials by controlling the way they are achieved.
The Table 2 summarizes the activation barriers and trends selected thanks to the DFT investigation to build the list of the events introduced in the kMC tool.
Table 2: Summary of the activation barriers (in eV) of the Cu and O behavior on the Al(111) surface introduced into the kMC code. Comments are provided to indicate when a mechanism is forbidden due to non-existing event
or too high activation barrier.
Cu O
fcc hcp
Toward an isolated
position 0.50 0.94 0.51
Top to bottom of a step 0.32 Not authorized
Insertion into the topmost layer 0.54 NO – extraction
mechanism Depth Diffusions
(1 Cu)
Near an oxide nucleus NO
Do not occur Surf à surf -1 0.30 Surf -1 à surf -2 0.51 bulk 0.56 Depth Diffusions (3 Cu)
Near an oxide nucleus NO
Do not occur Cu1 in the (100) plane Cu2 & Cu3 Surf à surf -1 0.08 0.28 Surf -1 à surf -3 0.40 0.50 bulk 0.35 0.49
In this part, we will focus on the results obtained using the kMC tool. We will first describe the behaviors of isolated species and then we perform simulation of CuO deposition as a function of applied external parameters:
- Gas exposure duration is varied in the case of deposition of O species. The simulations of O deposition are compared with Scanning Tunneling Microscopy (STM) data obtained by Brune and coworkers [42] on the early stages of O deposition. STM are good experiments to compare our simulated results and validate our tool.
- For Cu deposition, we evaluate the effect of the substrate temperature on the Cu insertion depth.
- Finally, we study the predictive feature of the kMC code on the formation of the CuO/Al interface at four different temperatures.
3.2.1 Early stages oxidation of Al(111) simulation and comparison with STM data
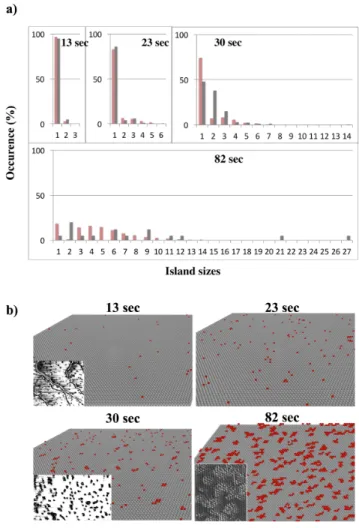
Deposition of O atoms simulations are performed at 1.33 10-4 Pa at ambient temperature in order to reproduce experimental conditions applied in Brune’s experiments [44]. Results are given in the Figure 5 showing four graphics of the distribution of the size of the oxygen islands formed under different exposure times of the Al(111) surface to an oxygen flow during 13, 23, 30 and 82 seconds respectively (Figure 5a) and the morphology of the O islands on Figure 5b. Brune’s results are in grey and our simulated results are in red on Figure 5a. The provided simulated data are an average of twenty performed simulations. For all the simulations, we added 300 seconds of “rest time” where arrivals are forbidden and where only diffusions are authorized in order to mimic the
experimental acquisition time. This time has been introduced in the simulation to reach a better comparison with the STM results given in Ref. 44. Note here if no rest time is considered in the simulation, a larger amount of isolated O atoms and smaller oxygen islands are observed in the simulation since we do not let time for the atoms to reorganize on the surface. It is interesting to notice here the mobility of the O species on the surface, independently of the deposition. The rest time has been estimated following discussions with experimentalists. The results for 13 and 23 sec of exposure are very similar with a very good agreement between experiments and simulations, where a majority of isolated O atoms are observed and small islands begin to form after 23 sec. The surface coverages are also in good agreement: 1% and 4% from STM experiments in [44] and 3.09% and 4.09% from our simulations for 13 and 23 sec of exposure respectively.
After 30 seconds of exposure to oxygen, the results are still consistent with the formation of more compact oxygen islands but a slight discordance is observed in the populations of isolated O atoms and two O atoms islands. In our simulations, a majority of isolated O atoms is still obtained and many two O atoms, three O atoms and four O atoms islands are also formed. Experimentally, the surface is mainly covered by isolated and two O atoms islands. This difference can be attributed to the variable acquisition time (introduced as a “rest time” in the simulation), not given in Brune’s article. Nevertheless, a similar O coverage is observed (6.03% in our simulations and 6.50% experimentally).
After 82 seconds of exposure, there are few isolated atoms on the surface and large islands up to 27 O atoms are present. These large oxygen islands are compact, with geometrical shapes comparable with experimental observations in the Figure 5b. The surface coverages are 15% and 13.44% for STM and our simulations respectively [44]. At this point, the first oxide seeds appear, in agreement with experimental data: the appearance of the first oxide nucleus is observed after 65 sec of deposition and 13% of coverage experimentally and we observe this phenomenon after 64 sec and 11.67% of coverage in the kMC simulations.
All those results are really close to experiments and allow us to validate the kMC simulations for the deposition of O atoms on Al(111).
Figure 5: a) Comparison of histograms of the size of the oxygen islands and their amount on the Al(111) surface for different times of exposure. Red histograms are obtained using kMC simulations and grey histograms are
extracted from Brune’s experimental STM study b) Visual comparison with STM pictures of the surfaces for different times of exposure. Experimental data and STM images are extracted from Ref. 42.
3.2.2 Effect of the temperature on the penetration depth of Cu species
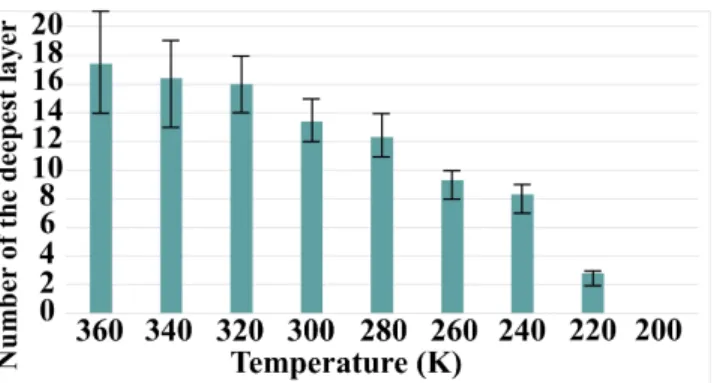
We then perform simulations on the deposition and diffusion of Cu atoms on Al(111) for a wide range of temperatures from 200 K to 360 K. The Figure 6 is a chart graphic highlighting the temperature effect on the Cu penetration depth after 100 seconds of simulation. Every chart is an average of twenty simulations. Below 200 K no insertion is observed due to the too high activation barrier that cannot be overcome at this low temperature. From 220 K to 320 K, the insertion of Cu species into the aluminum substrate occurs. A linear progression in the penetration depths is observed until the 16th layer is reached, corresponding to a penetration depth of ~37Å. Then, beyond 340 K, we reached a plateau in the diffusion depth, close to the 17th layer at roughly ~40Å. This highlights that controlling the applied temperature during the deposition is a way to design and control interface thickness.
Figure 6: Influence of temperature on the insertion depth of Cu atoms.
The observed experimental depth is 18±5 nm [19] when depositing nanometer-thick layer of CuO on Al(111). In our simulation, the value of the plateau for the penetration depth at 17th layer is obtained for simulation running on 100 seconds of deposition. The difference between simulated and experimental values comes from that at the current stage of development, the simulation code is able to simulate the first steps of the growth corresponding to low coverage if we compare with the experiments. Considering longer deposition time in the simulation will both help the Cu atoms to diffuse deeper into the substrate and will result in a higher concentration of Cu in the substrate. This point will be noticed in the following. Other assumptions can be drawn to explain this difference between simulations and experiments: elastic effects are not considered in our calculations. These elastic interactions could lead to complex reorganization of the atoms such as the formation of the Al2Cu alloy. We also consider in the current version of our simulation code a uniform distribution of vacancies which can influence deeply the diffusion mode of the Cu into the Al substrate. We see here that many trails can be explored to enhance our model offering nice perspectives for this tool development. These results were provided to give insight on the key role that can be played by Cu specie in the formation of the interfacial layer and to highlight how the external applied parameters could drive the diffusion of the Cu in Al(111).
3.2.3. Predictive simulations of the deposition of CuO on Al(111)
In a last part, we performed simulations on the deposition of CuO at different temperatures to show the predictive feature of our code about the interface formation.
Four side views of simulated interfaces are provided on Figure 7: The top figure is obtained for a deposition of CuO at ambient temperature (300 K) and the three others are obtained for three temperatures at 220 K, 210 K and 200 K from top to the bottom of the Figure 7. This range of temperatures is described since major changes are observed in the interfacial formation and thickness. The simulations are performed until a full coverage of the initial aluminum surface is reached.
At a temperature of 200 K and below, O atoms diffusions are not be favored and the insertions of Cu atoms do not occur. Only small oxygen islands are formed on the surface and consequently rare extractions occurred and few insertions of Cu in the surface layer are observed. It results in a flat interface where no mixing layer appears between CuO and Al.
We identify a critical temperature between 210 K and 220 K, where a great change in the thickness of the formed interfacial layer appears only by applying a change of 10 K in the temperature. At 210 K, insertions of Su species into the surface layers occur and Cu insertions into the third topmost layers of the aluminum substrate are observed. At 220 K, Cu insertions are favored and we observe that Cu species penetrates into the aluminum substrate until a depth of 13 layers below the aluminum surface. Here, more and more extraction of Al atoms due to oxide formation is observed leading to a higher roughness on the top surface. Finally, above 220 K Cu diffusion drives the interfacial layer thickness and Cu species organizes along diffusion planes. These diffusion planes are visible on the topmost picture of the Figure 7 for a given simulation performed at 300 K, leading to the formation of rich Cu areas and deep reached layers until the 26th layer.
As told previously, by letting the system evolves on a longer simulation time, we can see that maximum the penetration depth of the copper species is obtained here at the 26th layer in comparison with the 17th in the case of the unique deposition of Cu described above. The total simulation times showed in Figure 7 are longer (close to 1400 sec), compared to the part 3.2.2. We can predict that when the kMC code will be able to deal with new events of the 3D growth on longer simulation time, deeper penetration will be reached. This will be enhanced also by the ability for copper species to diffuse through the oxide layer (results not shown here).
Figure 7: CuO interface thickness as a function of the applied simulation temperature obtained using the kMC code.
Figure 7 highlights how we can tune the interfacial layer thickness by playing with the applied technological temperature during the deposition of the materials. A deposition at ambient temperature allows deep diffusions whereas cooling down the substrate at 200 K will avoid mixing between species by decreasing the ability of Cu to diffuse into Al(111).
Here the temperature controls the kinetics of the diffusion. A basic understanding of each local mechanism involved during the growth and the precise knowledge of the height of their activation barriers are thus strategic to reach a tailored nanostructuring of the material during its elaboration.
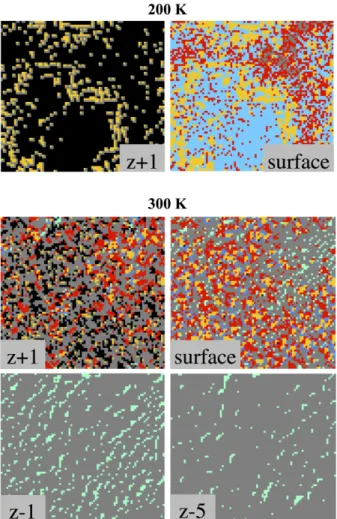
Using the user interface of the kMC code, it also possible to get information about the composition and the structure of the interfacial layer by getting into details in a layer composition like illustrated on the slices given in Figure 8, for a low temperature (200 K) and an ambient temperature (300 K). On Figure 8 and in the following discussion, “surface” corresponds to the surface of the aluminum substrate at the beginning of the simulation, z+1 corresponds to the height of the grown layer due to CuO deposition and z-1, z-5 are respectively the layer in the aluminum substrate directly under the surface layer and the 5th layer deep in the aluminum substrate.
At low temperature (topmost slices on Figure 8), Cu atoms do not succeed to insert into the Al(111) substrate. A large part of the surface is covered by non-inserted Cu atoms (in light blue on Figure 8) forming a unique and large Cu island on the surface surrounded by oxidized parts (in yellow). At this temperature, only the Cu atoms move on
the surface that are able to cluster resulting in the formation of Cu rich areas. At the contrary, the O atoms move with difficulty and over time will form larger islands from where oxidized areas will grow.
At ambient temperature, a massive insertion of the Cu atoms is observed into the substrate, leading to rich-copper zone as can be observed on the slice z-5 where the diffusion of rich-copper in group is visible in the favored diffusion planes. In the depth of the substrate, only few Cu atoms are isolated. On the surface layer (z=0), a large grey area is visible without O atoms and few Cu atoms: this area corresponds to the part of the surface where the Cu atoms start to form an island before inserting massively into the substrate. On this part, the Al atoms have been ejected from the surface through the exchange mechanisms with the copper specie. Such event creates a terrace on the layer z+1, where incoming other CuO molecules can adsorb. On this terrace, the isolated copper species still exhibits a high velocity until trapped by oxide nuclei or other Cu atoms. It can also drop off the terrace through an Ehrlich-Schwoebel effect, where it will be trapped at the step of the terrace. Oxidation can still happen through extraction mechanism forming new oxide seeds. Here the primary steps of a 3D growth of CuO on the surface appear and offer nice perspectives for the development of the kMC code.
Figure 8: 2D pictures of the CuO deposition simulation at 200K (top) and 300K (bottom). O atoms are red, oxides are yellow, adsorbed Cu atoms are light blue, inserted Cu atoms are cyan, trapped Cu atoms are dark
blue, Al atoms are grey and the space above the slab is black.
We notice here that the copper is a key species to control the interfacial layer morphology. Notably, using this deposition simulation tool, we can evaluate the effect of the temperature on the nanostructuring of the interface. Authorizing the copper diffusion thanks to the temperature enables to control the thickness and the composition of the interfacial layer.
4. Conclusion
We describe a computationally-driven approach for the design of material to predict their microstructure and morphology during technological process using a multi-levels modeling strategy coupling DFT calculation to understand the local mechanisms occurring during the growth and kinetic Monte Carlo methodology to simulate
the deposition process. A thorough DFT study provides the necessary atomistic mechanisms to parameterize the kMC simulation tool able to perform larger simulations, comparable to experiments considering time and size scales, keeping reduced calculation costs. This kMC tool is used to conduct virtual experiments of the deposition in order to foresee the influence of the deposition parameters on final materials morphology towards a chemically controlled structure of materials and interfaces.
Here, we point out the diversity of the atomic scale diffusions associated to the complex chemistry encountered during the interface formation. In one hand the O atoms will slowly diffuse on the aluminum surface and form compact islands. From these islands, aluminum oxide nuclei will be formed. In the other hand, Cu atoms will diffuse quickly on the aluminum surface, and then preferentially diffuse in depth in the substrate. We show that these diffusions will be easier in rich copper zone, leading to rich Cu area inserted in depth in the aluminum substrate. Oxide nuclei are seen as birthplace for those rich copper zones, since oxide seeds are traps for Cu at the primary stages of the deposition. We also highlight that applying controlled technological parameters such as the temperature during the material deposition can lead to tailored interfaces: here thanks to the atomic scale investigation and the understanding of the local chemistry involved during the formation of the interface, we highlight that it is possible to control the interface formation by playing on the kinetics of the local chemical reaction through the applied temperature. In this study, we prove that developing the means to understand the matter organization and put it in close relation with external parameters are a promising way to control matter at the atomic scale toward dedicated macroscopic applications.
Acknowledgment
The computer simulations were performed using CALMIP resources (Grant 1418).
References
[1] Opila RL 2002 Prog. Surf. Sci. 69 125-63.
[2] Yang P and Tarascon JM 2012 Nat. Mater. 11 560.
[5] Gleiter H 1991 Nanocristalline Materials Advanced Structural and Functional Materials (Heidelberg 1991) Springer-Verlag Berlin p1-37.
[6] Rahman TS, Gosh C, Trushin O, Kara A and Karim A 2004 Proc. SPIE 5509 1. [7] Fichthorn KA and Lin Y 2013 J. Chem. Phys. 138 164104.
[8] Mašín M, Kotrla M, Yang B, Asta M, Jahma MO and Ala-Nissila T 2013 Eur. Phys. J. B 86 359. [9] Shirazi M and Elliott SD 2015 Nanoscale 7 6311-8.
[10] Shirazi M and Elliott SD 2013 Chem. Mater. 25 878-89
[11] El-Mellouhi F, Mousseau N and Lewis LJ 2008 Phys. Rev. B 78 153202.
[12] Béland LK, Brommer P, El-Mellouhi F, Joly JF and Mousseau N 2011 Phys. Rev. E 84 046704. [13] Hémeryck A, Estève A, Richard N, Djafari Rouhani M and Landa G 2009 Surf. Sci. 603 2132-7. [14] Deretzis I and La Magna A 2016 Phys. Rev. E 93 033304.
[15] Fischer SH and Grubelich MC 1996 A Survey of Combustible Metals, Thermites, and Intermetallics for
Pyrotechnic Applications 24th International Pyrotechnics Seminar (Monterey 1998) Sandia National Laboratories 1-58.
[16] Westwood WD 1988 MRS Bulletin 46-51.
[17] Blobaum, KJ., Wagner, AJ, Plitzko JM, Van Heerden D, Fairbrother DH and Weihs TP 2003 J. Appl. Phys. 94 2923.
[18] Lanthony C, Guiltat M, Ducéré JM, Verdier A, Hémeryck A, Djafari Rouhani M, Rossi C, Chabal Y and Estève A 2014 ACS Appl. Mater. & Interfaces 6 15086-97.
[19] Marín L, Warot-Fonrose B, Estève A, Chabal Y, Alfredo Rodriguez L and Rossi C 2016 ACS Appl. Mater. &
Interfaces 8 13104-13.
[20] Guiltat M, Brut M, Vizzini S and Hémeryck A 2017 Surf. Sci. 657 79-89.
[21] Lanthony C, Ducéré JM, Djafari Rouhani M, Hémeryck A, Estève A and Rossi C 2012 J. Chem. Phys. 137 094707.
[22] Kiejna A and Lundqvist BI 2001 Phys. Rev. B 63 085405. [23] Kresse G and Hafner J 1992 Phys. Rev. B 47 558–61.
[25] Kresse G and Furthmüller J 1996 Phys. Rev. B 54 11169. [26] Kresse G and Hafner J 1994 Phys. Rev. B 49 14251.
[27] Perdew JP, Burke K and Ernzerhof M. 1996 Phys. Rev. Lett. 77 3865. [28] Monkhorst HJ and Pack JD 1976 Phys. Rev. B 13 5188.
[29] Blöchl PE 1994 Phys. Rev. B 50 17953.
[30] Kresse G and Joubert D 1999 Phys. Rev. B 59 1758.
[31] Henkelman G, Uberuaga BP and Jónsson H 2000 J. Chem. Phys. 113 9901-4. [32] Stedman R and Nilsson G 1966 Phys. Rev. 145 492
[33] Kittel C Introduction to solid state physics, 8th Ed, Wiley India Pvt. Limited, 2007 p89-102. [34] Nastar M 2014 Phys. Rev. B 90 144101.
[35] Desorbo W and Turnbull D 1959 Phys. Rev. 115 560-3. [36] King D and Burke J 1970 Acta Metall. 18 205-10.
[37] Simmons RO and Balluffi RW 1959 Phys. Rev. 117 52-61. [38] Guérard B, Peisl H and Zitzmann R 1974 Appl. Phys. 3 37-43.
[39] Messina L, Nastar M, Garnier T, Domain C and Olsson P 2014 Phys. Rev. B 90 104203.
[40] Clouet E, Laé L, Épicier L, Lefebvre W, Nastar M and Deschamps A 2006 Nat. Mater. 5 482-8. [41] Politi P and Villain J 1996 Phys. Rev. B 54 5114-29.
[42] Marín L, Nanayakkara C, Veyran JF, Warot-Fonrose B, Joulie S, Estève A, Tenailleau C, Chabal Y and Rossi C 2015 ACS Appl. Mater. & Interfaces 7 11713-18.
[43] Benali A, Lacaze-Dufaure C and Morillo J 2011 Surf. Sci. 605 341-50.