Combustion Optimization in a Hydrogen-Enhanced Lean
Burn SI Engine
by
Joshua A. Goldwitz B.S., Mechanical Engineering
Massachusetts Institute of Technology, 2002 Submitted to the Department of Mechanical Engineering in Partial Fulfillment of the Requirements for the Degree of
Master of Science in Mechanical Engineering at the
Massachusetts Institute of Technology
M ,
May 7, 2004
C2004 Massachusetts Institute of Technology
All Rights Reserved
Signature of A uthor ... ...- ...
eepartme'nt of'M~chanicaI Engineedng
May 7, 2004
C ertified by ... ... .
John B. Heywood Sun Jae Professor of Mechanical Engineering Thesis Advisor
A ccepted by ...
Ain A. Sonin Professor, Department of Mechanical Engineering Chairman, Department of Graduate Committee
Combustion Optimization in a Hydrogen-Enhanced Lean
Burn SI Engine
by
Joshua A. Goldwitz
Submitted to the Department of Mechanical Engineering on May 7, 2004 in Partial Fulfillment of the Requirements for the Degree of Master of Science in
Mechanical Engineering
Abstract
Lean operation of spark ignition (SI) automotive engines offers attractive performance incentives. Lowered combustion temperatures inhibit NO, pollutant formation while reduced manifold throttling minimizes pumping losses, leading to higher efficiency. These benefits are offset by the reduced combustion speed of lean mixtures, which can lead to high cycle-to-cycle variation and unacceptable engine behavior characteristics. Hydrogen-enhancement can suppress the undesirable consequences of lean operation by accelerating the combustion process, thereby extending the "lean limit." Hydrogen can be produced onboard the vehicle with a plasmatron fuel reformer device.
Combustion optimization experiments focused on three key areas: the ignition system, charge motion in the inlet ports, and mixture preparation. The ignition system tests compared a standard inductive coil scheme against high-energy discharge systems. Charge motion experiments
focused on the impact of turbulence patterns generated by conventional restrictor plates as well as novel inlet flow modification cones. The turbulent motion of each configuration was
characterized using swirl and tumble flow benches. Mixture preparation tests compared a standard single-hole pintle injector against a fine atomizing 12-hole injector. Lastly, a further series of trials was also run to investigate the impact of high exhaust gas recirculation (EGR) dilution rates on combustion stability.
Results indicate that optimizations of the combustion system in conjunction with hydrogen-enhancement can extend the lean limit of operation by roughly 25% compared against the baseline configuration. Nearly half of this improvement may be attributed to improvements in the combustion sys' ..An inductive ignition system in conjunction with a high tumble-motion
inlet configuration leads to the highest levels of combustion performance. Furthermore,
hydrogen enhancement affects a nearly constant absolute improvement in the lean misfire limit regardless of baseline combustion behavior. Conversely, the amount of improvement in the point of peak engine NIMEP output is inversely related to the level of baseline performance.
Acknowledgements
Thinking back on the past two years, I am struck by just how many people have generously contributed their time, support, and resources toward helping me complete this thesis.
Firstly, I would like to thank Prof. John B. Heywood for his advising and guidance. In taking Prof. Heywood's internal combustion engines course as a MIT undergrad, I came to appreciate his extensive technical knowledge and became interested in further study within the field. Working alongside Prof. Heywood as a MIT graduate, I have been most touched by his professional integrity and deliberate demeanor. I hope to carry these same ideals with me as I now embark on my own career.
My other colleagues at MIT Sloan Lab have also contributed toward a tremendous experience. I
am grateful for the friendship and camaraderie I shared with Ziga Ivanic. From trying to get the EGR system to work to hanging out at the beach, there are too many memories to count. Mike Gerty and Jenny Topinka also made the plasmatron experience enjoyable; we really did make for an interesting group of characters. Special thanks to Ed Tully- besides laying the groundwork for my engine experiments, he has provided me with a lot of guidance and continued friendship. To all of the other Sloan Labbers too numerous to mention, thanks for everything...
Further appreciation goes to the MIT Plasma Science Fusion Center staff- Leslie Bromberg (I really thought the Mexican food in Albuquerque was pretty good,) Dan Cohn, and Alexander Rabinovich. ArvinMeritor has provided essential funding and support for this project and it will be very interesting to see how the firm takes plasmatron technology out of the lab and onto the roads. Our contacts at Arvin, including collaborators Rudy Smaling and Navin Khadiya, have provided us with vital "real world" perspective. A big debt of gratitude goes to Chris Thomas, Cliff Kratzet, and Tim Connolly (and Jeff and Ed) at the DaimlerChrysler Technical Center. I had a great time during my visit and the flow bench data I obtained has immeasurably
contributed toward my final conclusions. Ed Van Dyne of Adrenaline Research has been very generous in providing me with the use of one of his ignition systems and I also enjoyed our conversations on entrepreneurship and the business side of the auto industry. Carilee Cole of Delphi was kind in providing me with a fine-atomizing fuel injector. Her contribution came about through my participation in the MIT Engine and Fuels Research Consortium; I feel very fortunate to have participated in such a unique collaboration between academia and industry. In addition to all those aforementioned that rendered professional assistance, I am so lucky to have had the support of some of the best family and friends anybody could ever ask for. To my parents and sister, thank you for your unwavering love and guidance. My girlfriend Claire L6vy has also brightened these past two years in so many ways. Out of all the friends I have made in six years at MIT, the word "friend" probably doesn't do justice to Grant Kristofek, Karl
McLetchie, Miguel Ferreira, Vijay Divi, and the Castigliones. And to my guys from back home in Brooklyn- Anthony Capalbo, Jared Jagdeo, Jen Yim, Mike Stein, Petros Benias, Seth Rakoff, and Victor Buonocore, thanks for everything. We have had many great years and I look forward to many more to come.
Table of Contents
A b stract ... . 3
A cknow ledgem ents... 5
Table of C ontents... 7
L ist o f T ab les...1 1 L ist of F igures... . 13
Chapter 1: Introduction and Background...17
1.1 Advanced Automotive Powerplants...17
1.2 Hydrogen-Enhanced Lean Bum SI (HLSI) Concept...17
1.2.1- Homogeneous Charge Lean Bum Cycle...18
1.2.2- Hydrogen Enhancement...18
1.2.3- High Compression Ratio/ Boosted Operation...19
1.2.4- Optimized Combustion System...19
1.2.5- High EGR Tolerance...19
1.2.6- Performance Summary...20
1.3 Plasmatron Fuel Reformer...20
1.4 HLSI System Architecture...22
1.5 Combustion Optimization...23
1.5.1- Benefits of Optimized Combustion...23
1.5.2- Ignition System ... 23
1.5.3- Charge Motion Control...24
1.5.4- Mixture Preparation...25
1.6 Mixture Characterization...26
1.6.1- Excess Air Ratio (Lambda) ... 26
1.6.2- Thermal Dilution Parameter (TDP) ... 26
1.7 Project O bjectives...27
Chapter 2: Engine Setup and Test Apparatus...29
2.1 E ngine O verview ... 29
2.2 Fuel System ... 30
2.2.1- Indolene System...30
2.2.2- Reformate Gas System...31
2.3 E G R System ... 32
2.4 Ignition System s... 33
2.4 .1- D en so 580 ... 33
2.4.2- Adrenaline Research Plasma...33
2.4.3- M SD D igital 7 Plus...34
2.5 Charge Motion Control Devices...35
2.5.1- Restrictor Plates...35
2.8 Engine Data Management...40
2.8.1- Airflow Measurement...40
2.8.2- Lambda Measurement...41
2.8.3- In-Cylinder Pressure Measurement...41
2.8.4- EGR Measurement...41
2.8.5- Temperature Measurement...42
2.8.6- Engine Position Sensing...42
2.8.7- D ata A cquisition...42
2.9 Analysis Software...43
2.10 Flow B ench Testing...44
2.10.1- Fixturing... 44
2.10.2- Sw irl B ench... 45
2.10.3- Tumble Bench...45
Chapter 3: Experimental Structure...47
3 .1 F low B ench ... 47
3.1.1- Test Configurations...47
3.1.2- Sw irl B ench... 48
3.1.3- Tumble Bench...48
3.2 Engine Test Conditions...49
3.2.1- L ean O peration ... 49
3.2.2- E G R O peration...49
3.3 Reference Engine Configuration...49
3.4 Lean Experiments...50
3.4.1- Ignition Tests... 50
3.4.2- Charge Motion Control Tests...51
3.4.3- Mixture Preparation Test...51
3.4.4- C om posite T est...51
3.5 EGR Experiments...51
Chapter 4: Results and Discussion...53
4 .1 F low B ench ... 53
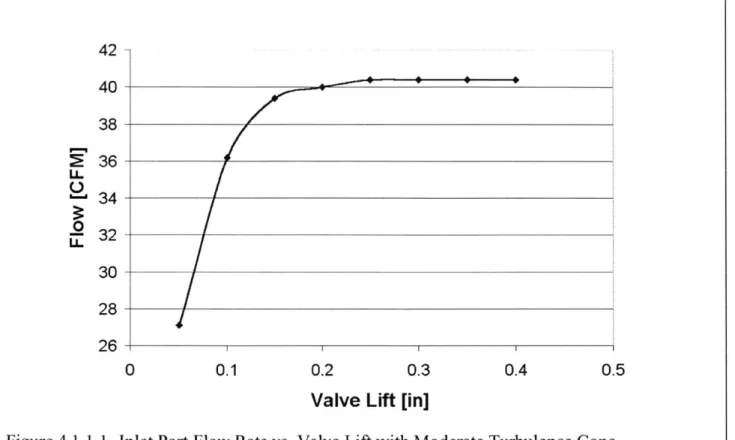
4.1.1- General Observations...53
4.1.2- Swirl Findings...54
4.1.3- Tumble Findings...54
4.1.4- Valve Deactivation Emulation Analysis...55
4.1.5- Active Valve Impact Analysis...55
4.2 D ilution L im its... 62
4.2.1- M isfire L im it... 62
4.2.2- C O V Lim it... 62
4.3 Lean Experimental Results...64
4.3.1- Ignition Findings...64
4.3.2- Charge Motion Control Findings...65
4.3.3- Mixture Preparation Findings...67
4.3.4- Com posite Findings...68
4.3.5- Trend Analysis...69
4.4 EGR Experimental Results...85
4.5 T D P C orrelation ... 89
Chapter 5: C onclusions... 93
R eferences ... 9 5 A pp endix ... . 99
List of Tables
Table 1.2.6- Summary of HLSI Parameters...20
Table 1.3.1- Ideal and Typical Plasmatron Characteristics...21
Table 1.3.2- Combustion Characteristics of Different Fuels...21
Table 2.1- Ricardo/Volvo Engine Specifications...29
Table 2.2.1- Chevron Phillips UTG-96 Specifications...31
Table A.1- Flow Bench Testing Results...99
List of Figures
Figure 1.2.2- 0-10% Lean Mixture Bum Speed with Different Fractions of H2 Addition...19
Figure 1.4- Boosted HLSI System Schematic...22
Figure 1.5.3- Swirl and Tumble In-Cylinder Motion...25
Figure 2.1- Modified Volvo B5254 Head...30
Figure 2.2.2- Plasmatron Energy Flow Schematic...32
Figure 2.3- EGR System Schematic...33
Figure 2.4.2- Adrenaline Research Plasma Ignition Circuit Topology...34
Figure 2.5.1.1 -Inlet Restrictor Plates on Inlet Manifold of Nissan 1.8L 1-4 Engine...36
Figure 2.5.1.2- Inlet Port Restrictor Plates...36
Figure 2.5.2.1 -Extreme Turbulence Inlet Port Cone...37
Figure 2.5.2.2- Moderate Turbulence Inlet Port Cone...38
Figure 2.5.2.3- Port Deactivation Inlet Port Cone...38
Figure 2.5.2.4- Tum ble Inlet Port Cone...39
Figure 2.7- Ricardo/Volvo Engine Test Cell Schematic...40
Figure 2.10.1- Volvo B5254 Head Fixtured on SuperFlow 1020 Swirl Bench...45
Figure 4.1.1.1 -Inlet Port Flow Rate vs. Valve Lift with Moderate Turbulence Cone...57
Figure 4.1.1.2- Normalized (to Flow Rate) and Absolute Swirl Torque vs. Valve Lift with M oderate Turbulence Cone...57
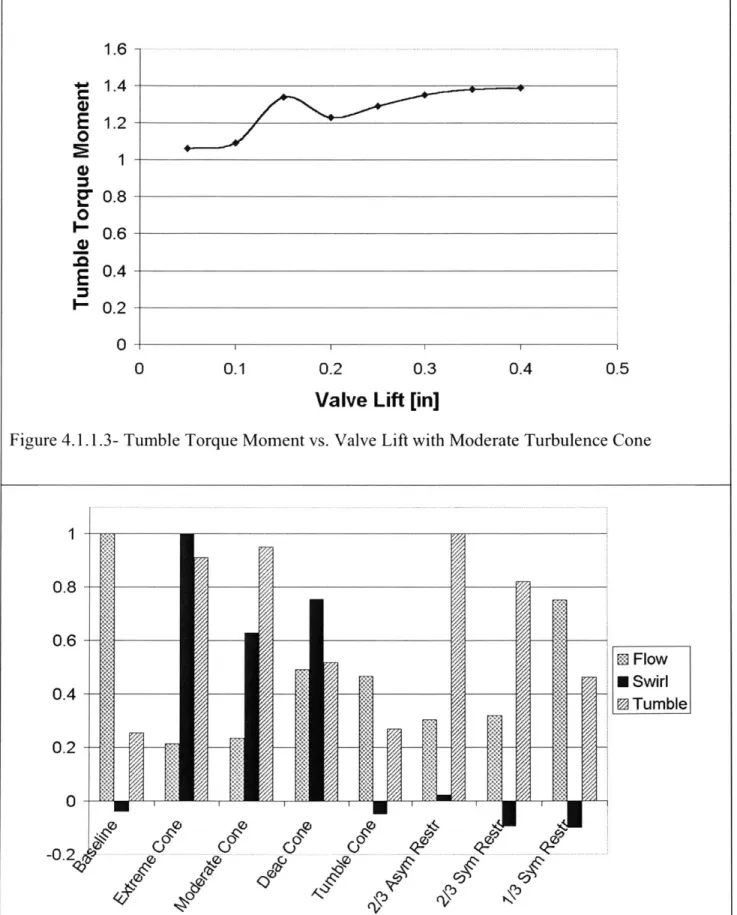
Figure 4.1.1.3- Tumble Torque Moment vs. Valve Lift with Moderate Turbulence Cone...58
Figure 4.1.2- Inlet Port Flow Rate, Normalized (to Flow Rate) Swirl Torque, and Tumble Torque Moment Plotted on a Normalized Scale for Various Inlet Configurations (0.350 in V alve Lift)... ... 58
Figure 4.1.4.1 -Inlet Port Flow Rate vs. Valve Lift with Baseline Head and Right Valve Deactivated vs. Port Deactivation Cone and Both Valves Active...59
Figure 4.1.4.2- Normalized Swirl Torque vs. Valve Lift with Baseline Head and Right Valve Deactivated vs. Port Deactivation Cone and Both Valves Active...59
Figure 4.1.4.3- Tumble Torque Moment vs. Valve Lift with Baseline Head and Right Valve Deactivated vs. Port Deactivation Cone and Both Valves Active...60
Figure 4.1.5.1- Inlet Port Flow Rate vs. Valve Lift with Extreme Turbulence Cone Comparing Both Valves Active vs. Right Valve Deactivated...60
Figure 4.1.5.2- Normalized Swirl Torque vs. Valve Lift with Extreme Turbulence Cone Comparing Both Valves Active vs. Right Valve Deactivated...61
Figure 4.1.5.3- Tumble Torque Moment vs. Valve Lift with Extreme Turbulence Cone Comparing Both Valves Active vs. Right Valve Deactivated...61
Figure 4.2- Three Critical Lean Limit Operating Points Depicted on NIMEP and COV of NIMEP vs. Lambda Plots (Extreme Turbulence Cone with 20% Enhancement) ... 63
Figure 4.3.1.1- Ignition Results 1: Reference (Denso 580 Ignition) vs. Adrenaline Research Ignition at Low Energy (CD) and High Energy (DE) Settings with 0 and 20% E nhancem ent...72 Figure 4.3.1.2- Ignition Results 2: Reference (Denso 580 Ignition) vs. Adrenaline Research
Figure 4.3.1.3- Ignition Results 3: Reference (Denso 580 Ignition) vs. Adrenaline Research Ignition at Low Energy (CD) and High Energy (DE) Settings with 0 and 20% E nhancem ent...73 Figure 4.3.1.4- Ignition Results 4: Reference (Denso 580 Ignition) vs. Adrenaline Research
Ignition at Low Energy (CD) and High Energy (DE) Settings with 0 and 20% E nhancem ent...73 Figure 4.3.1.5- Ignition Results 5: Reference (Denso 580, 0.035 in Plug Gap) vs.
Denso 580, 0.070 in Gap and MSD Ignition, 0.035 in or 0.070 in Gap with
0 and 20% Enhancem ent... 74 Figure 4.3.1.6- Ignition Results 6: Reference (Denso 580, 0.035 in Plug Gap) vs.
Denso 580, 0.070 in Gap and MSD Ignition, 0.035 in or 0.070 in Gap with
0 and 20% Enhancem ent...74
Figure 4.3.1.7- Ignition Results 7: Reference (Denso 580, 0.035 in Plug Gap) vs. Denso 580, 0.070 in Gap and MSD Ignition, 0.035 in or 0.070 in Gap with
0 and 20% Enhancem ent...75
Figure 4.3.1.8- Ignition Results 8: Reference (Denso 580, 0.035 in Plug Gap) vs. Denso 580, 0.070 in Gap and MSD Ignition, 0.035 in or 0.070 in Gap with
0 and 20% Enhancem ent...75
Figure 4.3.2.1- Chg. Motion Results 1: Reference (2/3 Asymmetric Restrictor Plate) vs. Extreme Turbulence, Moderate Turbulence, and Port Deactivation Cones with
0 and 20% Enhancem ent...76
Figure 4.3.2.2- Chg. Motion Results 2: Reference (2/3 Asymmetric Restrictor Plate) vs. Extreme Turbulence, Moderate Turbulence, and Port Deactivation Cones with
0 and 20% Enhancem ent...76
Figure 4.3.2.3- Chg. Motion Results 3: Reference (2/3 Asymmetric Restrictor Plate) vs. Extreme Turbulence, Moderate Turbulence, and Port Deactivation Cones with
0 and 20% Enhancem ent...77
Figure 4.3.2.4- Chg. Motion Results 4: Reference (2/3 Asymmetric Restrictor Plate) vs. Extreme Turbulence, Moderate Turbulence, and Port Deactivation Cones with
0 and 20% Enhancem ent...77
Figure 4.3.2.5- Chg. Motion Results 5: Reference (2/3 Asymmetric Restrictor Plate) vs.
Tumble Cone and Baseline Unrestricted Head with 0 and 20% Enhancement...78 Figure 4.3.2.6- Chg. Motion Results 6: Reference (2/3 Asymmetric Restrictor Plate) vs.
Tumble Cone and Baseline Unrestricted Head with 0 and 20% Enhancement...78 Figure 4.3.2.7- Chg. Motion Results 7: Reference (2/3 Asymmetric Restrictor Plate) vs.
Tumble Cone and Baseline Unrestricted Head with 0 and 20% Enhancement...79 Figure 4.3.2.8- Chg. Motion Results 8: Reference (2/3 Asymmetric Restrictor Plate) vs.
Tumble Cone and Baseline Unrestricted Head with 0 and 20% Enhancement...79 Figure 4.3.3.1- Mixture/ Composite Results 1: Reference (Bosch Injector) vs. Delphi
Injector and Delphi Injector + Extreme Cone (Extreme Cone Only also Shown)
with 0 and 20% Enhancem ent... 80
Figure 4.3.3.2- Mixture/ Composite Results 2: Reference (Bosch Injector) vs. Delphi Injector and Delphi Injector + Extreme Cone (Extreme Cone Only also Shown)
Figure 4.3.3.3- Mixture/ Composite Results 3: Reference (Bosch Injector) vs. Delphi Injector and Delphi Injector + Extreme Cone (Extreme Cone Only also Shown) w ith 0 and 20% Enhancem ent...81 Figure 4.3.3.4- Mixture/ Composite Results 4: Reference (Bosch Injector) vs. Delphi
Injector and Delphi Injector + Extreme Cone (Extreme Cone Only also Shown) w ith 0 and 20% Enhancem ent...81 Figure 4.3.5.1- Normalized (to Flow Rate) Swirl Torque vs. Lambda at Lean Misfire Limit
and Peak NIMEP Limit without Plasmatron Enhancement...82 Figure 4.3.5.2- Normalized (to Flow Rate) Swirl Torque vs. Lambda at Lean Misfire Limit
and Peak NIMEP Limit with 20% Plasmatron Enhancement...82 Figure 4.3.5.3- Tumble Torque Moment vs. Lambda at Lean Misfire Limit and Peak NIMEP
Limit without Plasmatron Enhancement...83 Figure 4.3.5.4- Tumble Torque Moment vs. Lambda at Lean Misfire Limit and Peak NIMEP Limit with 20% Plasmatron Enhancement...83 Figure 4.3.5.5- Absolute Shift in Lambda from Peak NIMEP Limit without Enhancement to
Peak NIMEP Limit with 20% Enhancement vs. Peak NIMEP Limit without
E nhancem ent ... 84
Figure 4.3.5.6- Absolute Shift in Lambda from Lean Misfire Limit without Enhancement to Lean Misfire Limit with 20% Enhancement vs. Lean Misfire Limit without
E nhancem ent ... 84 Figure 4.4.1- EGR Results 1: Engine Out-NOr vs. EGR Fraction at Low Load
(3.5 bar NIMEP) and High Load (5.2 bar NIMEP) Conditions with 0, 15, and 30%
E nhancem ent...87 Figure 4.4.2- EGR Results 2: COV of NIMEP vs. EGR Fraction at Low Load
(3.5 bar NIMEP) and High Load (5.2 bar NIMEP) Conditions with 0, 15, and 30%
E nhancem ent...87 Figure 4.4.3- EGR Results 3: 0-10% Burned Interval vs. EGR Fraction at Low Load
(3.5 bar NIMEP) and High Load (5.2 bar NIMEP) Conditions with 0, 15, and 30%
E nhancem ent...88 Figure 4.4.4- EGR Results 4: 10-90% Burned Interval vs. EGR Fraction at Low Load
(3.5 bar NIMEP) and High Load (5.2 bar NIMEP) Conditions with 0, 15, and 30%
Enhancem ent... 88
Figure 4.5.1- COV of NIMEP vs. TDP at Lean-Diluted and Low (3.5 bar NIMEP) and High
(5.2 bar NIMEP) Load EGR-Diluted Conditions with Varied Fractions of
Enhancem ent... 90
Figure 4.5.2- 0-10% Burned Interval vs. TDP at Lean-Diluted and Low (3.5 bar NIMEP) and High (5.2 bar NIMEP) Load EGR-Diluted Conditions with Varied Fractions of Enhancem ent... 90
Figure 4.5.3- 10-90% Burned Interval vs. TDP at Lean-Diluted and Low (3.5 bar NIMEP) and High (5.2 bar NIMEP) Load EGR-Diluted Conditions with Varied Fractions of E nhancem ent... 91
Figure 4.5.4- Correlation of Experimentally Obtained Low and High Load EGR-Diluted Data Points (EGR Fraction) and Lean-Diluted Data Points (Equivalence Ratio,
Chapter 1: Introduction and Background
1.1 Advanced Automotive Powerplants
After more than 100 years of research and development, the internal combustion engine (ICE) remains the powerplant of choice for nearly all automobiles on the road. Based upon the spark
ignition (SI) Otto cycle or the compression ignition (CI) Diesel cycle, the ICE has proven to be a reliable and efficient choice with unmatched power to weight efficiency.
In recent years, there has been a shift toward exploring new technologies that will bring greater fuel efficiency with reduced emissions. The need for such developments has taken on a greater sense of urgency in light of tightening emissions regulations (Euro V / EPA 2007) and the double-digit growth of automobile sales in developing markets such as China. Some powertrain concepts, such as hydrogen-powered fuel cells, represent a fundamental paradigm shift. Others, such as hybrid-electrics, clean Diesels, or the hydrogen-enhanced lean burn SI (HLSI) system to be explored in this thesis leverage established ICE technology.
HLSI is a unique solution that addresses the competing demands of future vehicle powerplants. By coupling the efficiency of a lean burn SI operating cycle with the emissions benefits of
homogeneous lean combustion, it is possible to achieve low consumption and minimized environmental impact. Most importantly, HLSI is a realistic near-term solution that builds upon mature engine technology, utilizes the existing gasoline infrastructure, and is completely
transparent to the vehicle operator.
1.2 Hydrogen-Enhanced Lean Burn SI (HLSI) Concept
HLSI merges familiar powerplant technology with a new type of hydrogen reforming device to
deliver high efficiency with low emissions. The system combines several attributes to address relevant technological challenges and successfully meet high-level performance goals.
1.2.1- Homogeneous Charge Lean Burn Cycle
The HLSI system is built around a homogeneous charge lean burn cycle. A homogeneous
mixture (typical of a SI engine,) encourages more complete and uniform combustion, minimizing unburned hydrocarbon emissions (HC). Lean burn provides further benefits by reducing peak combustion temperatures. This discourages the highly temperature-dependent NO, formation mechanism, helping to further curb emissions. Additionally, a lean cycle (typical of a CI engine) provides a cycle efficiency benefit by reducing pumping losses [1]. This comes from the fact that lean engines admit higher amounts of air to combust a given amount of fuel, requiring a
corresponding increase in inlet manifold air pressure (MAP).
Combustion of a lean air-fuel mixture presents several challenges. There is a marked decrease in the laminar flame speed of a typical hydrocarbon at high lambda values. At a certain lambda value, the mixture will reach a point of inflammability and a spark discharge will no longer be able to initiate a propagating flame kernel. CI engines and stratified charge SI engines address this issue by initiating combustion in locally rich pockets within an inhomogeneous mixture that is globally lean. The problem with this approach is that NO, formation rates will still be high in the areas of rich combustion and incomplete combustion of the rich pockets encourages HC emissions. In order to preserve the NOr-inhibiting characteristics of true lean combustion, it is necessary to combust a homogeneous mixture. This can be facilitated through the use of hydrogen enhancement.
1.2.2- Hydrogen Enhancement
Hydrogen has a fast laminar flame speed and can be used to enhance the combustion
characteristics of lean hydrocarbon-air mixtures. As early studies have clearly indicated [2, 3], hydrogen addition offsets the slow burning tendencies of lean mixtures (Figure 1.2.2), promoting greater combustion speed and stability. Hydrogen enhancement makes it possible to operate a lean burn engine at higher lambda values than can be achieved with non-enhanced mixtures. Hydrogen can be generated onboard the vehicle in a plasmatron fuel reformer device. Inside this reformer, a continuous plasma arc is used to partially oxidize a rich gasoline-air mixture.
60 55 50 45 > 40 .~35 30 25 20 C 15 10 1 1.2 1.4 1.6 1.8 2 2.2 Lambda
Figure 1.2.2- 0-10% Lean Mixture Bum Speed with Different Fractions of H2 Addition [4] 1.2.3- High Compression Ratio/Boosted Operation
Hydrogen enhancement provides a further benefit to the HLSI system. Research at MIT [5] has demonstrated that hydrogen addition has a knock-inhibiting effect, promoting a higher effective fuel octane rating. Enhancement with 15% of the gasoline reformed roughly corresponds to an effective octane number increase of 10 over the baseline hydrocarbon. This could allow for an increase of roughly two compression ratio units. Furthermore, this knock resistance makes the enhanced engine ideally suited to inlet boosting. The combination of a boosted manifold and/or a higher compression ratio could allow for a more efficient, downsized displacement engine [6].
1.2.4- Optimized Combustion System
In order to extract the full potential of the HLSI system, optimization of the combustion system is necessary. This thesis explores various types of ignition systems, inlet port motion control devices, and fuel injectors to determine the best performing parameters. As the results will show, combustion system design complements hydrogen enhancement by affecting large changes in the lean misfire limit and combustion speed.
1.2.5- High EGR Tolerance
-.-kH2 Add = 10% Equiv -W-H2 Add = -- A i 20% Equiv __ ~H2 Add = 30% Equiv - Indolene O nly - --- ---
--of unburned HC while also lowering combustion temperatures to inhibit NO, formation.
Additionally, EGR increases the mass flow rate through the cylinder, reducing pumping losses. However, high concentrations of recirculated exhaust can also drastically slow combustion speed, similar to the excess air dilution of lean operation. The improved flame speeds that accompany hydrogen enhancement offset this tendency, increasing EGR tolerance.
1.2.6- Performance Summary
A table has been prepared to summarize the performance goals of the HLSI system and which
specific attributes address each goal (Table 1.2.6).
Table 1.2.6- Summary of HLSI Parameters
Goal Design Feature
High Efficiency Lean Cycle, Possible Downsizing/ Boosting, High EGR Tolerance Extended Lean Limit Hydrogen Enhancement, Optimized Combustion System
Low HC Emissions Homogeneous Charge, High EGR Tolerance
Low NOX Emissions Lean Stoichiometry, Homogeneous Charge, High EGR Tolerance
Knock Resistance Hydrogen Enhancement
1.3 Plasmatron Fuel Reformer
The plasmatron fuel reformer is the key new technology in the HLSI system. The device is being developed at the MIT Plasma Science and Fusion Center (MIT PSFC). It uses a continuous plasma arc discharge to partially oxidize a rich hydrocarbon-air mixture in an exothermic reaction (Equation 1.3.1).
CmH, +m-(02 + 3.773N 2) -> mCO+ n H2 + m -3.773N2 (1.3.1)
2 2 2
This reaction represents the theoretical ideal; in actual operation, there are small amounts of H20 and CO2also present in the reformate gas (Table 1.3.1).
Table 1.3.1- Ideal and Typical Plasmatron Characteristics
Parameter Ideal Plasmatron Typical Plasmatron
H2 25% 20% CO 26% 22% N2 49% 51% CO2 0% 2% H20 0% 4% HC 0% < 1%
Fuel Conversion Efficiency 84% 76.5%
It is important to note the presence of significant quantities of CO in the reformate gas. Although
CO does not have a very fast laminar flame speed (Table 1.3.2), it does have desirable octane
enhancing effects similar to hydrogen [5].
Table 1.3.2- Combustion Characteristics of Different Fuels [7]
Fuel Flame Speed (100'C, 1 atm) Spontaneous
Stoichiometric Maximum Ignition
Temp. ['C]
Isooctane 57.8 58.2 447
N-Heptane 63.8 63.8 247
Hydrogen 170.0 325.0 572
Carbon Monoxide 28.5 52.0 609
The plasmatron reformer will require an energy supply to power the plasma discharge. Consumption should be on the order of 5-6 MJ/kg H2. Much work is being undertaken to improve the energy conversion efficiency, qpas, of the reformer (Equation 1.3.2) as this parameter directly impacts the overall energy conversion efficiency of the aggregate system.
7in, -LHVH2 + thco -LHVcO
thplas -Hnolene -L HV
(1.3.2)
where rhx indicates mass flow rate and LHVJ indicates lower heating value.
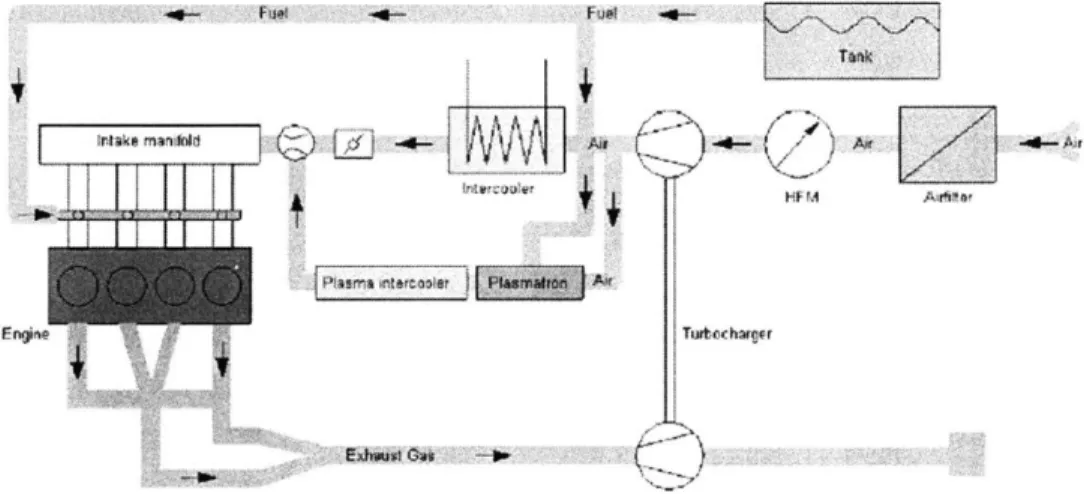
1.4 HLSI System Architecture
In the HLSI system, the majority of the gasoline (typically 70-90%) is injected into the inlet ports much as it would be in a conventional SI powertrain. The balance is routed through the
plasmatron reformer device where it is converted to hydrogen-rich reformate gas. This reformate is then introduced into the engine intake system several critical lengths upstream of the inlet ports to assure homogeneous mixing. Typically, hot reformate will pass through a plasma
intercooler en route to the inlet manifold to help maintain charge efficiency. In this system schematic (Figure 1.4), a turbocharger and charge intercooler are also depicted. This is representative of the probable downsized and boosted implementation.
--V
(~)
Figure 1.4- Boosted HLSI System Schematic1z I
1.5 Combustion Optimization
By improving the combustion performance of the HLSI system as much as possible, the greatest
emissions and efficiency benefits will result. There are a number of techniques available for improving combustion performance and several will be explored in this thesis.
1.5.1- Benefits of Optimized Combustion
As discussed earlier, reliable combustion of lean air-fuel mixtures is difficult because of
problems with inflammability and low laminar flame speed. An optimized combustion system is one that addresses these challenges as effectively as possible and may be characterized by:
" Reliable Combustion- Low incidence of misfire or partial burn cycles
* Low Variability- Acceptably low fluctuation of cycle to cycle NIMEP (low COV)
" Fast Burning- Short mass fraction burned intervals (ex- 0-10%, 10-90%)
" Extended Lean Limit- Peak of NIMEP and misfire limits occur at high lambda values
Each of these characteristics is required, respectively, to achieve:
" Compliance with emissions standards
" Acceptably smooth engine performance and drivability
" High efficiency and consequent output (faster burn approaches constant-volume ideal) " Maximized benefits of lean operation
In particular, within the lean operating regime, the properties of an optimized combustion system help to offset the slow burning and difficult to ignite tendencies of lean mixtures. This
complements and extends the effects of hydrogen enhancement.
1.5.2- Ignition System
In a SI engine, the ignition system is needed to initiate a propagating flame kernel within the air-fuel mixture. This is accomplished by means of an electrical breakdown, which heats a small
specialized systems, a more efficient capacitor-based circuit topology may be used. The
discharge characteristics of these two systems is somewhat different; capacitor based systems are able to achieve higher peak discharge currents and voltages while inductive systems tend to have longer discharge time constants. Some capacitor-based "multistrike" ignition systems are able to discharge more than one spark per engine cycle. Careful consideration must be given to the geometry of the spark plug electrodes. A higher number of electrodes provides more breakdown paths to ground (although only one is taken per discharge event,) however, these also provide more pathways for heat loss.
Prior research [8, 9] has suggested that lean combustion performance is best when a platinum-tipped thin-electrode "J" type plug is used in combination with an inductive coil ignition. This has been attributed to the minimized heat-losses of a thin-electrode plug [10] and the longer spark duration of coil ignitions, which is required to ignite lean mixtures [11].
1.5.3- Charge Motion Control
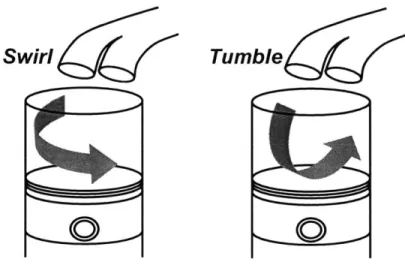
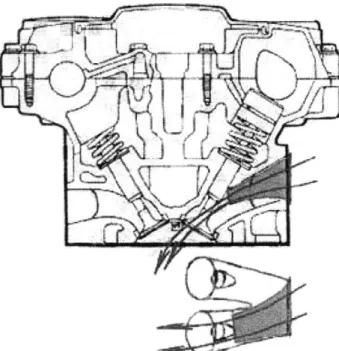
In-cylinder flow behavior of the air-fuel charge has a large impact on combustion performance. This impact is magnified under difficult high-dilution combustion conditions, where localized turbulence near the spark plug gap impacts flame kernel initiation [12] and broader turbulence characteristics affect laminar flame speed [13]. In-cylinder charge motion may be broadly
characterized as either swirling or tumbling (Figure 1.5.3). Swirl motion describes rotation of the flow about an axis along the cylinder bore and is encouraged by introducing the charge with a tangential velocity component. Tumble is a barrel rolling flow pattern that tends to roll from the
inlet ports down to the piston crown; introducing the charge with a large velocity component perpendicular to the cylinder axis may encourage this. One study [14] found that tumble motion
generates higher levels of turbulent intensity than swirl, although excessive tumble could also lead to flame extinction in localized areas. Prior work at MIT has shown that enhanced charge motion can stabilize combustion in the lean regime [2]. Other lean combustion studies have reached similar conclusions, with swirl and/or tumble motion being used to extend the lean misfire limit [15, 16]. Enhanced charge motion can also improve stoichiometric combustion and various techniques have been employed in production engines [17, 18] to effectively generate turbulent flow behavior. Inlet valve deactivation schemes and asymmetrical inlet port geometry
promote swirl while high-included angle combustion chambers and active charge motion control plates promote tumble.
Swirl
Tumble
Figure 1.5.3- Swirl and Tumble In-Cylinder Motion
1.5.4- Mixture Preparation
Although the HLSI system is designed to work with homogeneous mixtures, a perfectly
homogeneous mixture cannot be attained in real-world conditions. The challenge of evaporating and diffusing the injected gasoline becomes even more critical in the lean regime. One of the most difficult conditions for creating a homogeneous mixture is during cold start, when the engine ports are far below steady state operating temperature. In this case, liquid gasoline does not evaporate as readily and small liquid droplets will persist, leading to high levels of unburned
HC emissions. One of the most effective solutions is to create finer droplets of fuel spray. In
direct injection fuel systems, this can be accomplished by increasing injection pressure. In low-pressure port-injected combustion systems such as HLSI, the approach is to use fine-hole
injectors that replace a single pintle hole with as many as twelve laser-drilled orifices. While the benefits of fine-atomizing injectors under startup conditions are clear, the advantages at steady state are less certain. Earlier research [19] has suggested that fuel atomization may not be a limiting factor of steady state lean combustion performance.
1.6 Mixture Characterization
In working with diluted air-fuel mixtures, it is important to characterize the level of dilution with an appropriate parameter. Two different approaches, excess air ratio (lambda) and thermal dilution parameter (TDP), are used in the course of this thesis.
1.6.1- Excess Air Ratio (Lambda)
Lambda is a widely used parameter that describes the relative richness or leanness of an air-fuel mixture (Equation 1.6.1).
2 = (A(A / F)c (1.6.1)
(A / F)stoiciorneric
where A/F is the ratio of air and fuel mass flow rates. Stoichiometric operation is the condition where there is precisely enough air present to allow for complete oxidation of the fuel. In lean operation, there is a surplus of air in the air-fuel mixture, thus 2> 1. Lambda is easily measured
using a universal exhaust gas oxygen (UEGO) sensor.
Each fuel has a unique stoichiometric A/F ratio (AFR). For pure indolene (a type of gasoline,) this ratio is 14.6. In a mixture of air and several different fuels, the stoichiometric AFR of the overall mixture is the weighted average of the AFR values of the constituents. Adding
plasmatron reformate to air-indolene mixtures lowers the overall stoichiometric AFR because the reformate gas component has a lower stoichiometric AFR than indolene.
1.6.2- Thermal Dilution Parameter (TDP)
TDP (Equation 1.6.2.1) was developed [2] to characterize the thermal properties (Equation
1.6.2.2) of air-fuel mixtures diluted by diluents such as plasmatron reformate or recycled
exhaust. Since thermal properties largely govern combustion behavior, TDP is an effective means for comparing different dilute mixtures. In particular, it should be noted that lambda does not effectively describe EGR diluted mixtures since operating conditions may be stoichiometric. Conversely, TDP provides a useful measure of EGR dilution:
TDP = AT"ll indolenestoichiometric (1.6.2.1) ATdiluted mixture where, i *LHV; AT= (1.6.2.2) Mtotal * v
A Tis the chemical energy per unit heat capacity (dilution) of the mixture, i is a species in the
diluted air-fuel mixture, LHV represents lower heating value (energy density) and C, is the molar heat capacity.
1.7 Project Objectives
This thesis focuses on the combustion improvement aspect of the HLSI system. A series of experiments is conducted to evaluate the impact of different ignition systems, charge motion control devices, and fuel injectors on HLSI combustion performance. In particular, by combining flow bench data with combustion data, it is possible to achieve new understanding of the impact of tumble and swirl motion on combustion performance. Additionally, tests are run at very high EGR rates to examine the effects of hydrogen enhancement on an alternate high-dilution
approach. By correlating EGR dilution with lean dilution using the TDP parameter, it is possible to extrapolate the lean combustion system results to very dilute EGR operation.
Subsequent chapters in the thesis will describe the engine and testing apparatus used in the experimental program, followed by details of the testing procedure. Then, the results of both the flow bench and engine based tests will be presented and discussed. Finally, a series of concise conclusions will highlight the key findings and recommendations. The results of this thesis will help HLSI to achieve the leanest possible operation, reducing emissions while maximizing
Chapter 2: Engine Setup and Test Apparatus
2.1 Engine Overview
Experiments were conducted in the MIT Sloan Automotive Laboratory using a specially
prepared single-cylinder research engine (Table 2.1). The block is a Ricardo Hydra MkIII while the head is a modified Volvo B5254 (a single cylinder segment of an original inline five cylinder head.) The Volvo head has four valves with a centrally located spark plug and pentroof
combustion chamber geometry (Figure 2.1). The engine cranks an Eaton 6000 series air-cooled dynamometer. During startup, the dynamometer motors the engine; then the fuel is triggered, at which point the unit automatically transitions to a power-absorbing mode.
Table 2.1- Ricardo/Volvo Engine Specifications
Displacement [cm3] 487
Clearance Volume [cm-] 54
Bore [mm] 83
Stroke [mm] 90
Connecting Rod Length [mm] 158
Compression Ratio 10.1
Valvetrain DOHC, 4V
Inlet Valve Timing IVO 00 ATDC, IVC 600 ABDC
Exhaust Valve Timing EVO 680 BBDC, EVC 80 ATDC
Engine control is accomplished with a MoTeC M4 engine control unit (ECU) model 9806. The
ECU is connected to a computer running the MoTeC engine management program v. 4.22. This
software allows for real-time adjustment of spark timing with single crank angle degree (CAD) resolution and fuel injection pulse-width adjustment with 0.03 msec precision.
Figure 2.1- Modified Volvo B5254 Head (note pressure transducer hole drilled through side of combustion chamber)
A thermostat-regulated coolant circuit provides thermal management of the engine. During
startup, the coolant is run through a heating circuit that brings the coolant up to steady state operating temperature (- 88 C). Once the coolant has reached this operating temperature, the
thermostat selectively engages a water-water heat exchanger circuit that uses city water to chill the coolant as needed.
The test engine is also equipped with an exhaust gas recirculation (EGR) system (that the author helped to fabricate and test) as well as a compressor-fed induction system to allow boosted operation (not used for this thesis.)
2.2 Fuel System
The HLSI engine is equipped with two types of fuel systems; one for liquid gasoline and the other for plasmatron reformate gas.
2.2.1- Indolene System
The chosen liquid gasoline blend used for this project is indolene (UTG-96), a standard research fuel (Table 2.2.1). A constant 40 psi supply pressure is maintained in the fuel lines. Indolene injection occurs in the inlet port with the fuel injector spraying downward toward the valves. The end of the injection pulse is timed to 385 CAD BTDC.
Table 2.2.1- Chevron Phillips UTG-96 Specifications [20]
Lower Heating Value [MJ/kg] 43.1
Molar H/C Ratio 1.93
Carbon Weight [%] 86.5
Hydrogen Weight [%] 13.5
Research Octane Number 96.1
Motor Octane Number 87
Anti-Knock Index (R+M)/2 91.6
2.2.2- Reformate Gas System
In the absence of a working plasmatron reformer, bottled reformate gas mixed to the ideal plasmatron outlet specification by BOC Gases (Table 1.3.1) was used. Reformate mass flow is
metered using a critical flow orifice [4] operating in a choked condition. The reformate gas is introduced into the inlet manifold several critical lengths upstream of the inlet valves, assuring homogeneous mixing.
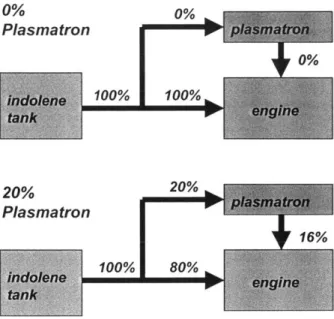
Reformate gas concentration is measured in terms of a "plasmatron fraction" or "enhancement fraction" (i.e.- 0%, 10%...) This is defined as the amount of reformate gas that would be generated by diverting the said mass fraction of indolene through the reformer device (Figure 2.2.2). Thus, a 20% plasmatron fraction indicates the amount of reformate gas that would be generated by routing 20% of the indolene flowing out of the tank through the plasmatron reformer device. Assuming 80% energy conversion efficiency in the reformer, this means that 4% of the total indolene energy flow extracted from the tank is lost. Thus, comparing 0% plasmatron operation with 20% plasmatron operation, there is less indolene injected at the 20%
operating point because some of the indolene is substituted for by an equivalent amount of reformate gas.
0% 0% Plasma tron
100% 100%
inM -X hhb
Figure 2.2.2- Plasmatron Energy Flow Schematic (Assumes 80% Plasmatron Energy Conversion Efficiency)
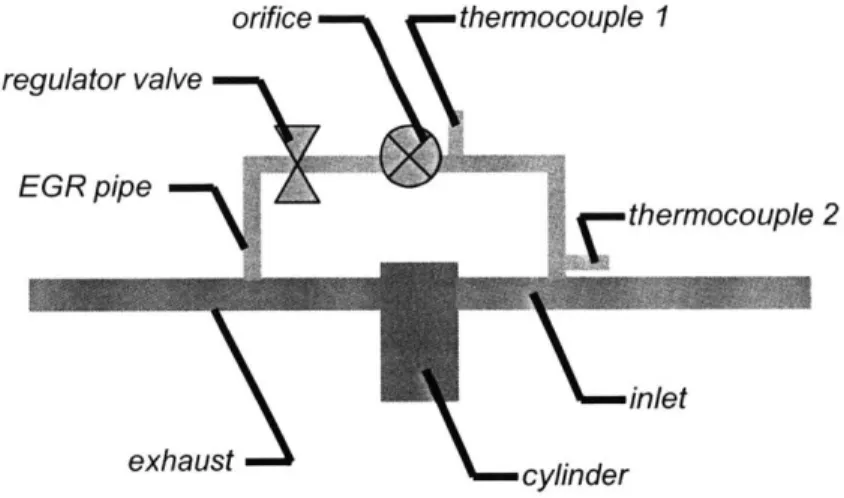
2.3 EGR System
An external EGR system (Figure 2.3) was designed and installed to allow for testing of high EGR dilution operating points. This system is fabricated from temperature resistant in flexible steel piping. Exhaust gas is tapped 8 in downstream of the cylinder head and reintroduced to the inlet manifold 17 in upstream of the cylinder head. A gate valve allows regulation of the pressure drop through the pipe, providing control of EGR flow rate. Provision is also made for insertion of a series of custom made orifices that allow further restriction of EGR flow rate. Although no EGR heating or cooling system is fitted, a pair of thermocouples monitoring exhaust gas
temperature through the line provide assurance that temperatures remain high enough to prevent condensation.
orifice thermocouple I regulator valve EGR pipe thermocouple 2 inlet exhaust cylinder
Figure 2.3- EGR System Schematic
2.4 Ignition Systems
A series of three different ignition systems was tested to evaluate HLSI combustion response.
These systems cover the spectrum from a typical OEM-spec inductive coil based ignition to a high-energy capacitor based plasma discharge scheme.
2.4.1- Denso 580
The Denso 580 system represents a typical high quality OEM ignition. This coil near plug design is used on the LS1 V8 engine that powers the Chevrolet Corvette. The coil is triggered directly from the MoTeC ECU by a 5 V TTL falling trigger signal with 5.1 msec dwell. The Denso system is used in conjunction with a fine tip Bosch platinum spark plug with standard "J" geometry. Gap width on the stock plug is 0.035 in, however tests were also run with a modified plug that is opened up to a 0.070 in gap (and corresponding increase in TTL trigger signal dwell to 5.8 msec.)
2.4.2- Adrenaline Research Plasma
This system was provided by Adrenaline Research, Inc. and is actually an early prototype of their patented SmartFire ignition. SmartFire is capable of providing ionization-sensing
energy CD mode discharges a single capacitor to provide output similar to a coil ignition. High-energy DE mode discharges both capacitors to provide a strong plasma discharge characteristic.
A multi-strike MS mode discharges both capacitors at 1 ms intervals, providing multiple sparks
and delivering the greatest amount of energy. The system uses a custom coil that mounts directly on the spark plug. The electronics unit is triggered from the MoTeC ECU by a 5 V TTL rising trigger signal with 5.1 msec dwell and is connected to the coil with a custom multicore MIL-spec wiring harness. Customized Champion resistor-less projected-gap type spark plugs are used, with a central electrode surrounded by four grounding electrodes.
Primary Capacitor
2.4.3- SDHDigia.Spark 7p
520535V o tePrimary ieo=h giinci.Sakeeryi pt 97Jadtesse
Source
Ionization Analysis
Circuitry Secondary
Battery Power Source
(-I 00Vo-1 2V)
Figure 2.4.2- Adrenaline Research Plasma Ignition Circuit Topology [2 1
2.4.3- MSD Digital 7Pius
Digital 7 Plus is a high-performance capacitive discharge ignition system primarily targeted for racing applications. The controller unit incorporates a IGBT coil driver and can deliver
520-535 V to the primary side of the ignition coil. Spark energy is up to 190 mJ and the system
operates in a multistrike mode below 3300 rpm (tests for this thesis were run at 1500 rpm) with a 20 CAD interval between discharges. The MoTeC ECU triggers the controller with a 5 V TTL falling trigger signal with 2.9 msec dwell and this in turn drives a MSD HVC 11 ignition coil. This coil is capable of delivering 45 kV peak voltage and 2 A peak current and is connected to the spark plug using a custom-fabricated Magnecor wire. The MSD ignition is used in
conjunction with the same Bosch platinum J-plugs as the reference Denso ignition at standard
2.5 Charge Motion Control Devices
This thesis required methods for creating substantial variations in charge motion with minimal modifications to the baseline research engine. The necessity of quick changes to different configurations and the reality of simultaneous engine sharing with other students precluded any alterations to the head or valvetrain. Instead, two inlet port-based solutions were used to provide both major modifications to in-cylinder flow as well as ease of use.
2.5.1- Restrictor Plates
Ed Tully, who ran the initial series of experiments exploring the potential of hydrogen enhanced
lean bum operation [2], started work with restrictor plates. The purpose of a restrictor plate is to partially obstruct the inlet ports to enhance turbulence. This can largely be attributed to two mechanisms:
" Flow must accelerate through the restriction, leading to increased velocity and turbulent
intensity
* Geometry of obstruction can help direct the flow into a particular region of the inlet port, encouraging swirl and/or tumble
Movable restrictor plates are already used in certain production engines (Figure 2.5.1.1), however they are opened up at higher load/speed conditions to maximize flow rate and reduce the penalty on volumetric efficiency. For simplicity, the restrictor plates used in this project are fixed and held into place when the inlet pipe is bolted onto the head. All test points run for this thesis were conducted at the low load/speed conditions where restrictor plates are most effective.
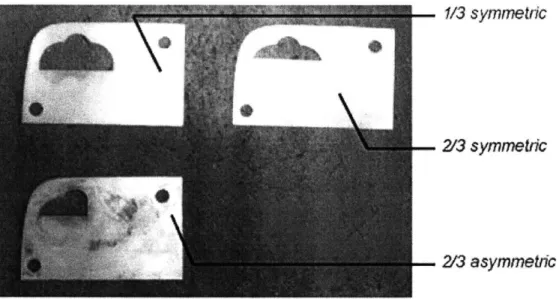
Ed Tully tested three different restrictor plate geometries (Figure 2.5.1.2) and settled on a 2/3
obstructed asymmetrical plate as the best performer. The lower portion of the port is blocked off to encourage flow high in the port, which can lead to increased tumble. The asymmetry might also lead to a differential in flow rate through the left and right inlet valves, introducing some amount of swirl motion. The placement of the plate does not impinge on the fuel injector spray cone.
Figure 2.5.1.1 - Inlet Restrictor Plates (Closed Position) on Inlet Manifold of Nissan 1.8L 1-4
Engine (Note Servo Motor Connected to Actuation Shaft)
1/3 symmetric
2/3
symmtric
213
asymmetric
Figure 2.5.1.2- Inlet Port Restrictor Plates
2.5.2- Inlet Port Cones
While restrictor plates are easy to design and simple to fabricate, there are limitations to the amount of flow control they can provide. The flow must still travel several inches to reach the inlet ports after passing through the restrictor and this would make it impossible to, as an
example, reliably send all of the flow through a single inlet valve. The inlet port cone device was created to allow even more precise flow management without sacrificing the ease of use of a restrictor plate. Fabricated from cut and rolled stainless steel, the cones plug into the inlet ports through the side of the head and effectively reshape the internal geometry of the inlet ports. The
cones are held in place by a flange that wraps around the edge of the cone inlet opening, which gets clamped to the head when the inlet pipe is bolted on.
Four different cones were created (Figures 2.5.2.1-4):
" Extreme Turbulence- All flow is directed through the left valve, moderately high and as
far outside in the port as possible. Intended to generate extreme swirl and high tumble. * Moderate Turbulence- All flow is directed through the left valve, very high and close to
the outside. Intended to generate moderate swirl and high tumble.
" Port Deactivation Cone- Designed to simulate a valve deactivation scheme, this cone
brings all of the flow through the left port but does not try to restrict the flow any further.
" Tumble Cone- Brings flow through both valves with equal horizontal port dispersion but
directed as high in the port as possible. Intended to create pure tumble without swirl.
As flow bench testing would reveal, the actual turbulent behavior of some of the cones turned out to be quite different from what was intended.
-6l -~I/1A
Figure 2.5.2.2- Moderate Turbulence Inlet Port Cone
Figure 2.5.2.4- Tumble Inlet Port Cone
In an effort to try to minimize the aforementioned velocity effects of a restriction device, three of the cones maintain a roughly 6 : 1 area reduction ratio (inlet area : outlet area). In contrast, the port deactivation cone has a 2.5: 1 ratio that is naturally defined by the geometry of the Volvo
head, which has the same reduction from the large single opening in the side of the head down to the smaller entry to either of the two inlet ports. By minimizing flow velocity effects, it is
possible to focus on the geometry of each cone and how this influences in-cylinder motion.
2.6 Fuel Injectors
Two different fuel injectors were used during the course of experiments. The reference injector is a Bosch EV 1.3a single-hole pintle type injector. This injector is characterized by a conical spray pattern that captures 90% of the flow within a 300 cone. As an alternative, a prototype 12-hole Delphi injector was used. The finer holes of this injector lead to finer fuel atomization. Similar to the Bosch reference injector, the Delphi injector delivers 90% of the flow within a 29' cone. It is also worth noting that the smaller end-diameter of the Delphi injector causes it to sit roughly
the MoTeC ECU injector calibration mode, which fires the injector for several hundred pulses to allow accurate weighing of the fuel mass injected at different pulse widths.
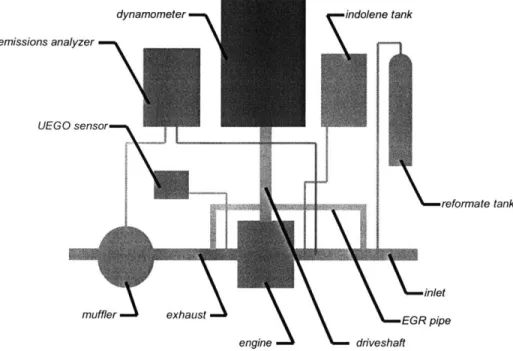
2.7 Test Cell Configuration
A schematic (Figure 2.7) indicates the layout of critical systems in the test cell.
emissions analyzer UEGO sensor muffler exhaust
\-inlet
EGR pipe driveshaftFigure 2.7- Ricardo/Volvo Engine Test Cell Schematic
2.8 Engine Data Acquisition
A number of sensing and detection systems were used to monitor various engine parameters and
provide the data necessary to drive the Sloan Laboratory burn rate analysis program, which in turn provides combustion results.
2.8.1- Airflow Measurement
Air volume flow rate is measured by an Omega PX 140 differential pressure sensor, which measures the flow pressure drop through a Ricardo Viscous Flow Meter Model #280-150779.
indolene tank
This measurement is taken upstream of the stepper motor controlled throttle. Downstream of the throttle, an Omega PX 176 device (0-50 psi range) measures manifold air pressure (MAP).
2.8.2- Lambda Measurement
A Horiba MEXA- 11 OX wideband universal exhaust gas oxygen (UEGO) analyzer is used to
provide real-time measurement of the excess air ratio (lambda). The sensing probe is located roughly 8 in downstream of the exhaust valve seats. As a check, lambda values are also calculated based upon measured air and fuel flow rates and typical agreement is within 3%.
2.8.3- In-Cylinder Pressure Measurement
In-cylinder pressure data is obtained from a Kistler Model 6125A piezoelectric pressure
transducer, mounted in a hole drilled through the side of the cylinder combustion chamber. The transducer is protected by a flame-arrestor and is calibrated using a dead weight tester. Signal level amplification is provided by a Kistler Type 5010 charge amplifier, which provides enough gain to match the sensitivity of the data acquisition system. Real-time monitoring of the pressure trace is provided by a Tektronix TDS3 10 digital oscilloscope or custom LabVIEW application.
2.8.4- EGR Measurement
Two different techniques are used to monitor EGR flow rate. Both operate on the principle of measuring the concentration of exhaust gas species in the inlet manifold. Both NO, and CO2 are found in high concentrations in the exhaust gas but nearly zero concentrations in fresh inlet air.
By measuring NO, or CO2 concentrations in both the inlet manifold (downstream of EGR introduction, to allow time for mixing) and the exhaust muffler, it is possible to determine the fraction of EGR (Equation 2.8.4)
NO CO2
EGR = x,''let -100 or, EGR = 2,inlet .100 (2.8.4)
NOexhaust CO2,exhaust
At higher load test conditions (5.2 bar NIMEP), NOx measurement using a California Analytical Instruments Model 400-HCLD chemiluminescent analyzer is used to evaluate EGR fraction. At
sampling impossible because the manifold vacuum exceeds 3.85 psig. For these tests, a Horiba
MEXA-554JU automotive emissions analyzer connected in series with a Varian type 949-9451
booster pump is used to measure CO2 concentrations.
2.8.5- Temperature Measurement
A number of Omega K-type thermocouples are installed at various locations around the engine to
allow for thermal sampling of key working fluids including:
* Inlet Air * Exhaust * Coolant * Oil
* Recycled Exhaust Gas
2.8.6- Engine Position Sensing
The engine is equipped with three different devices to sense positional information. A crank angle encoder produces a square wave with each pulse corresponding to 1 CAD rotation (360 pulses/ complete crank revolution.) An additional sensor mounted along the axis of the
crankshaft provides a pulse every time the piston passes through BDC. Finally, half of the circumferential edge of one of the camshaft sprockets is widened to intermittently pass through an optical sensor. Depending upon whether or not the sensor is obstructed, the device indicates if the crank is rotating through the first or second rotation of a given engine cycle.
2.8.7- Data Acquisition
A customized interface box designed by Prof. Wai K. Cheng of the MIT Sloan Automotive
Laboratory is used to integrate engine position information with the in-cylinder pressure signal. The box suppresses the BDC signal at the start of the exhaust stroke and passes the BDC compression signal onwards, also superimposing this 5V step onto the pressure trace. The BDC compression, pressure, and cranxk angle traces are then interfaced to the data acquisition computer using a National Instruments BNC-2090 interface board. On the computer, data acquisition is managed by National Instruments LabVIEW v5.1 (later v6.1) software. Pressure
data is sampled once per CA (360 samples/ revolution = 9 kHz @ 1500 rpm), triggered by the
crank angle signal. The BDC compression signal is used to signal the start of each engine cycle.
2.9 Analysis Software
The MIT Sloan Automotive Laboratory burn rate analysis code is used to post-process engine pressure data in order to calculate key engine operating parameters. Inputs for the code include the recorded pressure trace, engine geometry data, heat transfer coefficients, and ambient
atmospheric conditions. The algorithm recognizes the start of each new engine cycle by the BDC compression signal that is superimposed on the pressure trace. By integrating the P-V data, the code outputs both gross and net indicated mean effective pressure (GIMEP and NIMEP) as well as information on peak cycle pressure and the crank position at peak pressure. Furthermore, the code monitors engine stability by calculating COV (Equation 2.9.1) of each of the calculated parameters and noting any occurrences of misfires or partial burn cycles (where peak cycle pressure does not exceed 20% of the average for a complete sample set.) Additionally, a heat transfer model [22] allows for the calculation of bum rate and mass fraction burned profiles.
CO Vparameter =
(
paramete (2.9.1)"""""" (parameter ) / n
where parameter is the standard deviation of the parameter over the entire sample set, parameter
is the parameter value for the ith cycle, and n is the total number of cycles in the sample set. At each measurement point, a 300 cycle sample set of pressure data is recorded. Each of these cycles is then processed individually. The recorded value for each combustion parameter is the mean of the values for each of the individual cycles in the sample set. NIMEP (Equation 2.9.2) is the preferred parameter of engine output as it incorporates the cycle pumping losses.
2.10 Flow Bench Testing
The various charge motion control devices used in this experimental program were constructed using informed assumptions. Each one was rendered based upon a best guess of what type of geometry would induce the desired amounts of turbulent motion. In order to provide a rigorous assessment of the actual charge motion that each device generated, flow bench testing was conducted at the DaimlerChrysler Technical Center in Auburn Hills, MI. This facility has a dedicated flow-testing lab equipped with benches to measure both swirl and tumble. Most importantly, highly knowledgeable experts with decades of combined experience were on hand to provide valuable insight and guidance.
2.10.1- Fixturing
The head used in the flow tests is a Volvo B5254 identical to the one fitted on the Ricardo research engine at the Sloan Laboratory. To adapt the head to the SuperFlow flow benches, a custom 86 mm diameter bore adapter was machined from aluminum. This adapter has holes drilled to exactly match the bolt pattern of the Volvo head. The inlet port was fitted with a flared horn (Figure 2.10.1) normally used for testing the DaimlerChrysler 2.4L 1-4 engine because the section of this horn is a nearly perfect match to the section of the Volvo port. The horn bolts onto the head using the same bolt pattern as the normal inlet manifold. The restrictor plates and inlet cones are held in place by the compression of the bolted horn, much as they are held in place by the compression of the bolted inlet pipe on the research engine.
In order to actuate the valves during flow tests, the stock valve springs are replaced with lighter springs. A custom fixture holding two micrometers is then bolted onto the head such that the micrometers are positioned to directly depress the valves. In this way, the lift of each valve may be independently adjusted with thousandth inch accuracy.
Figure 2.10.1- Volvo B5254 Head Fixtured on SuperFlow 1020 Swirl Bench (Note Flared Inlet Horn and Valve Actuation Micrometers)
2.10.2- Swirl Bench
A stock SuperFlow 1020 swirl bench was used to evaluate swirl turbulence. This bench provides
a suction that draws air through the inlet ports into the combustion chamber. The flow travels down the bore adapter and passes through a hexagonal screen that is connected to a torque sensor. Any swirling motion in the flow will exert a torque on the screen, which can be measured as an indication of swirl intensity. Furthermore, the bench provides an indication of the flow rate through the head.
2.10.3- Tumble Bench
A customized SuperFlow bench was used to evaluate tumble motion. This bench operates
similarly to the swirl bench, drawing air into the ports and down through a hexagonal screen. A tumble moment is determined, although the exact tumble measurement methodology is
![Figure 1.2.2- 0-10% Lean Mixture Bum Speed with Different Fractions of H 2 Addition [4]](https://thumb-eu.123doks.com/thumbv2/123doknet/14380564.505973/19.918.201.712.114.424/figure-lean-mixture-bum-speed-different-fractions-addition.webp)