COMPARATIVE COST ANALYSES OF ALTERNATIVE WASTEWATER STABILIZATION LAGOONS IN BRAZIL
By
CHRISTIAN CABRAL
Bachelor of Science in Civil Engineering
School of Civil Engineering, Mackenzie University (1997)
Submitted to the Department of Civil and Environmental Engineering In Partial Fulfillment of the Requirements for the Degree of
MASTER OF ENGINEERING
IN CIVIL AND ENVIRONMENTAL ENGINEERING
At the
MASSACHUSETTS INSTITUTE OF TECHNOLOGY
June 1999
©1999 Christian Cabral All rights reserved
The author hereby grants to M.I.T. permission to reproduce and distribute publicly paper And electronic copies of this thesis document in whole or in part
Signature of the Author
Department of Civil and Erivironmental Engineering May 13, 1999
Certified by
Professor Donald R. F. Harleman Ford Professor Emeritus of Civil and Environmental Engineering Thesis Supervisor Certified by e by Susan Murcott Research Affiliate Thesis Supervisor Accepted by Andrew J. Whittle Profe r of Civil and Environmental Engineering
MASSACHUSETT airman, Committee for Graduate Studies
COMPARATIVE COST ANALYSES OF ALTERNATIVE WASTEWATER STABILIZATION LAGOONS IN BRAZIL
By
CHRISTIAN CABRAL
Submitted to the Department of Civil and Environmental Engineering on May 7, 1999 in partial fulfillment of the requirements for the degree of Master of Engineering in Civil
and Environmental Engineering
Abstract
The future of the privatization of wastewater systems in Brazil will be decided in the next few years. The use of innovative technologies, such as Chemically Enhanced Primary Treatment (CEPT), will only be possible with private participation in future concessions of wastewater system. This thesis describes the possible savings of using CEPT for the upgrading of a wastewater treatment plant (WWTP) in Tatui, Brazil, through concessions. It is shown that the appropriate implementation of Tatui's WWTP with private participation will only be feasible with the creation of an effective regulatory framework and specific federal allocation of responsibilities for the water services.
The study contrasts the present legal background regarding privatization of water services and the expected policy requirements. To examine the CEPT upgrading alternatives for Tatui, costs are compared and the investment is analyzed in a concession scenario using several financial criteria.
It has been found that although CEPT could be an effective solution to the WWTP design, private participation still involves high investment risk. This thesis also describes the next steps for the transition from state administration of water services to municipal/private implementation, management and operation.
Thesis Supervisor: Donald R. F. Harleman
Acknowledgments
I would like to dedicate this Thesis to my advisors Professor Harleman and Susan
Murcott, without whose astute advice and tireless efforts this thesis could not have been
written
I also would like to thank my family, Alexandra P. Gaspar, and my dearest friends
Frederic Chagnon, Domagoj Gotovac and Joiozinho Andarilho for their support and
TABLE OF CONTENT
CHAPTER 1 - INTRODUCTION... 9
CHAPTER 2 - BRAZIL BACKGROUND ... 10
NATIONAL CHARACTERISTICS ... 10
W ATER AND SANITATION ... 10
S A N IT A T IO N ...--... 12
HEALTH IN BRAZIL ... 13
HISTORY OF SANITATION IN BRAZIL ... 14
CHAPTER 3 - ADMINISTRATION STRUCTURE AND LEGISLATION...17
ORGANIZATION OF THE W ATER AND SANITATION SECTOR... 17
State Environmental Companies (Cesbs) ... 17
M unicipal Services ... 19
F IN A N C IN G ... 19
PRESENT LEGISLATION CONCERNING PRIVATIZATION AND CONCESSION (LAW 8666/93)... 20
POLICY AND REGULATION REQUIREMENTS (W ORLD BANK) ... 23
D ISC U S S IO N ... 2 5 CHAPTER 4 - CONCESSION OF WATER AND SEWER SERVICES ... 32
THE PRIVATIZATION PROCESS ... 32
CONCESSIONS OF WATER SERVICES IN BRAZIL... 33
Cities Concession Investment Description ... 35
CHAPTER 5 - FINANCIAL ANALYSIS OF CEPT IN TATUI... 45
IN T R O D U C T IO N ... 4 5 M ETHODS FOR COST COMPARISONS ... 45
THE DESIGN ALTERNATIVES FOR UPGRADING TATUI'S WWTP... 47
Total Capital Cost for Alternatives A 1, A2 and A3 ... 50
Construction Budget... 53
Operational and M aintenance Costs ... 55
CONCESSION ANALYSIS FOR TATUI... 60
CHAPTER 6 - SUMMARY AND CONCLUSION... 62
SUM M ARY... 62
CONCLUSION... 63
APPENDIX A ... 66
APPENDIX B ... 67
A PPENDIX C ... 84
Concession Arrangem ents: Legal, Financial, and Regulatory Issues...100
Build-Operate-Transfer Arrangements: Legal, Financial, and Regulatory Issues...100
Management Contracts: Legal, Financial, and Regulatory Issues ... 101
APPENDIX D ... 103
APPENDIX E ... 110
THE TATUI W ASTEW ATER TREATM ENT SYSTEM 1992 REPORT... 110
A PPENDIX F ... 115
APPENDIX G ... 119
LIST OF TABLES
Table 2-1: Urban and rural connections to water supply in Brazil...11
Table 2-2: Evolution of Water Connections in Urban Areas... 11
Table 2-3: Number of Connections per Region...12
Table 2-4: Percentages of connections to yard tap in different Regions ... 12
Table 2-5 Child Mortality Rate (per 1000)... 14
Table 2-6 Child Mortality due to Sanitary Conditions (1985/90) ... 14
Table 3-1 Price Categories of bids according to Law 8666/93...22
Table 3-2 Aspects of Cesbs required participation in bids ... 25
Table 4-1: Water and Sewage Concession ... 34
Table 4-2: Limeira Water and Wastewater Concession ... 37
Table 4-3: Ribeira Preto Sewage Concession... 38
Table 4-4: Result of Concession Agreement Analizys... 43
Table 5-1: Design areas and depths of Al, A2 and A3 ... 50
Table 5-2 Construction Costs for Al, A2 and A3 ... 52
Table 5-4: Optimum dosage of iron-salts chosen for the A2 treatment...57
T able 5-5: O & M for A 2 ... 58
Table 5-6: Optimum dosage of iron-salts chosen for the A3 treatment...59
T able 5-7: O & M for A 3 ... 59
Table 5-8: PV, IRR and PP for Al, A2 and A3...61
Table A-1: Price of base consumption (R$/10m3) for all Cesbs...66
Table B-1: World Bank web page :Toolkit 3 (http://www.worldbank.org/html/fpd/wstoolkits/Kit3/frame.html)...84
Table B-2: Risk Allocation on Privatization Processes according to the World Bank.... 87
Table D-1: Limeira concession of water and wastewater system... 103
Table D-2: Present agreement of Limeira's concession ... 104
Table D-3: Concession alternative number 2 for Limeira's agreement, with an initial investm ent of R $80 m illion. ... 105
Table D-4: Concession Alternative 2 for Limeira agreement with wastewater tariff redu ced 7 0 % ... 10 6 Table D -5: Ribeira Preto Sewage Concession... 107
LIST OF FIGURES
Figure 6-1: Schematic of the existing treatment and the area distribution of WWTP
C E A G E S P ... 1 156
Figure 6-2: Schematic of the alternative Al treatment and the area distribution...1167
Figure 6-3: Schematic of the alternative A2 treatment and the area distribution ... 1178
Chapter 1 - Introduction
The purpose of this theses is to present Chemical Enhanced Primary Treatment (CEPT)
as an effective mean to upgrade lagoon treatment systems, specifically when applied
through a concession of the wastewater treatment plant of growing municipalities. To
accomplish it, an overview of the present situation of the water and sanitation sector, and
an analysis of the regulatory framework of Brazil privatization process is described. The
history and case studies of concession in the Country are presented as a mean to
compare public and private administration of water services. Besides the required policy
regulation for a successful concession of water and wastewater system, the financial
analyzes of three upgrading alternatives for Tatui City's overloaded wastewater
treatment plant is presented. This financial analysis relies on the comparison of some
investment parameters: present value, payback period, benefit-cost ratio and internal rate
of return. The result is a regulation framework and a cheaper budget for Tatui's
Chapter 2 - Brazil Background
National Characteristics
In terms of land area, Brazil is the biggest country in South America and the fifth largest
in the world. It has the tenth GNP in the world. The population of Brazil is around 160
million inhabitants, ten percent located in the Greater Sio Paulo area.
The country is divided in five Macro Regions: North, Northeast, South, Southeast, and
Midwest. The cultural, economic and social differences between these Regions are huge.
Whereas the Northeast Region is the poorest in sanitation and water services, the South
and Southeast Regions are the most developed. The greatest urban population densities
occur in Southeast cities such as Sio Paulo and Rio de Janeiro. Therefore, in this study
of the water and sanitation condition in Brazil I will present comparisons between
Southeast and Northeast Regions as examples of statistic ranges in the Country.
In Brazil 31.5 million households are located in urban areas and 7.5 in rural areas
(Gazeta Mercantil, 1998). The deficit in water and especially sanitation services in
Brazil is mainly related to the migration of consumers from rural areas to the cities.
From 1960 until 1990, the number of city households increased by 20 million while in
the rural areas, the increase was only 400 thousand.
-Water and Sanitation
It is important to notice that in most of the Brazilian Regions water problems are mainly
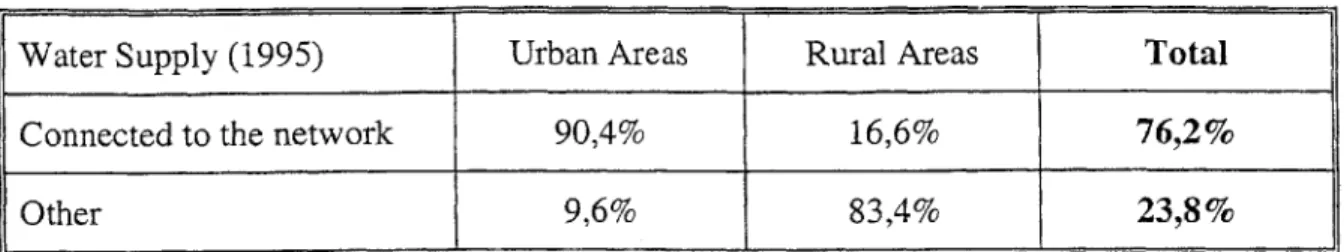
connection to water supply is related to public health and regional development. Table
2-1 shows the significant difference between urban and rural connections to water
supply in Brazil
Table 2-1: Urban and rural connections to water supply in Brazil
Water Supply (1995) Urban Areas Rural Areas Total
Connected to the network 90,4% 16,6% 76,2%
Other 9,6% 83,4% 23,8%
Source: FIBGE, PNAD (1995), And "Panorama Setorial" (Sectorial Panorama)
Regarding the evolution of water connections in the Country, despite the great increase
in urban connections, it still cannot supply the population growth and migration. Table
2-2 shows how the percentage of connections evolved in the last few decades.
Table 2-2: Evolution of Water Connections in Urban Areas
Source: FIBGE, PNAD (1995), And "Panorama Setorial" (Sectorial Panorama)
As mentioned before, the distribution of water services varies per region. Table 2-3
Table 2-3: Number of Connections per Region
Source: PNAD (1993/955), And "Panorama Setorial" (Sectorial Panorama)
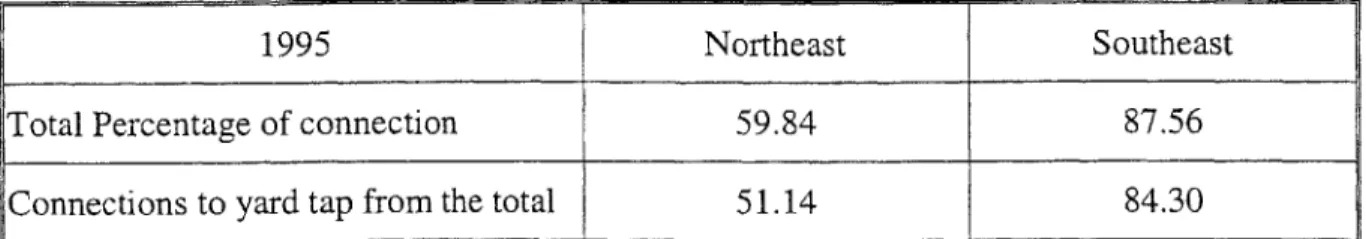
As presented in Table 2-4, another characteristic of the variety of level of consumers in
the country is the percentage of households with one tap (yard tap)
Table 2-4: Percentages of connections to yard tap in different Regions
1995 Northeast Southeast
Total Percentage of connection 59.84 87.56
Connections to yard tap from the total 51.14 84.30
Source: PNAD (1993/955), And "Panorama Setorial" (Sectorial Panorama)
An important difference in water services for the Southeast and the Northeast is the
percentage of connections in the city core compared to the suburb area. In some cities in
the Northeast region the ratio between suburb and city connection can be 0.50 while in
the Southeast region it is in the range of 0.75 to 0.91.
Sanitation
Despite the increase in sewage collection in Brazil in the last few years, the percentage
well as the average.
Table 2-5: Sewage Collection
Region 1993 1995
Northeast 5,64% 5,11%
Southeast 66,31% 69,58%
Brazil 38,66% 39,54%
Source: FIBGE, PNAD (1995), And "Panorama Setorial" (Sectorial Panorama)
Unfortunately, sewage collection percentage is not related to wastewater treatment. In
most cities, less than 10% of the wastewater collected is treated.
Health in Brazil
Studies show that investments between US$1 and US$4 in water and sanitation can save
from US$4 to US$10 in health care (Gazeta Mercantil, 1998). Brazil 58 nation in the
World Ranking for Quality of Life (UN) .One percent of improvement in water and
sanitation for low income population reduces more than 6% in child mortality
(Environmental Engineering Congress 1997, IPEA). Almost two thirds of hospitalizations in Brazil are of children under 10 years old with diseases related to
water. Ten million Brazilians are presently infected with schistosomiases.
Child mortality is one of the most important parameters for the evaluation of water and
sanitary services in developing countries. Table 2-6 shows the reduction of child
Table 2-6 Child Mortality Rate (per 1000)
Region 1960/70 1994
Northeast 151,18 63,10
Southeast 100,24 26,40
Brazil 116,94 40,00
Source: Inquiry and Research Directory FLBGE, PNAD (1995), And "Panorama Setorial" (Sectorial Panorama)
Table 2-7 presents the percentage of child mortality due to inadequate water condition,
and inadequate water and sanitation condition.
Table 2-7 Child Mortality due to Sanitary Conditions (1985/90)
Adequate Service of Inadequate Service of
Region Water & Sanitary Water & Sanitary Sanitary only
Northeast 20,3% 89,6% 51,9%
Southeast 23,2% 50,8% 49,9%
Brazil 21,9% 59,1% 38,1%
Source: "Diagnostico do Setor Saneamento," (Sanitary Sector Diagnosis) PMSS series, Vol. 7 , Elaborated by IPEA/CPS, and "Panorama Setorial" (Sectorial Panorama)
History of Sanitation in Brazil
In the beginning of 19th century water was supplied through springs and sewage was collected in tanks in some cities. Around 1830 fountains were installed in the center of
liters jars called "barrilote" in the main cities for the health of consumers. In the last two
decades of the nineteenth century, epidemic diseases infected major cities especially
during summer and autumn. It was the beginning of federal investments in
infrastructure. As a result, in 1900 the first federal environmental companies were
created. Meanwhile, in the beginning of the century, population growth and urban
migration increased the importance of small municipalities.
During the Second World War, USA made the first international investment in
infrastructure through the Public Health Special Service (SESP). This investment
focused in Brazilian regions where military supplies were being produced for the USA
(for example: rubber, quartz, mica). Since then, many other international loans started
financing sanitary projects through international banks and agencies (for instance,
Interamerican Development Bank, USAID and UNICEF). In 1964, after the military
coup, the Nation started a centralization process that lasted for more than two decades.
During the military dictatorship, all national and international investments had to be
made through the federal government. By that time, a sequence of several governmental
organizations and foundations were being created, restructured and inactivated,
replacing and reorganizing the water service financing system. The most important
governmental financing organ created was the Sanitary National Plan (Planasa), in 1969.
Planasa's main responsibility was to create sanitary state companies in order to organize
the allocation of loans. During the turning of the decade, Planasa had already set up and
invested in 238 municipalities and created 27 State Environmental Agencies (Cesbs),
through its worst period. During that decade, the average income per capita has
decreased 0,4% (Silva, 1996) slowing down the pace of the water and sanitary
development.
Most of the concession agreements granted to Cesbs in the 1970's are about to expire in the next few years. After the concession period, municipalities will have to decide whether to administer their own water system or privatize it. The privatization of water
systems in Brazil is made through bids in which any appropriate company, national or
Chapter 3 - Administration Structure and Legislation
Organization of the Water and Sanitation Sector
The history of the water and sanitation sector in Brazil is recent. The sector evolution
can be grouped in four stages, some of which overlapping others. During the first stage
of development (from the Second World War until 1965), foreign companies were
funding sanitary projects. The second stage occurred as a result of the dictatorship
(around 1965/70) when the centralization and national security were principles, it was
the federal intervention stage. The third was the decentralization stage when the
administration of the water services returned to the municipalities (1970/80). Finally, the
fourth stage represented the consolidation of a state administration structure responsible
for the management of the water services (from 1980/85). The present set-up is the
result of this evolution of administration structure. The three resulting models of
administration of water services from this evolution of administration structure over the
past 60 years follow. Non-Governmental Organization administrations are not
considered as a model of service since in Brazil they are used only in few small
communities.
State Environmental Companies (Cesbs)
This is the most important model of water and sanitation administration in Brazil.
Around 1970, twenty seven state environmental agencies , "Companhias Estaduais de
and sanitation. Now some of them are among the biggest companies in the sector
invoicing annually between US$ 1 and 2 B (for example: Cedae, the agency from Rio de
Janeiro, Sabesp, the agency from Sap Paulo, etc.). Regarding their services, they have
the concession for the operation, maintenance, management, construction, upgrading
and commercialization of water and wastewater services in their respective states or
regions. The concession period is approximately 20 to 25 years. Regarding their
autonomy, the Cesbs can make investments and participate in bids according to their
own planning program. They can raise international funds directly and define tariffs.
Presently, around 3.7 thousand municipalities (70%) have their water system
concession managed by Cesbs. Almost ten percent of these municipalities are serviced
by the "Servico de Abastecimento do Estado de Sio Paulo" (Sabesp), the Sio Paulo
State Environmental Company. Sabesp is the biggest environmental company in South
America. Its expenditure for 1995 was around US$ 2 B.. Sabesp has 18 thousand
employees and provides service for 20 million customers. Municipal Management and
Operation with FNS Financial Support
This is the administration model of water and wastewater service providing for almost
30% of the municipalities in the Country. In this model there is a partnership between
the municipality and the "Fundacao Nacional de Saude" (FNS) National Health
Foundation, The local authority is responsible for the administration and operation of the
water and wastewater system while the FNS provides investments and stipulates tariffs.
This model created the Autonomous Water and Sewer Municipal Service (Saae's,
Municipal Services
In this model, the operation and maintenance of water and sanitation services are done
either directly by the municipal government or by autonomous agencies. The
administration must provide funds for structural investments through specific federal or
state loans, and through their municipal budget. This model of administration is not in
use anymore.
Financing
The main differences between the two present models of public administration of water
services are related to their funding history. Around 1970, the Cesbs were created as a
pathway for the first major federal investments in the water and sanitation sector. At that
time, municipalities had no autonomy, especially regarding financing from international
loans. Some municipalities with enough technical and financial support (or potential),
kept the control of their water services. Others (around 70%) handed their water system
to the state administration, they became subject to their investment plan and agenda. The
management, upgrading and maintenance of the city's water system would be the charge
of Cesbs. All the revenues from water services would be responsibility of the state
authority and the tariffs from profitable cities should subsidize small cities' water
systems. Regarding municipal authorities (Saaes), around 30% of the municipalities
presently, the budget of the city and fund from the FNS would pay for the city's water
service.
option of final choice of the head of the Saae. Presently all the staff of the municipal
government water service company's of a municipality can be selected by the city,
however, the sewage collection and treatment is a municipal responsibility. Some cities
had their sewage systems built by the Cesbs, generally simple biological lagoons in
suburban areas. Others are still struggling to finance their wastewater systems, either
from their municipal budget or from possible federal investments.
Present Legislation Concerning Privatization and Concession (Law 8666/93)
It is important to understand the difference between privatization and concessions. In
privatization, a private company buys the stock of a public service and/or utility,
acquiring the "control" of it. In a concession, the respective governmental authority
controls the public service and/or utility, however it is operated and/or maintained by a
private company. Privatization can also be seen as a process, in which case concession is
a step in the privatization process. To ensure the authenticity of a concession, a bid is
required. Bids are a complex governmental procedure especially in bureaucratized
countries such as Brazil. Nevertheless, they are crucial for credibility of the public
contracts and represent the link between the private sector and the public services.
Important sections of Law 8666/93, which regulates the bidding process in Brazil, are
presented in Appendix B. Law 8666/93 provides the latest policy rules on "bidding and
disposals and leasing within the scope of the Powers of the Federation, the States, the
Federal District and the Municipalities." (Sole Paragraph, Appendix B). The President
signed it in June 21, 1993. As established in article 2, bids are mandatory for all
administration entities when hiring outsource works or services, including publicity,
purchases, disposals, concessions, permits and leases. Public agents are forbidden to
restrain or frustrate the competitive character of a concession (Article 3 Appendix B).
Article 5 provides the correction criterions for values or prices, and, therefore, would regulate also tariff changes for a concession.
Through publications and invitations, a public bid is "placed" in the market as a way to
evaluate the best price and/or efficiency possible for a service and/or work from
companies (public or private) and compare it with the present situation. During this
stage of the bidding process, the scope of the bid is presented (Appendix G, Article 38
and 40) and the requirements for the adequate concessionaire are listed (Appendix G,
Article 27 through 33). During the second stage of a bid process, all the proposals are
analyzed and the "committee" grants the concessionaire according to the decision
criterion proposed (Appendix G, Article 45 shows the criterion alternatives). The results
must be published. Indeed, the public entity conducting the bid must give access to
information regarding the process to anyone who requests it. This procedures, from the
preparation of the bid until its conclusion, is expensive and time consuming. Until five
days before the final contract signature, a bid can be suspended for undetermined period
for many judicial reasons, in which case it is called "contested." These reasons range
generally they are presented by competitors of the bid. The minimum term up to the
receipt of bids or the occurrence of the event is presented in Article 22 of Law 8666/93
(Appendix B).
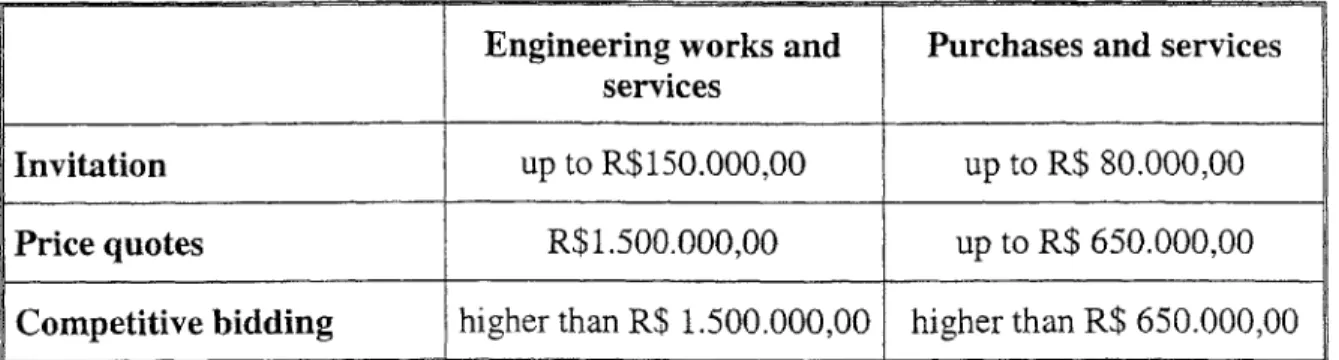
There are several types of bid: competitive bidding, price quotes, invitation, contest and
auction (definitions are presented in Appendix G). As shown in Table 3-1 the type of bid
is related to its price.
Table 3-1 Price Categories of bids according to Law 8666/93
Engineering works and Purchases and services services
Invitation up to R$150.000,00 up to R$ 80.000,00
Price quotes R$1.500.000,00 up to R$ 650.000,00
Competitive bidding higher than R$ 1.500.000,00 higher than R$ 650.000,00
In circumstances when a bid values is much higher (around R$ 5.000.000,00) than those
presented in the Table 3-1, International Invitations are required. They should be
published in the three main languages and any other language pertinent to possible
competitors.
A "Build Operate and Transfer" (BOT) contract would be categorized according to its
present value of the whole project. Since generally it is higher than R$ 1.500.000,00, it
Policy and Regulation Requirements (World Bank)
The World Bank Site, at http://www.worldbank.org/html/fpd/wstoolkits has a set of
toolkits to guide several aspects of contracts for privatization of public services or
utilities. In this section on the Policy and Regulation Requirements for privatization in
Brazil, I refer mainly to Toolkit 3
(http://www.worldbank.org/html/fpd/wstoolkits/Kit3/frame.html). However, toolkit 1
presents important steps to take in order to prepare a fair contract among public and
private parties and can be used as a reference for policy planners and contract grantors.
Toolkit 3 poses questions related to legal, financial and regulatory issues for Concession
Arrangements, BOT Arrangements and Management Contracts (Appendix C). It also
organizes a Key Risks Table (Risk Table, Appendix C) showing the expected World
Bank allocation and mitigation of risk.
The three scenarios presented in the Word Bank Toolkit are meant to be general, but in
fact are very similar to the present situation of many municipalities in Brazil (Appendix
C). The questionnaire of Toolkit 3 refers to Concession, BOT, and Management
Arrangements poses the following important questions:
1. Who are the parties to the contracts that constitute the arrangement?
2. What is the object and scope of the contractual arrangement?
3. What is the duration of the arrangement, and what circumstances will give rise to
4. What are the obligations and rights of the concessionaire?
5. What are the obligations of the grantor?
6. What are the key regulatory provisions?
7. How will key risks be managed?
8. How will performance be measured and monitored?
9. How will assets (including land) be transferred?
10. What consents are required?
11. Who will be responsible for past environmental liabilities?
12. How will disputes be resolved?
Law 8666/93 answers almost all this questions, however, the definition of: "Who are the
parties to the contracts that constitute the arrangement?" is not precise, yet. Since there
is not a specific present status for the Cesbs autonomy or responsibility, Question 1 still
has no answer. It remains unknown whether Cesbs will play the rule of the grantor or the
concessionaire, for many municipalities. Actually, the struggle now is to define if Cesbs
will have to participate in municipal bids at all. Table 3-2 shows the issues of this
struggle regarding the participation of Cesbs in municipal bids (i.e. "Bids for all");
whether there will be "No bids for Cesbs" (i.e. special prervileges) or whether Cesbs will
Table 3-2 Aspects of Cesbs required participation in bids
No bid for Cesbs
Local Services are a municipal responsibility
(Article 30, 1988 Constitution)
Cesbs were instituted before the Law 8666 in 1993
Bid for all
Water and sanitation improvements are a obligation of the three levels of administration (Federal, State and Municipal)
(Article 23, part IX)
Cesbs were created for the development of specific metropolitan areas and, therefore, should be obliged to participate in bids for other municipal systems.
It is impossible for Cesbs to There should be no participate in bids due to privileges between
Biding Aspects their non-profitable governmental entities philosophy
Coordination for the Liaisons between
Political Implications planning of water and governmental agencies and sanitation improvements is local authorities can create
essential conflicts of interest
Universal access to water No water price control (cost and sanitation policy (water and service are directly is free or underpriced) related instead of being
subsidized).
Discussion
Despite the amount of investments required for the sanitary sector and the possible
revenues from concession contracts in Brazil, the risks for private investors is still high.
In some municipal water systems the improvements in tariff collection and water
metering could already make a concession a profitable investment. However, since
public services in Brazil are nontransferable, tariff control must be a public
responsibility, sometimes of Cesb, sometimes of a municipality. This responsibility
includes collection and pricing.
Another aspect of the present situation of Cesbs is their consolidated relationship with
municipal authorities. This relationship has some positive aspects such as technical
improvements and planning integration, however, it also has also negative points, such
as, corrupt liaisons and stagnation of innovation in sanitary system. Moreover, it has
been proven that state investments can not meet the municipal growth demand (Gazeta
Mercantil, 1998).
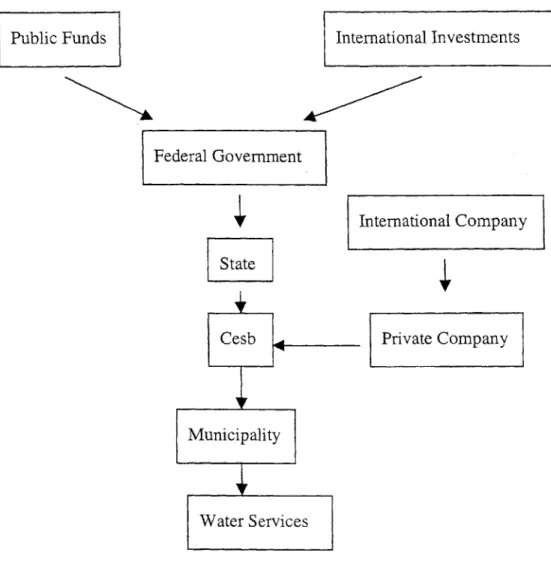
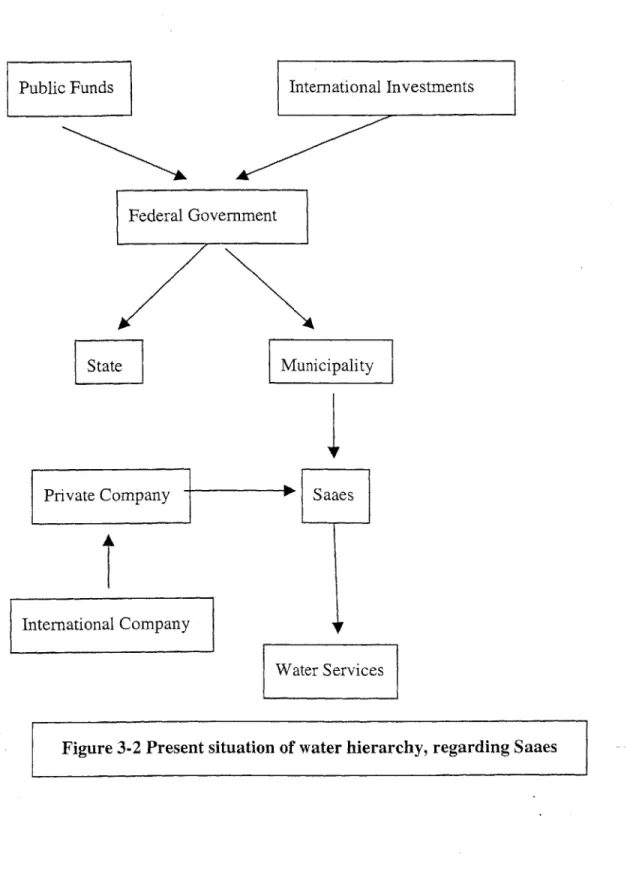
In the next hierarchy of water service figures, Figure 3-1 and 3-2, the present situation of
Saaes and Cesbs is shown. Figure1 presents the situation of municipalities with the
Public Funds Internationa
Federal Government
I Investments
International Company
Private Company
Figure 3-2 presents the situation of municipalities with the Saaes concession of their
water system regarding water service hierarchy.
Public Funds International Investments
Federal Government
Municipality
Private Company Saaes
International Company
Water Services
Figure 3-2 Present situation of water hierarchy, regarding Saaes State
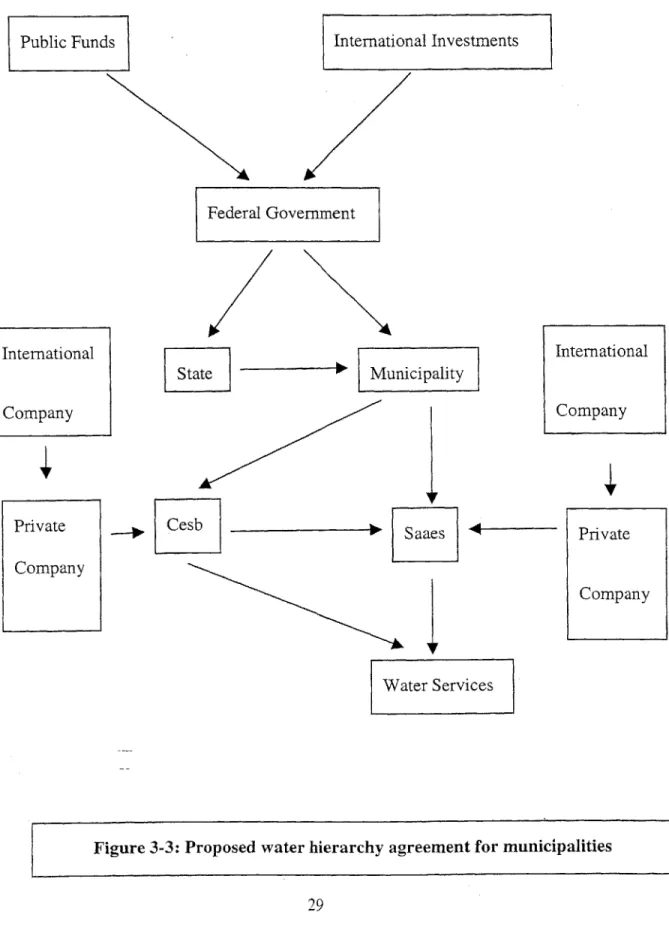
is a possible representation of a successful hierarchy
municipalities with respect to concession of their water or wastewater services.
Public Funds International Investments
Federal Government International Company Private Company -* Municipality V Cesb ~" Saaes 4-Water Services Private Company
Figure 3-3: Proposed water hierarchy agreement for municipalities situation for Figure 3-3
The scenario presented in Figure 3-3 would respect the municipal autonomy, and allow
Federal and state investments to be a municipal responsibility. This structure of water
and sanitary administration would require bid for all companies, public or private. The
participation of federal and state governments would ensure the credibility of the biding
process and supply legal background and technical support.
Perhaps, the main point of this hierarchy structure is that the income from the water and
wastewater services would be a municipal responsibility. In the other two existing
structures, the revenues from the consumers tariff is not reinvested in the local system, it
is a Cesb or Saae responsibility and their investment plan sometimes is not the
appropriate for the Municipality.
The administration structure of Figure 3-3 allows the Urban Integrated Approach for all
the sectors of the municipal infrastructure. This way, there would be two levels of
subsidy. A local level of subsidy, where the municipal budget could integrate its
revenues from all tariffs and reinvest in an appropriate manner, and a federal/state level
subsidy, where the federal government could integrate the national and international
investment and focus on a major developing plan, subsidizing low income
municipalities. Applying for a federal or state loan would not mean receiving money for
free. Municipalities where the revenues from their tariffs are not enough to sustain or
develop the city's infrastructure could finance their water or wastewater system through
takes to pay for the federal or state investment, however, the operation and maintenance
Chapter 4 - Concession of Water and Sewer Services
The Privatization Process
The national security
dictatorship in Brazil,
privatizing sectors in
systems. However the
years. In 1995, sectors
with great success.
and self-sustainability was the legacy from many years of
until 1990 when President Fernando Collor de Mello started
the construction industry, metallurgical industry and power
presidential impeachment in 1992 stopped the process for three
such as telecommunications and highways were being privatized
The financing of the water and sanitation sector in Brazil has developed from federal
subsidy to international loans and private participation. However, by the beginning of
the 2 1St century privatization will be clearly, defined and thus, the future of water and
sanitation sector. Many municipalities will have to choose the best administration
structures, private or public. This will require several improvements in privatization
rules and also economic stability.
In the first section of this Chapter 2, I briefly describe the concession process and
present examples of water and/or sewer privatization in Brazil (Gazeta Mercantil, 1998).
Then, I provide the outline of the present legislation regarding privatization (Law 8666)
In a third section, the basics of policy and regulations requirements for the future of
Concessions of water services in Brazil
The granting criteria in the bidding process of a concession in Brazil have varied from
case to case over time. The winning proposal of a concession has ranged from the one
with greater welfare benefit (low water prices) to one with best "public" benefit (i.e.
best financial agreement for City Hall).
Since the beginning of the water and sanitation sector privatization process of 1995/96,
the financial sums in the awards of many concessions have been greatly overestimated.
Indeed, it has been found that services rendered by the some private companies to which
the concessions were awarded paled in comparison to the funds granted to them. As a
result, there are many judicial and administrative issues are that currently being debated
in an attempt to resolve the problem.
Table 4-1: Water and Sewage Concession
Municipality State Population Company Granted Type Date Years
Aracatuba* SP 157.467 Amafi Sewage Mai/96 15
Campos dos RJ 35.000 Developer/Quiros Water and Sewage Set/96 30
Gpytacazes* Galvao/Carioca...
Itu SP 112.939 Cavo/Camargo Correa Sewage Mar/96 20
Jau SP 97.354 Amafi/Multiservice Water Nov/95 21
Jundiai SP 288.644 Augusto Veloso/Tejof ran Sewage Jan/96 20
Limeira** SP 217.489 CBPO/Lyonnise des Eaus Water and Sewage Jun/95 20
Mineiros do Tiete SP 9.462 Saneciste Water and Sewage Jul/95 30
Ourinhos SP 79.148 Hidrogesp/Multiservice Water Fev/96 15
Ourinhos* SP 79.148 Telar Sewage Fev/96 20
Pereiras SP 4.850 Novacon Water and Sewage Set/94 20
Riberao Preto SP 450.690 CH2M Hill/REK Sewage Set/95 20
Paranagua PR 110.000 Carioca Water and Sewage Mar/97 28
Cajamar SP 33.707 Multservice/REK/Hidrogesp Water Ago/96 20
Saquarema RJ 110.000 Cowan/Queiroz Galvao/Erco... Water and Sewage Mai/97 25
Mairinque SP 35.000 Vilanova Water and Sewage Fev/97 20
Tuiuti SP 3.000 Novacon Water and Sewage Nov/96 20
Salto SP 100.000 Saneciste Sewage and others Dez/96 20
*Administratively Pending ** Judicially Pending
include:
* The cost of the product is not related to its market price;
* The State Company can run/produce with a financial deficit;
* It is difficult to control the productivity of the staff and employees;
e Management turnover is not related to performance, but rather to the political
agenda;
* The bureaucracy of public administration.
Following, are the case studies of six cities, Tuitui, Pereiras, Mairinque,
Limeria and Itu, including financial data from the "Associacao,
Concessionarias" (ABCON) Brazilian Association of Concessionaires
Wastewater.
Riberao Preto,
Brasileira de
of Water and
Cities Concession Investment Description
The section does not intend to describe details about these cities financial agreement or
services improvement but, instead points out few important results about their
privatizing contracts (Gazeta Mercantil, 1998). These agreements are examples of
existing concessions and show the importance of a regulatory structure in order to avoid
irregular deals. The example of Limeira shows that the Municipality and the
concessionaire had a financial agreement which suggest corruption and irregular bid. It
experience to avoid the same problems in the future.
Limeira
The Limeira municipal district privatized the city water and wastewater concession
systems in 1995. The Municipality has awarded a 20-year concession to the consortium
Aguas de Limeira Partnership.
Limeira Water Partnership is composed by the Brazilian Company of Projects and Constructions (CBPO, "Construtora Brasileira Projetos Obras", an affiliate of the
Odebrecht Group) and Suez Lyonnaise des Eaux. The responsibilities of both companies in this project are equal. The contract to do services began in June 1995, and
Limeira Water and Sewage Supply service did the supervision. The law number
8666/93 was used to establish the winner of the bid, one of the criteria was lowest price
bid.
The concession had, and still has, some problems. These problems are related with the
integrity of the concession. Regarding the contract value, interest and water prices,
problems had to be solved by the judicial system. Table 2, Appendix D, contains the
characteristics of the financial agreement of Limeira's concession.
When this program started, approximately 25% of the population had no access to water
treatment services, due to the small reservoir capacity. Only 2-3% of the sewage was
treated There were water losses of the order of 40%, due to the abundance of illegal
connections. Presently, 100% of the population receive treated water and the sewage
The monthly income of the partnership is R$1.5 millions. The commitment of
investments is R$100 millions, to be amortized in 10-15 years. During the first eight
years (1995-2002), R$50 million is to be spent by the partnership. From 1995 to 1997
R$ 12.3 millions were invested, and the investment for 1998 were expected to be R$ 7
millions (new data not available).
Table 4-2: Limeira Water and Wastewater Concession
Ribeirao Preto
Ribeirao Preto was one of the first cities to privatize their water treatment services
(1994). The Ambient Concessionaire of Ribeirao Preto was the pioneer in
Concession General Characteristics Total Investment: 100 Million Initial Investment: 6,15 Million
Upgrade Invest. Varies
Max. Concession Period 30 Years Deferral Period 24 Months
Income Consumer Growth 1,50% Payments/month R$1,50 Million Payments/year R$19,02 Million Inflation/month 1 % Insurance Project fraction 30% Insurance Tax 6% Interest/year 1,06 6%
obtaining financial support from The National Bank of Development (BNDES, Banco
Nacional do Desenvolvimento Brasil) to start building systems to treat the water and
sewage. The concession was based on the "Build Operate and Transfer" (BOT) model.
Today, Ribeirao Preto continues to operate its own water supply system.
The partnership is responsible for the construction of two wastewater treatment plants.
The total investments expected are of the order of R$45 million, 70% of which will be
supported by the BNDES. In addition to the plants, 27 Km of interceptors will be built.
The partnership will receive R$0.18 per cubic meter of treated sewage. The 500
thousand inhabitants of Riberao Preto produce an average of 4 thousand cubic meters of
raw wastewater per hour. This amounts to 34.56 million cubic meters per year.
Disregarding the expected population growth of 1.8% per year, the partnership's income
in this period will be R$ 124.2 millions (R$6.21 millions per year). Table 4-3 shows the
main characteristics of the concession contract of Ribeirao Preto.
Table 4-3: Ribeira Preto Sewage Concession
Concession General Characteristics
Total Investment: R$ 45,00 Million
Concession Period 20 Years
BNDES Financing
Amortization Life 10 Years
Initial Value R$ 30,00 M
Internal Return Rate 18,4%
Itu
Cavo Itu won the bid in March 1996 for the water and sewage treatment concession in
Itu. The concession period is 20 year and the new treatment station is already operating.
The total amount invested is R$ 25.9 millions and from this money R$ 23.8 millions
(90%) was invested in the pre-operational portion of the project. In 1996, R$ 2.38
million were invested (10%) and in 1997 R$ 16.66 million (70%) were invested. The
Payment / year (R$6,77) M
Number of Payments 10
Privet Banks
Amortization Life 20 Years
Bank interest 6% Years
Value R$ 15,00 M
Payments (R$1,31)
Income
Number of Costumers ( base unit.) 450600
Consumer Tax- Sewage 0,18 R$/ m3
Pop. Wastewater Production 34,56 Mm3/year
Consumer Growth 1,80%
Water + Sewage Value 0,405 R$/ m3
Insurance
Project fraction 30%
Insurance Tax 6%
remaining 20% was invested in 1998. About R$ 2.2 million are programmed to be
invested during the period of the concession, for the construction of additional sewage
treatment stations.
The concession in Itu is based in the construction of three sewage treatment stations
(Canjica, Pirajibu, Sdo Miguel), pumping stations, conduits and iron pipe systems.
Mairinque
The concession for water and sewage treatment in Mairinque city belongs to Ciagua (a
company specializing in these services). The contract was signed in February, 1997, but
the system did not begin operation until May, 1997.
The company is committed to spend R $30 million during the concession period of 30
years. During the first two years, the investment is expected to be around R$ 8.6
million. 35% of this will be contributed by the city, the remaining will come from
companies that are financing the project. Through January, 1998, the money spent in
this project was around R$1.5 million.
Before the concession, the city had no sewage treatment. The number of water
connections increased about 10% from May 1997 to January 1998 and the sewage
collection increased 3% in the same period. Water losses dropped from 72% to 55%,
while water metering increased 28%.
The BNDES bank financed R$ 5.37 million. Ciagua is to begin paying off its debt over
in water supply systems will be broken down into the following scheme: R$4.37 million
will be spent on the water system, R$2.17 million will be spent on the sewage system
and R$1.73 million will be spent on operation and management of the water and
wastewater service. This totals R$ 8.27 million, of which 35% is to be contributed by
Ciagua. The average monthly income in 1997 was R$120 thousand and the expected
income for December 1998 is R$ 220 thousand.
Pereiras
The Pereira City concession contract was signed in 1994 with Novacon, date before
which the town hall had the responsibility of water and wastewater treatment.
Up to 1996, the total amount of the investments was R$604 thousand. During the year of 1997, the investment was R$600 thousand, and in the future Novacon has the intention
of investing around R$1.5 million to improve the water and waste water treatment.
In 1997, losses accounted for 30% of the total flow. The company is currently working
on the possibility of a reduction to 15% of water loss. Also by 1997, all water
consumption was already metered, and the next intended step of the company is now to
replace all of the hydrometers to give the consumer and the service provider greater
accuracy. With all of these improvements, the income of Novacon in Pereiras is R$25
thousand per month.
Tuiuti
Tuiuti. The concession was signed in November of 1996. The municipal district has 800
water connections and two employees working on the system. The investments made
since December, 1997 are between R$70 and R$80 thousand. The collection of taxes is
done by "mediadores" (middlemen). The water intake is done through deep wells. The
income is R$11 thousand a month. Sewage treatment has to be operated by the
municipal district, while Novacon has the responsibility for the design of the sewage
treatment plant.
Dicussion
The ownership of all the water/wastewater systems in Brazil will return to city hall in
the next few years. At this junction, each city will decide what to do with its own water
system. It is feasible to think of all the emerging Brazilian cities having their water
systems privatized; but what about small non-profitable cities?
Maybe the answer for this question is federal management with local operation and/or
subsides depending on the situation.
It is important to evaluate what level of investment is really required to the existing
system. In order to improve the water system as a whole, it is necessary to implement
the following actions: management improvements, control of illegal connections,
reduction operational costs, installation of new connections, pipe system maintenance,
pipe system installation, improvement of existing water treatment facilities, and
assess the operation thoroughly in order to evaluate what level of improvement will be
necessary in each case.
Regarding the city's concession analysis, The City of Limeira is an inappropriate
example of private participation in a concession. The NPV shows that after the second
year the new administration is already receiving profits from the investment this is
contrary to all other concessions in which a profit is not realized until the tenth year.
See Appendix D for a different privatization agreement (for Limeira) with a much higher
capital investment or tariff reduction. In alternative 1 the city hall could charge the
concessionaire almost R$80 Million and the IRR would still be considered profitable
(i.e., greater than 17%). In alternative 2 the wastewater tariff was reduced 70% and the
investment is still payable in 12 years (considered a acceptable payback period). Riberao
Preto financial spreadsheet is also presented in Appendix A as an example of expected
investment characteristic from a concession. Table 4-4 shows the results from the
financial spreadsheets presented in Appendix D.
Table 4-4: Result of Concession Agreement Analizys
Financial Limeira Limeira Limeira Riberao Preto
Index Alternative 1 Alternative 2
Payback 2 years 9 years 12 years 10 years
Period
Internal Rate 169 % 21 % 20 % 23 %
of Return
Benefit Cost 3.5 2.1 1.4 1.4
Ratio _ _ _1_1
There is still much to learn about privatization, meanwhile public concession contracts
governmental property) or the final one (all public systems privatized). The main
Chapter 5 - Financial Analysis of CEPT in Tatui
Introduction
The purpose -of this chapter is to evaluate the financial costs of the MIT-CEPT designs
(Alternatives A2 and A3), and to compare them to the costs of the SABESP-Aerated
lagoon design (Alternative Al). To accomplish a fair comparison, costs will be tallied
using the same assumptions that the SABESP design does.
In Brazil, the design consultant firm is responsible for quantifying the design in terms of
specific tasks (i.e. units of labor, equipment and material usage). Each of the tasks is
included in a database managed by SABESP. This database provides cost per unit of
these services.
Methods for Cost Comparisons
The SABESP cost database presents the aggregated cost to accomplish a specific task.
For example, the cost of moving one cubic meter of soil includes the cost of labor and
transportation of the soil, and its unit is currency per cubic meter of soil, per kilometer of
distance to transport.
The method to compare the costs between the 2 MIT-CEPT designs and the SABESP
design therefore relies on a comparison between the various SABESP units.
Consequently, the MIT-CEPT design costs will be estimated using the SABESP
The cost comparison will rely on a quantitative comparison using the various SABESP
task units (i.e. volume of earth moved, foundation reinforcements, etc.). The CEPT
budget will neglect the differences in the predicted pipe installation as well as all items
related to the power station construction since it would not be representative.
SABESP's quantifying system assumes that there are no unknown variables for the
construction. This means, for instance, that all the information regarding quantities of
rock demolition, although estimated, will represent the actual amount of worker and
machinery rent hours, as well as the volume of rock demolished and transported.
Regarding special units for these quantities, global items (represented as GB, which is
the Sabesp' unit for "global") include all services and/or amount of supplies necessary to
accomplish the entire specified task. The lists presented in the page ahead use the same
nomenclature as Sabesp's lists.
SABESP Pricing Structure
The SABESP pricing system represents the estimated price to accomplish a unit service
including all the necessary related items. For example, the price of soil removal deeper
that 4 meters includes: worker's hours, machinery rent hours, and material used.
However, the unit is m3 and the price corresponds to soil digging beneath four meters.
With this pricing structure, it is difficult to estimate price reduction factors, such as
economies of scale, or the construction company profit. The service taxes also vary
In this study two out of four SABESP's lists of services and equipment are important:
list-3 , hydraulic equipment, and list-4, electric equipment. The price unit for these lists
is GB (global). The services that are related to the installation of all the equipment
included in those lists are evaluated in two different SABESP budget items. These items
bear titles such as "installation of hydraulic equipment of list-3" or "installation of
electrical equipment of list-4".
List-3 includes several items. Among them, there are three specifications related to
aerator items: floating aerators (15hp), iron cables (diameter 3116"), and aerator fixing structures. These items will be excluded from the Alternative A2 and A3 CEPT design
budget, and the installation price will be reduced accordingly.
List-4, with all electrical equipment necessary for the whole wastewater treatment plant,
will remain the same. However, it is important to notice that since no aerators will be
used in the CEPT treatment system alternatives, there would be a slight decrease in this
price. By using the same price, the MIT-CEPT budget will therefore be conservative.
This can be seen as a buffer for any unexpected costs.
Moreover a fifth price list will be included for the MIT-CEPT design alternatives. This
list will consist of all the equipment required for the coagulant addition: pumps, flow
meter and storage tanks.
The Design Alternatives for Upgrading Tatui's WWTP
Tatui is a small city 120 km from Sio Paulo, with a population of 120,000 inhabitants
composed by two lagoons, one anaerobic and the other facultative, in a 5 ha area in the
suburbs of the city. The efficiency and the condition of the WWTP CEAGESP was
evaluated by Milton Tomoyuki Tsutiya and Orlando Zuliani Cassettari in 1992
(Appendix E presents the translation of their work). In 1998, a bid was placed in order to
upgrade one of the City's WWTP (called CEAGESP).
The MIT CEPT Project consists of the study of the present design of the WWTP in Tatui
and three alternatives for upgrading the system. The design alternative number 1 (Al)
has been presented by Sabesp in the bid for the system's upgrading. It was designed by
Ampi and approved by Eduardo Pericle Colzi in 1996. It consists of four tracks of two
lagoons, one mechanically aerated followed by a settling tank. The sludge of Al is
pumped from the settling lagoons and dewatered in sludge drying beds (SDB). The two
other alternatives, numbers 2 (A2) and 3 (A3) rely on Chemically Enhanced Primary
Treatment (CEPT) for the removal of total suspended solids (TSS) and its related
biological oxygen demand (BOD).
The alternatives A2 and A3 were designed by three MIT graduate students (Christian
Cabral, Frederic Chagnon and Domagoj Gotovac) as the final project for the Master's of
Engineering Program at MIT in 1999. Professor D. Harleman and research engineer
Susan Murcott supervised the design. The details of the assessment conducted by the
MIT group in Tatui and the design are presented in the MIT CEPT Project 1999. The
project also gives the background of this treatment technology, which consists of the
addition of chemicals to increase the efficiency of the settling tank or lagoon.
settling tanks before the lagoon treatment. Alternative A2 is composed of a CEPT tank
followed by an anaerobic lagoon of 1 ha and 3.3 ha of facultative lagoons, 3 ponds of
1.1 each. The sludge from the CEPT tank is dewatered in a filter press and then
composted through windrows in a 0.6 ha area.
Alternative A3 consists of an anaerobic settling lagoon, where the CEPT chemicals
would be added, followed by another anaerobic lagoon (1 ha) and finally three
facultative lagoons (3.3 ha of total area, 1.1 each). In alternative A3, the chemicals are
added in the first anaerobic lagoon's inlet, in-pond settling occurs, and the settled matter
is biologically stabilized during a one-year period at the bottom of the lagoon. The
sludge produced in the first lagoon, after anaerobic biodegradation during one year,
would then be pumped to the sludge drying beds (SDBs). For the schematic of the three
alternatives of treatment and the area distribution see Appendix F, Figures 1, 2 and 3.
Table 5-1 presents the areas and depths required for each treatment for the three
Table 5-1: Design areas and depths of Al, A2 and A3
In the next section I estimate the capital cost (CC) and the operation and maintenance
costs per month (O&M) for Al, A2 and A3. The first section presents the final table of
total CC of the three alternatives. The services and supplies are grouped in 15 group
items. In terms of CC, the differences in quantities between the three alternatives are
seen in 5 items: Soil Movement, Foundations and Structures, Supplies, Sludge
Treatment, and Other (installation of hydraulic and electric equipment).
Total Capital Cost for Alternatives Al, A2 and A3
The budget for the construction of lagoons treatment systems, neglecting the land price,
consists essentially of land movement, foundations and structures, and wastewater
treatment. The following sections divide the construction budget of three WWTP in 15
Treatment Al Al A2 A2 A3 A2
Area (he) Depth(m) Area (he) Depth(m) Area (he) Depth(m)
Aerated 0.8 3.5 X X X X
Settling 1.3 4.0 X X 1.0 3.5
Anaerobic X X 0.6 3.5 0.6 3.5
main items. Chart 5-1 shows the general distribution of costs for Al, A2 and A3. R$3,000,000.00 R$2,500,000.00 R$2,000,000.00 R$1,500,000.00 R$1,000,000.00-R$500,000.00 R$--Al A2 A3
M SOIL MOVEMENT M FUNDATIO NS &STRUCTURES 0 SUPPLIES 0 SLUDGE TREAMENT 0 EXTRA SERVJICES
Chart 5-1 Capital Costs of Alternatives Al, A2 and A3
As mentioned in previous sections of this CC analysis, the cost of these WWTP options
are ultimately a comparison between Sabesp's required services and materials, including
equipment, and those of the CEPT designs. The Table 5-2 presents the construction
budget for the three alternatives. All prices are given in Brazilian Reais. The exchange