HAL Id: hal-02535640
https://hal-univ-rennes1.archives-ouvertes.fr/hal-02535640
Submitted on 9 Apr 2020
HAL is a multi-disciplinary open access
archive for the deposit and dissemination of
sci-entific research documents, whether they are
pub-lished or not. The documents may come from
L’archive ouverte pluridisciplinaire HAL, est
destinée au dépôt et à la diffusion de documents
scientifiques de niveau recherche, publiés ou non,
émanant des établissements d’enseignement et de
Water nano-diffusion through the Nafion fuel cell
membrane
B. Gilois, F. Goujon, A. Fleury, A. Soldera, Aziz Ghoufi
To cite this version:
B. Gilois, F. Goujon, A. Fleury, A. Soldera, Aziz Ghoufi.
Water nano-diffusion through the
Nafion fuel cell membrane.
Journal of Membrane Science, Elsevier, 2020, 602, pp.117958.
Water Nano-Diffusion through the Nafion Fuel Cell
Membrane.
Baptiste Gilois
Institut de Physique de Rennes, IPR, CNRS-Universit´e de Rennes 1, UMR CNRS 6251,
35042 Rennes, France
Florent Goujon
Universit´e Clermont Auvergne, CNRS, SIGMA Clermont, Institut de Chimie de
Clermont-Ferrand (ICCF), F-63000 Clermont-Ferrand
Alexandre Fleury, Armand Soldera
Laboratory of Physical Chemistry of Matter (LPCM), Department of Chemistry, Universit´e
de Sherbrooke, Sherbrooke, Qu´ebec, Canada, J1K 2R
Aziz Ghoufi∗
Institut de Physique de Rennes, IPR, CNRS-Universit´e de Rennes 1, UMR CNRS 6251,
35042 Rennes, France
Abstract
Nafion, an amphiphilic polymer based on fluorocarbon backbones and acid groups, is probably the most widely used fuel cell membranes. According to its hydration level it self-organizes leading to nano-cavities through which wa-ter diffuse. The diffusion of wawa-ter that controls the protonic transport is then central in the conversion of chemical energy to the electrical one. Recently, a sub-diffusive and heterogeneous dynamics of water were experimentally evi-denced paving the way for more efficient fuel cell membranes. Fundamentally, this dynamics which occurs at the nanoscale needs to be microscopically under-stood. Molecular dynamics simulations are thus performed to locally examine the water dynamics and its relation with the water and Nafion structure. The sub-diffusive regime is numerically corroborated and two sub-diffusive to
dif-∗Corresponding author
fusive transitions are found. The first is time dependent whereas the second is rather water uptake dependent. The sub-diffusive regime is ascribed to the water molecules strongly anchored close to the acid groups. We show that the sub-diffusive to diffusive time transition is the result of the elapsed time be-fore to escape from the attractive interactions of the acid groups. The diffusive regime is recovered far from the acid groups in a homogeneous water phase that is the result of the percolation of the hydrogen bonding network. The progressive transition between sub-diffusive to diffusive regime as a function of the hydration level is due to the respective weight of diffusive dynamics that increases with respect to the sub-diffusive regime given the increase in diffusive pathways as the expense of the localized dynamics. Close to the fluorocarbon backbones the dynamics of water is also sub-diffusive but faster whereas time dynamical transition is not observed. Furthermore we highlight the existence of water corridors based on the hydrogen bonds between molecules forming single file structure in line with a sub-diffusive dynamics. These water corridors are thus possible conducting pathways of protons in a Grotthuss mechanism. Struc-turally we depict an interdigitated structure where the sulfonate are interleaved. Eventually, at high water uptake, we exhibit the self-organizing of Nafion leading to a phase separation between water and the Nafion membrane. We establish a specific interfacial organization of the hydrophilic sulfonate groups involving a water/Nafion interface.
Keywords: Nafion, Water diffusion, molecular simulation, anomalous dynamics
2010 MSC: 00-01, 99-00
1. Introduction
Nowadays the development of new sources of energy is one of major chal-lenges of our society. To overcome this penury due to the intensive exploitation of our natural resource, new approaches have to be promoted in a context of sustainable development. One of the keys of this energetics problem could be
the improvement and the use of fuel cells. These are compact, light and quiet with less pollution emission. Additionally, fuel cells incorporate solid materials inducing an easy assembly and are capable to deliver a strong power with a large current density and a very good energetics performance.
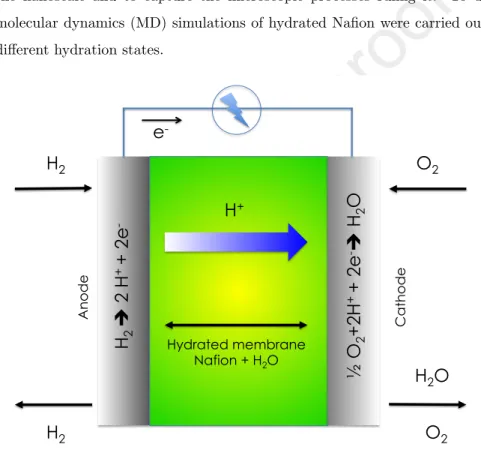
Fuel cells are electrochemical devices allowing a direct conversion of the
10
chemical energy provided from a fuel as hydrogen, methanol or hydrocarbons in electrical energy. As illustrated in Figure 1 fuel cells are built from two electrodes separated from an electrolytic ionic conductor. According to the operating temperature and then to the application (mobile or stationary applications, high or short power supplied), the electrolyte will be different. Two classes
15
of fuel cell can be defined i) fuel cells with an operating temperature beyond 250oC such as the solid oxide fuel cell or the Molten-carbonate fuel cell and ii) fuel cells with an operating temperature below 250oC such as Proton Exchange Membrane Fuel Cell (PEMFC) or Direct-methanol fuel cell [1].
PEMFC are essential given their high performance, no emission in CO2and
20
an use in a large range of power. Several studies have been devoted these two past decades to reduce the cost and to increase their lifetime to allow a large commercialization. Suitable functioning needs are: i) a diffusion of gases and condensation/vaporization of water into the pores of the active layers and dif-fusion layers, ii) an electronic transport and electrochemical conversion of the
25
electrons, protons and reactive gases in the active layer of the electrodes and iii) transport of protons through the fuel cell membrane. The current mem-branes are based on perfluoro-sulfonic memmem-branes and are built from fluorocar-bon backfluorocar-bones and acidic groups. The oldest, most studied and used membrane is probably the one manufactured from Dupont de Nemours (US); the Nafion
30
membrane.
Structure of hydrated Nafion is strongly investigated in order to improve its fuel cell performance but also to design new membranes. Structural studies have highlighted a complex and multi-scale structure [2, 3, 4, 5, 6, 7, 8, 9, 10, 11, 12]. Additionally, a phase segregation between hydrophobic and hydrophilic moieties
35
impor-tant properties of Nafion is its conductivity that is strongly connected to the hydration level and the water transport into the membrane. Indeed, as shown Figure 1 the water uptake progressively increases due to the reactivity between the protons and O2 involving formation of water molecules. Therefore, an
un-40
derstanding of the mechanisms of conduction as a function of the hydration level through the membrane is crucial to design new performing membranes. Transport of protons through the Nafion membrane is then possible through the Grotthuss mechanism [13] and a vehicular one [14] implying chemical re-activity. Although this reactivity is crucial in both mechanisms, the role of
45
water structure and the topology of the Nafion membrane, that are strongly connected to the hydration level, must be clarified because they control the conduction pathway allowing the protonic transport.
Due to progressive water filling three states of hydration can be defined, i) at low hydration (3 water molecules per sulfonate group) where water molecules
50
solvate sulfonate groups of Nafion and protons leading to a localized water structure known as bounded (B) water, ii) at the intermediate hydration (20 water molecules per sulfonate group) such that water molecules are still close to H+ and SO−
3 but less anchored and can be considered as loosely bounded
(LB) and iii) at high water loading (beyond 20 water molecules per sulfonate
55
group) where the water molecules far from H+and SO−
3 are then considered as
free (F) [15, 16, 17]. Additionally, it has been evidenced that Nafion membrane self-assemblies upon hydration leading to a peculiar topology based on channels network involving specific water conduction pathways (between channels)[6, 10, 11, 12]. An understanding of the water network and the water transport into
60
Nafion is then essential to well apprehend the protonic conduction.
As previously evoked Nafion is a multi-scale material and the physical phe-nomena ruling the water transport occur from nanoscale to macro-scale [9]. In-terestingly, it is now well established that mechanisms at the nanoscale strongly impact the macroscopic properties and it is then necessary to well characterize
65
and understand the water structure and dynamics at the nanoscale. Since 50 years molecular simulations has became an useful method to capture the
micro-scopic details and to connect them with macromicro-scopic properties using statistical physics. Several numerical and experimental works have been performed to unveil the water diffusion and the so-associated mechanism as well as the
atom-70
istic structure [18, 19, 20, 21, 22, 23, 24, 25, 26, 12]. Indeed, by using Nuclear Magnetic Resonance (NMR) pulsed gradient spin experiments, C. Casieri et al. have shown a sub-diffusive dynamics of confined water at the microme-ter scale for temperatures > 320K an at different wamicrome-ter uptakes [27]. At the same time, D.T. Hallinan et al. highlighted a non-Fickian diffusion of water
75
in Nafion from time-resolved Fourier transform infrared-attenuated [21]. More recently, Mabuchi and Tokumasu have also established a sub-diffusive dynam-ics of protons and water at low water contents below 5 ns [28]. According to these authors, from 5 ns the diffusion became diffusive and the self-diffusivity can be calculated. Devanathan et al. have also investigated the the relation
80
between structure and dynamics of water and ions. By using classical molecular dynamics simulation these authors have evidenced that at low hydration levels, coordination of hydronium ions by multiple sulfonate groups prevents vehicular transport and impedes structural transport of protons through steric hindrance to hydration of the hydronium ions.[29]Devanathan et al. have also highlighted
85
from quantum hopping molecular dynamics the existence of the water network percolation in Nafion and its effect on proton conductivity. [29].
Although these works provide insights into translational dynamics, the mi-croscopic mechanisms and the relationship between the atomistic structure of the Nafion and dynamics of water were slightly examined. However, recently
90
Song et al. have depicted that the surface chemistry of Nafion strongly im-pacts the water and ions transport. Indeed, using molecular spin probes that selectively partition into heterogeneous regions of Nafion and Overhauser dy-namic nuclear polarization relaxometry, Song and co-workers have revealed that both water and proton diffusivity are significantly faster near the fluorocarbon
95
and the acidic groups lining the water channels compared to within the water channels [25]. More recently, Q. Berrod et al. have also studied water motion and ion transport by combining Quasi Elastic Neutron Scattering, Pulsed Field
Gradient NMR, and atomistic simulations. They demonstrated that confine-ment at the nanoscale and the direct interactions with the charged interfaces
100
produce anomalous sub-diffusion, due to a heterogeneous space-dependent dy-namics within the ionic nano-channels [9].
In this work, we aim to investigate the translational diffusion of water at the nanoscale and to capture the microscopic processes ruling it. To do so
105
molecular dynamics (MD) simulations of hydrated Nafion were carried out for different hydration states.
H
2H
2 Anode Cath o d eO
2O
2H
2O
H
2è
2 H
++
2e
-½
O
2+2
H
++
2e
-è
H
2O
H
+ Hydrated membrane Nafion + H2Oe
-2. Methodology
2.1. Models and Computational Details
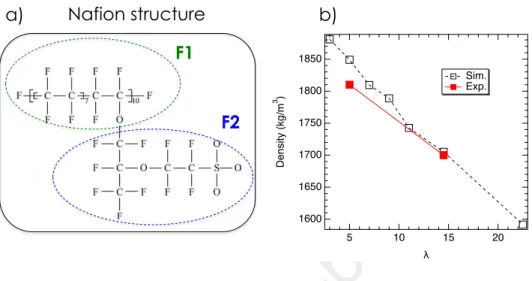
Nafion fuel cell membrane is a dense polymer and its molecular modeling
110
needs specific construction to reach a relaxed configuration. To do so, Nafion membrane was built by considering 4 chains of 682 atoms of 10 monomers (see Figure 2a) by using a Monte Carlo construction based on the statistical biais developed by Theodorou & Seuter [30]. In a second time, we equilibrated the empty polymer (dehydrated Nafion polymer) using the 21 MD steps scheme
115
proposed by Hofmann et al. [31]; Within this scheme, seven cycles of three MD simulations were performed. (1) NVT, T=600 K; (2) NVT, T=300K and(3) NpT, T=300K, where N is the number of atoms, V the volume and T the tem-perature. Details of each steps are provided in Table 1. The value of the pressure in the NpT simulations was gradually increased, passing from the first to the
120
third cycle up to pmax= 50 kbar, and then was reduced stepwise until it reached
the final value of p = 1 bar. In a last step, membrane was subsequently hy-drated and 7 hydration levels were defined from the number of water molecules around a sulfonate group (λ), λ = 3, 5, 7, 9, 11, 14.5, 22.5. All hydrated mem-branes were relaxed from 21 MD steps scheme by using similar temperature and
125
pressure that ones used in case of the empty polymer. Hydration was performed by randomly inserted water molecules within the relaxed empty polymer and equilibration of hydrated Nafion in statistical NpT ensemble was carried out at 1 bar and 300 K. During all processes polymer was considered as flexible. Interestingly, isotherm of adsorption and water activities could be extracted
130
from molecular dynamics simulations in the Grand Canonical statistical ensem-ble in order to consider the flexibility of the polymer. However, this task needs additional and specifics developments to carry out Grand Canonical Molecular Dynamics simulations such as the methodology of hybrid osmotic Monte Carlo simulation[32]. That is in progress and is out of the scope of this work where
135
the water uptake is fixed.
Table 1: Details of the thermodynamic conditions for the 21 MD steps used in the process of generation of relaxed Nafion polymer.
Step ensemble T (K) p (kbar) Time (ps)
1 NVT 600 50 2 NVT 300 50 3 NpT 300 1 50 4 NVT 600 50 5 NVT 300 100 6 NpT 300 30 50 7 NVT 600 50 8 NVT 300 100 9 NpT 300 50 50 10 NVT 600 50 11 NVT 300 100 12 NpT 300 25 5 13 NVT 600 5 14 NVT 300 10 15 NpT 300 5 5 16 NVT 600 5 17 NVT 300 10 18 NpT 300 0.5 5 19 NVT 600 5 20 NVT 300 10 21 NpT 300 0.001 2000
DREIDING force field [33] that was already previously validated [34, 2]. H3O+
the TIP4P-2005 force field [37], respectively. The interactions between the
poly-140
mer, water and proton were taken as a combination of the electrostatic and van der Waals (VdW) interactions. VdW contributions were modeled by consider-ing the Lennard-Jones potentials, such that cross-interactions were calculated by means of the Lorentz-Berthelot mixing rules. The electrostatic interactions were computed by considering the Ewald sum [38, 39]. All interactions were
145
truncated by using a cutoff of 12 ˚A. All of the simulations were performed using the DLPOLY software [40]. Verlet-velocity propagator combined with the Nose-Hoover thermostat and barostat were here considered [41]. Relaxation times of 0.5 ps of both thermostat and barostat were used. Acquisition phases were conducted during 20 ns with a timestep of 1 fs while the equilibration phases
150
were lasted 50 ns. To ensure that the systems are mechanically equilibrated the local pressures of three components according to z direction were calculated. Indeed, the mechanical equilibrium is reached when the local pressures such as Px(z), Py(z) and Pz(z) are constant as a function of z [42]. Pressure were
cal-culated on 20 points by using the Irving-Kirkwood method [] and the averages
155
on these 20 points with their uncertainties were calculated. We found thus the following values <Px(z)>=0.12 ± 0.02 Mpa; <Py(z)>=0.16 ± 0.02 Mpa and
<Pz(z)>=0.09 ± 0.02 Mpa in good agreement with the input pressure of 0.1
Mpa. These small uncertainties show that the pressure is well converged, con-firming that the simulated systems have reached a mechanical equilibrated state.
160
These verifications were also performed for the hydrated membranes where the uncertainties were found slightly higher around 0.05 Mpa that is sufficient to conclude on the mechanical equilibrium. Let us mention that these values of uncertainties are the same order of magnitude than those found in case of liquid [43, 42].
165
We report in Figure 2b the density of the hydrated membrane as a function of λ. As pointed out in Figure 2b a fair agreement with experiment was obtained that validated the so-used force fields of Nafion, proton and water and their combining.
At steady state the permeation rate of water is equal to the mass transfer rate across the membrane–fluid interfaces as well as the water diffusion rate across the membrane.
j à jLà jmà jg Ö4Ü
As illustrated in Eqs. (1)–(4), the diffusion coefficients and mass transfer coefficients are needed to determine the permeation across the membrane. Here, the Nafion membrane is separated as representative volume elements (RVEs) [28] with different water contents in the thickness direction (see Figure 1). With the RVEs, MD simulations are performed to investigate the diffusion coefficients and transport across the interface in the following sections.
2.2. Water diffusion in membrane
Classical MD simulations are performed to investigate the self-diffusion of water in Nafion membrane. As the diffusion coefficients of water are not independent of the water content in the Nafion membrane, 7 cells with different water contents λ (water molecules per SO3 group) of 2, 4,
6, 8, 10, 12, and 14 are investigated, respectively, through MD simulation.
The initial structure of Nafion membrane containing nine polymer chains is constructed with Amorphous Cells modules of Materials Studio 6.1 from Accelrys Software Inc. The molecular structure of each polymer chain consisting 682 atoms is shown in Figure 2. After the Nafion membrane structure is obtained in cells, 90 H3Oámolecules are added to make the system electrically
neutral and 180–1,260 water molecules are added for different water contents with GROMACS 4.5.4 [29]. Then energy minimization with a steepest descent algorithm is performed for simulation cells to obtain a stable configuration.
After minimization of energy for each cell, the structure is relaxed by applying multiple annealing processes between 300 and 600 K. Each annealing procedure is followed by a 10 ns NPT MD at 0.1 MPa to fully equilibrate the structures at different target temperatures (300 and 340 K). For each equilibrium structure, production simulation run containing 20 ns NVT MD simulation is performed and the con-figurations are saved every 1 ps for subsequent analysis of structural and dynamics properties.
GROMACS 4.5.4 [29] is used to perform the MD simulations. The DREIDING force field [30] including recent modifications to the fluorocarbon part by other investigators [31] is used to describe inter- and intramolecular interactions of polymer chains of Nafion, and the flexible three-center (F3C) force field [32] is used for water and H3Oá.
With the results of classical MD simulations, the structural and thermodynamics properties, such as the density and diffusion coefficient, can be extracted. The self-diffusion coefficients of water molecules in Nafion can be estimated by studying its mean square displacement (MSD):
MSDÖtÜ àN1 XNm
ià1â~riÖtÜ ~riÖ0Üä 2
* +
Ö5Ü
Figure 2. Molecular structure of a polymer chain of the Nafion membrane.
1234 Z.-Z. LI ET AL.
F2
F1
Nafion structure
1850 1800 1750 1700 1650 1600 D e n si ty (kg /m 3 ) 20 15 10 5 λ Sim. Exp.a)
b)
Figure 2: a) Structure of the Nafion membrane. F1 and F2 are the labels of fluorine atoms in the backbone and branching, respectively. b) Density of the hydrated membrane as a function of λ.
2.2. Translational dynamics
170
Translational dynamics was studied from the calculation of the mean square displacement (MSD) MSD(t) = D P t0 PN
i=1[rcom,i(t + t0) − rcom,i(t0)] 2E N N0t
(1) with rcom,ithe position of the centre of mass of molecule i, t0the time origin,
N the number of molecules and N0 the number of t0. From the MSD and by
using the generalized Einsteins’s relation, the diffusivity (Df) is then extracted
175
such that
M SD(t) = Dftα (2)
α is a parameter related to the type of diffusion, α = 1 corresponds to a diffusive regime, α < 1 is connected to a sub-diffusive one while α > 1 is linked to a super-diffusive process. The case of α=2 corresponds to a ballistic dynamics [44, 9, 45]. Let us mention, that for α 6= 1, the diffusion is considered
180
known diffusion coefficient (D) extracted from the Einstein’s relation in one dimension (M SD(t) = 2Dt). α was calculated by deriving Eq. 2 as
α(t) = ∂M SD(t) ∂t ·
M SD(t)
t (3)
3. Results and Discussion
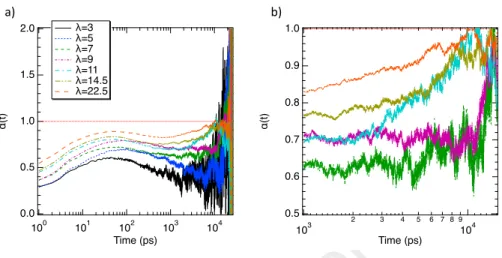
We report in Figure 3 the instantaneous value of α as a function of time (t)
185
for all water uptakes. Figure 3a shows that for t < 1 ns, α < 1 that suggest a sub-diffusive regime in this time range. As highlighted in Figure 3b, beyond 1 ns, α rises to one leading to a crossover between a sub-diffusive to a diffusive regime (or a lesser sub-diffusive regime). Interestingly, this effect seems to widen as the water uptake increases to strive for a quasi diffusive regime. At low λ,
190
we can assume that water molecules are probably organizing in clusters leading to the formation of nanophases where molecules locally diffusive (because they are trapped in small size environment) inducing a sub-diffusive regime. Indeed, microscopically speaking sub-diffusive regime is the result of the local diffusion and a heterogeneous structure. In second stage size of nanophases could growth
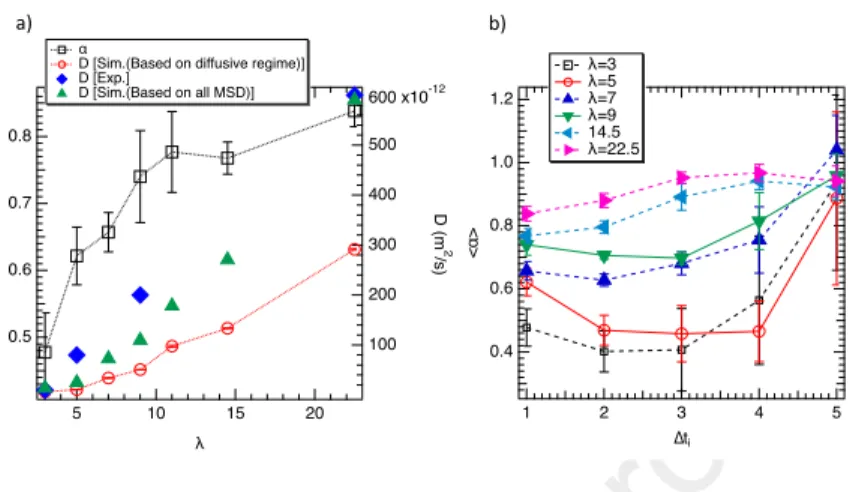
195
as λ increases involving a progressive transition toward a diffusive regime. The water structure and its connection with the dynamics will be deeply discussed later.
We report in Figure 4a the average value of α (< α >) as a function of λ calculated between 0 and 1 ns. As shown in Figure 4a the sub-diffusive
dynam-200
ics is clearly evidenced (< α >< 1). Additionally, Figure 4a shows an increase in < α > as the water uptake increases that highlight a continuous dynamical transition. To well appreciate the loss of the sub-diffusive regime beyond 1 ns, < α > was calculated between five consecutive time intervals noted ∆ti(∆ti=1
between 0 and 1 ns; ∆ti =2 between 1 and 5 ns; ∆ti =3 between 5 and 10 ns;
205
∆ti=4 between 10 and 15 ns and ∆ti =5 beyond 15 ns) . Figure 4b displays α
as a function of ∆tifor six water contents. Figure 4b exhibits a progressive
2.0 1.5 1.0 0.5 0.0 α (t ) 100 101 102 103 104 Time (ps) λ=3 λ=5 λ=7 λ=9 λ=11 λ=14.5 λ=22.5 1.0 0.9 0.8 0.7 0.6 0.5 α (t ) 103 2 3 4 5 6 7 8 9 104 Time (ps) a) b)
Figure 3: α as a function of time for all hydration levels in all range of time a) and between
1 ns and 15 ns b).
conclusions drawn from instantaneous values of α. This effect is found higher at low loadings because from ∆ti= 3, < α > is doubled. The diffusion coefficients
210
were extracted from the linear region of the MSD related to the diffusive regime and from the total MSD trajectories (from 0 to 20 ns) and reported in Figure 4a. When the diffusion coefficient is evaluated from all MSD trajectories a fair agreement between experiment [46] and simulation was found. Indeed tendency as a function of λ and absolute values are well reproduced. Experimentally
215
it was not possible to de-correlate both regimes. Interestingly, when only the diffusive regime is considered the so-calculated diffusion coefficients are found weaker suggesting that molecular simulations could be a relevant tool to be combining with NMR or QENS experiments to extract the diffusion coefficient of confined liquids. To sum up; i) the sub-diffusive regime could be due to the
220
presence of nanophases inducing localized dynamics and ii) the loss of the sub-diffusive regime could be the result of to spatial connection between nanophases inducing the diffusive pathways. We first began then to examine the existence of nanophases and their structure.
0.8 0.7 0.6 0.5 < α > 20 15 10 5 λ 600 x10-12 500 400 300 200 100 D (m 2 /s) α
D [Sim.(Based on diffusive regime)] D [Exp.] D [Sim.(Based on all MSD)] 1.2 1.0 0.8 0.6 0.4 < α > 5 4 3 2 1 ∆ti λ=3 λ=5 λ=7 λ=9 14.5 λ=22.5 a) b)
Figure 4: a) < α > (left axis) and translational diffusion coefficient (right axis) as a function
of λ. b) < α > as a function of ∆ti. Experimental diffusion coefficient were taken in Ref.
[46].
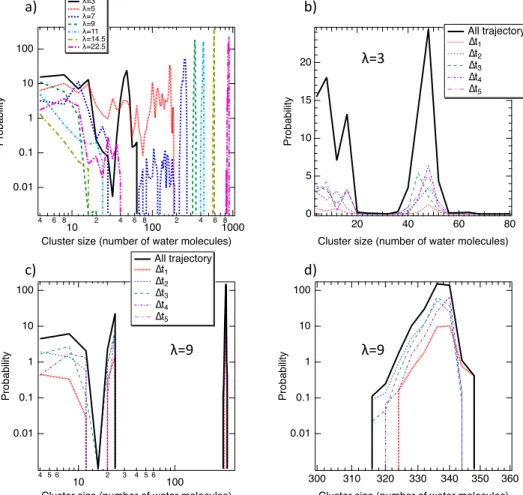
Water nanophases can be compared to the water pockets and can be assim-ilated to the clusters defined from their size. By using the method of Stoddard [47] the cluster size distribution was calculated by considering the hydrogen bonds (HB). HB were defined from the geometric criteria established by Luzar and Chandler [48] that consist in the distances of 2.5 ˚A and 3.5 ˚A between the
230
hydrogen and the oxygen atoms and two oxygen atoms of two water molecules. We report in Figure 5a the cluster size distribution of water as a function of λ. At low water uptake (λ = 3 and 5) all cluster sizes are equally sampled and the system does not percolate. This result sheds light on a polydisperse distribution of clusters and then the presence of small water islands. The percolation occurs
235
from λ=7 where all nanophases begin to be gathered in a single interconnected structure. This structural organization is in line with the so-observed transition between sub-diffusive to diffusive regime. Interestingly, despite the percolation of the HB network that occur at λ = 7, small clusters are also evidenced sug-gesting a mixing between the single interconnected structure and clusters, that
240
is in good concordance with the so-observed sub-diffusive and diffusive regime. To provide an obvious picture of time evolution of clusters, the cluster size dis-tribution was evaluated for each ∆ti. As shown in Figure 5b, for λ = 3 the
cluster size distributions is not time-dependent that suggest an absence of clus-ter inclus-terconnection and an absence of clusclus-ters assembly with respect to the time.
245
Therefore, at low λ, water molecules are trapped in the nanophases and locally diffusive in small size environment inducing a sub-diffusive regime.
0.01 0.1 1 10 100 Pro b a b ili ty 4 6 8 10 2 4 6 8100 2 4 6 81000 Cluster size (number of water molecules)
λ=3 λ=5 λ=7 λ=9 λ=11 λ=14.5 λ=22.5 20 15 10 5 0 Pro b a b ili ty 80 60 40 20
Cluster size (number of water molecules) All trajectory ∆t1 ∆t2 ∆t3 ∆t4 ∆t5 0.01 0.1 1 10 100 Pro b a b ili ty 4 5 6 10 2 3 4 5 6 100 Cluster size (number of water molecules)
All trajectory ∆t1 ∆t2 ∆t3 ∆t4 ∆t5 0.01 0.1 1 10 100 Pro b a b ili ty 360 350 340 330 320 310 300
Cluster size (number of water molecules)
a) b)
c) d)
λ=3
λ=9 λ=9
Figure 5: a) Number of cluster as a function the cluster size for all hydration levels. Number of cluster as a function the cluster size for λ = 3 b) and λ = 9 c). d) Enlargement of part c) for high size clusters.
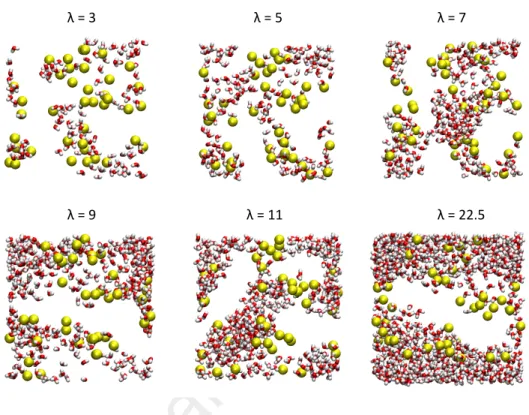
To illustrate the water nanophases, snapshots of final configuration of six hydration levels are reported in Figure 6. As shown in Figure 6, at low water uptake water clusters are observed to be located close to the sulfonate groups
whereas at higher loadings water molecules are rather connected to form a struc-turing network always impacted by the hydrophilic sulfonate groups and hy-drophobic fluorine backbone. It would seem that water molecules firstly adsorb on the sufonate groups and grow to form water nanophases. As λ increases nanophases grow to finally interconnect and form a single structure. The
local-255
ized dynamics are thus always present but they statistically decreases in favor to the diffusive regions (nanophases assembly). Indeed, as shown in Figure 5c and 5d where the cluster size distributions for λ = 9 is represented, the presence of small clusters and the percolation phenomenon are observed whatever ∆ti.
That suggest the permanent presence of the single interconnected water
struc-260
ture. This result refutes the fact that the sub-diffusive to diffusive transition is due only to the time assembly of nanophases [49].
A question arises on the origin of the sub-diffusive regime: is the result of the confined dynamics into nanophases or the local diffusion close to the sulfonate groups? Another point concerns the loss of the sub-diffusive regime from λ = 5
265
that can be correlated to the assembly or a growth of water nanophases leading to an increase in diffusive domains with respect to the sub-diffusive ones. This scenario does not exclude the presence of a localized dynamics whose statistical weight will decrease as the water nanophases grow.
270
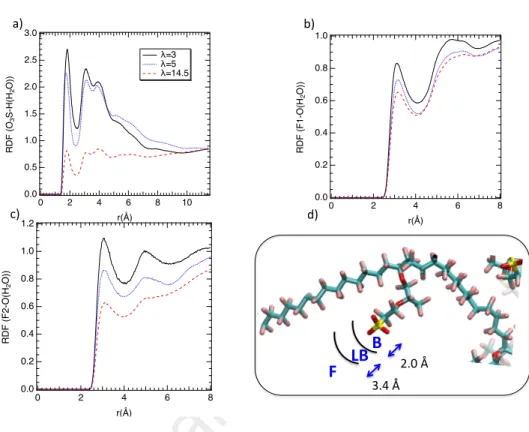
To analyze the local dynamics close to the sulfonate groups (SO−3) the char-acteristic distances between water and SO−3 were examined. To do so, the radial distribution functions (RDF) between hydrogen atoms of water molecules and oxygen atoms of sulfonate groups are calculated and reported in Figure 7a. As shown in this figure two maxima can be extracted whatever the water uptake,
275
one around 2.0 ˚A corresponding to a strong hydrogen bond and a second dis-tance located at 3.4 ˚A connected to the second hydration shell. Difference in intensity between the three water loadings is due to a density effect [50]. RDF between oxygen atoms and fluorine atoms were also calculated to investigate the dynamics along the hydrophobic backbone. Contrary to the sulfonate groups,
280
λ = 3 λ = 5 λ = 7
λ = 9 λ = 11 λ = 22.5
Figure 6: Snapshots of final configurations of 6 hydration levels. water molecules are repre-sented such that red and white colors represent the oxygen and the hydrogen atoms, respec-tively. Yellow spheres are the sulfur atoms in the Nafion membrane. For clarity, other atoms of Nafion are not represented.
in Figure 2) whereas the position of the second peak changes as a function of type of fluorine. This difference is due to the proximity of the sulfonate groups. Indeed as illustrated in Figure 2, F2 is close to the sulfonate groups and then benefit from their hydrophilicity. From RDF, three regions around the sulfonate
285
groups were drawn, < 2.0 ˚A corresponding to the bounded water, between 2.0 ˚A and 3.4 ˚A corresponding to the loosely bounded water and beyond 3.4 ˚A that is the free water. Similar decomposition was performed around the fluorine. Local dynamics have been then investigated by considering this spatial division.
1.0 0.8 0.6 0.4 0.2 0.0 R D F (F 1 -O (H 2 O )) 8 6 4 2 0 r(Å) 1.2 1.0 0.8 0.6 0.4 0.2 0.0 R D F (F 2 -O (H 2 O )) 8 6 4 2 0 r(Å) 2.0 Å 3.4 Å 3.0 2.5 2.0 1.5 1.0 0.5 0.0 R D F (O 3 S-H (H 2 O )) 10 8 6 4 2 0 r(Å) λ=3 λ=5 λ=14.5
B
LB
F
a) b) c) d)Figure 7: a) Radial distribution functions between oxygen atoms of SO−3 groups of the Nafion
and the hydrogen atoms of water for three water uptakes. RDF between F1 atoms b) and F2 atoms c) (labels are defined in Figure 2) and oxygen atoms of water. d) Illustration of the so-considered distances, based on the RDF calculation, to define three regions around the sulfonate groups; bounded water (B), loosely bounded water (LB), and free water (F).
We report in Figure 8 the MSD of four water uptakes from λ = 3 to λ = 22.5 in three bounded (B), loosely bounded (LB) and free (F) water regions. As highlighted in Figure 8a a sub-diffusive regime is observed in the three zones because all water molecules are anchored close to the sulfonate groups (see Figure 6 and Figure 7a). In both LB and F boundaries the sub-diffusive regime
295
is progressively replaced by the diffusive one as the water uptake increases. That is the result of the assembly of nanophases allowing a diffusive regime through the membrane (see Figure 6). That is an evidence of the connection between the percolation process (Figures 5 and 6) previously highlighted and the water diffusion. Indeed, we have shown that the diffusion of water molecules increases
with the water uptake i.e. with the rate of percolation and the growth of the hydrophilic part in line with the work of Benziger et al al. who showed that the different percolation thresholds suggest the hydrophilic domains in Nafion grow from lamella[51]. However as depicted in Figure 8c and 8d the dynamics of water in the B region is still sub-diffusive during about 50-100 ps prior to becoming
305
diffusive. The macroscopic sub-diffusive regime previously characterized by α could be then attributed to the water molecules strongly anchored close to the sulfonate groups. The time elapsed in the sub-diffusive regime could be probably attributed to the elapsed time before to escape from the attractive interactions of the sulfonate groups. Indeed, during the first hundred pico-seconds the MSD
310
was found around 2-5 ˚A2that represent a displacement of 2.2 ˚A that is the same order of magnitude of size of region B.
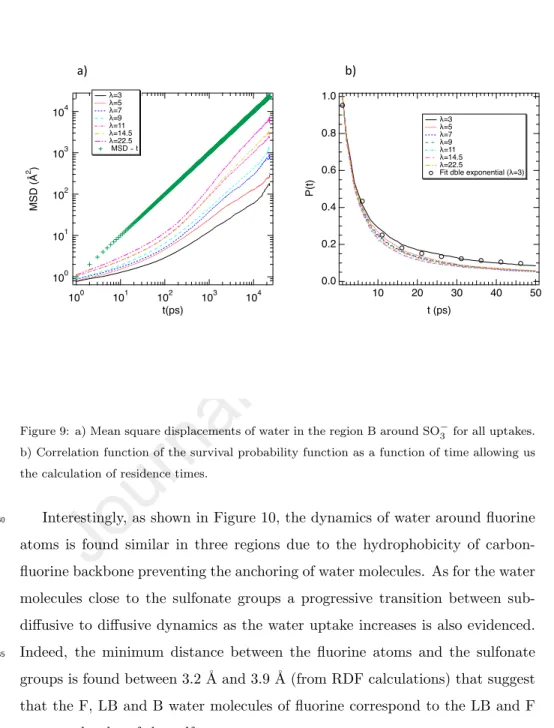
As shown in Figure 9a this phenomenon is independent of the water up-take that bear out an escaping process of water molecule close to the sulfonate groups. The elapsed time of water molecules close to the sulfonate groups can
315
be quantified by calculating their residence times from the evaluation of the cor-relation function of the survival probability function (P(t)) that adopt a value of one if the water molecule labeled j has been in the referred hydration shell around site α from time t0 to time t + t0 , without getting out in between this
time interval, and zero otherwise. This function is then fitted from a double
320
exponential such that the residence time is extracted [52, 53]. We report in Figure 9b the correlation function as a function of time for all λ. As shown in Figure 9b the decorrelation is obtained for t∼50 ps that is in line with the predicted time transition between both dynamical regimes. Residence times were calculated from an exponential adjustment using a double exponential. As
325
reported in Figure 9b the fit is in good concordance with P(t) that suggest that the residence time can be extracted. We obtain the following residence times, τλ=22.5=84.4 ps and τλ=3=63.7 ps that is line with the time crossover observed
100 101 102 103 104 MSD ( Å 2 ) 100 101 102 103 104 t(ps) λ=7 100 101 102 103 104 MSD ( Å 2 ) 100 101 102 103 104 t(ps) λ=11 100 101 102 103 104 MSD ( Å 2 ) 100 101 102 103 104 t(ps) λ=22.5 a) b) c) d) 100 101 102 103 104 MSD ( Å 2 ) 100 101 102 103 104 t(ps) λ=3 Bounded Loosely bounded Free MSD ∝ t
Figure 8: Mean square displacements of water in three water regions B, LB and F around
100 101 102 103 104 MSD ( Å 2 ) 100 101 102 103 104 t(ps) λ=3 λ=5 λ=7 λ=9 λ=11 λ=14.5 λ=22.5 MSD ∝ t 1.0 0.8 0.6 0.4 0.2 0.0 P(t ) 50 40 30 20 10 t (ps) λ=3 λ=5 λ=7 λ=9 λ=11 λ=14.5 λ=22.5
Fit dble exponential (λ=3)
a) b)
Figure 9: a) Mean square displacements of water in the region B around SO−3 for all uptakes.
b) Correlation function of the survival probability function as a function of time allowing us the calculation of residence times.
Interestingly, as shown in Figure 10, the dynamics of water around fluorine
330
atoms is found similar in three regions due to the hydrophobicity of carbon-fluorine backbone preventing the anchoring of water molecules. As for the water molecules close to the sulfonate groups a progressive transition between sub-diffusive to sub-diffusive dynamics as the water uptake increases is also evidenced. Indeed, the minimum distance between the fluorine atoms and the sulfonate
335
groups is found between 3.2 ˚A and 3.9 ˚A (from RDF calculations) that suggest that the F, LB and B water molecules of fluorine correspond to the LB and F water molecules of the sulfonate groups.
100 101 102 103 104 MSD ( Å 2 ) 100 101 102 103 104 Time (ps) Bounded Loosely bounded Free MSD ∝ t λ=3 λ=9 λ=22.5
Figure 10: Mean square displacements of water in the LB region around F1 for λ = 3, 9 and 22.5.
This result, based on the position of the first minimum in RDF, suggests that the water molecules could form a conducting corridor between sulfonate
340
groups as illustrated in Figure 11a. By calculating the number of hydrogen bonds [48] of water molecules we highlighted that the water corridor was based on the hydrogen bonds between molecules forming a single file structure (see Figure 11b). Interestingly, this structure is well known to involve a sub-diffusive dynamics [54] that is in line with the value of < α > reported in Figure 4. This
345
water corridor structure could be then a conducting pathway of protons in the Grotthuss mechanism [13]. Although classical molecular dynamics simulations can not take into account the transfer of the proton between water molecules, the existence of water corridors between sulfonate groups where each molecule are connected by the hydrogen bonds will be in favor of the transport of proton
350
Carbon-fluorine backbone Sulfonate groups Water corridor SO3- SO3- SO3- SO3- 2.0 Å 3.2 Å 2.9 Å a) b) Water corridor based on hydrogen bonds Sulfonate groups
Figure 11: a) Illustration of a water corridor along the carbon-fluorine backbone b) Snapshot at λ = 7 highlighting a water corridor based on the hydrogen bonds between water molecules. Water molecules have been chosen by considering the hydrogen bonds number using the geometric criteria defined by Luzar and Chandler [48].
Indeed, as shown in Figure 12a the MSD of hydronium ions are around 40-60 ˚
A2 whatever λ i.e. a displacement of 6-7 ˚A involving a very strong anchoring around the sulfonate groups. At λ=7, the MSD is 18.1 ˚A2 while at λ=11.5 the MSD is 13.5 ˚A2. The difference between both water uptake corresponds
355
to 4.6 ˚A2 i.e. a displacement of 2 ˚A along the sulfonate groups. As this
difference is not really significant the MSD of ions can be then considered as similar between λ=7 and λ=11.5.Figure 12b which report the RDF between hydronium ions and the sulfonate groups evidences several peaks between 2 and 6 ˚A that corroborate a strong interactions. This result is in good agreement
360
with the work of Devanathan and coworkers that has shown a very slow proton dynamics in line with the neutron scattering experiments. [29]
4 6 8 1 2 4 6 8 10 2 4 6 MSD ( Å 2 ) 100 101 102 103 104 Time (ps) λ=3 λ=5 λ=7 λ=9 λ=11 λ=11.5 λ=22.5 2.5 2.0 1.5 1.0 0.5 0.0 R D F (O (SO 3 -)-H (H 2 O )) 6 5 4 3 2 1 r(Å) λ=3 λ=22.5 a) b)
Figure 12: a) Mean square displacements of H3O+ for all uptakes. b) RDF between oxygen
atoms of SO−3 and hydrogen atoms of H3O+.
The hydronium ions located beyond 6 ˚A in the second solvation shell of the sulfonate groups correspond probably to the ions located in the first shell of another SO−3. That is probably the result of the polymer folding. To
en-365
sure this hypothesis we report in Figure 13a the RDF between SO−3. Figure 13a shows three maxima at 2.5 ˚A , 3.0 ˚A and 5.0 ˚A that highlight an interdigi-tated structure. At high water uptake, Figure 13b exhibits the self-organizing of Nafion leading to a phase separation between water and the Nafion membrane. Interestingly, as shown in Figure 13b the hydrophilic sulfonate groups point
to-370
ward the water phase involving a Nafion surface decorated with SO−3 interacting with water molecules. Therefore a water/Nafion interface is evidenced with a surface rich in SO−3 such that water molecules could jump between sulfonate sites. This result is in good agreement with the work of G.A. Voth and C.K. Knox because their very large scale simulations revealed fast intercluster ’bridge’
375
formation and network percolation. Sulfonate groups were found inside these bridges and played a significant role in percolation. Sulfonates also strongly aggregated around and inside clusters leading to the hydrophilic-hydrophobic interface. [55]
20 15 10 5 0 R D F (O 3 S-O 3 S) 8 7 6 5 4 3 2 r(Å) a) b) Phase separation Nafion/water interface
Figure 13: a) RDF between sulfur atoms of SO−3 at λ=3. b) Snapshots of hydrated Nafion
and the water/Nafion interface at λ = 22.5.
Translational jumps were quantified by calculating the self Van Hove function
380
(GS(r,t)) where r and t are the position and time of guest molecules,
respec-tively, GS(r, t) = N1
D PN
j=1δ [r − (rj(t) − r(0)]
E
, rj(t) is the atomic position of
j particle at time t and N is the number of water molecules. Figure 14a re-ports GS(r, t) from 1 ps to 300 ps for a loading of λ = 3. The maximum of the
Van Hove function remains at a distance lower than 1.5 ˚A from 2 ps to 300 ps,
385
which indicates small displacements and an absence of translational jumps in this time interval. However a growth of a shoulder is observed around 3.0 ˚A that could correspond to the translational jumps between two sulfonate groups side by side.
0.6 0.4 0.2 0.0 4 π GS (r ,t ) 14 12 10 8 6 4 2 0 r (Å) 1 ps 3 ps 5 ps 7 ps 9 ps 11 ps 13 ps 15 ps 17 ps 19 ps 25 ps 30 ps 300 ps λ=3 λ=22.5 a) b) 0.8 0.6 0.4 0.2 0.0 4 π GS (r ,t ) 14 12 10 8 6 4 2 0 r (Å) 1 ps 3 ps 5 ps 7 ps 9 ps 11 ps 13 ps 15 ps 17 ps 19 ps 25 ps 30 ps 300 ps 0.7 0.6 0.5 0.4 0.3 0.2 0.1 0.0 4 π GS (r ,t ) 14 12 10 8 6 4 2 0 r(Å) 1 ps 3 ps 5 ps 7 ps 9 ps 11 ps 13 ps 15 ps 17 ps 19 ps 25 ps 30 ps 300 ps Bulk
Figure 14: Self van Hove functions as a function of the covered distance for some times for λ=3 a), 22.5 b) and for the water liquid bulk phase (inset of part b))
4. Concluding Remarks
390
In this work diffusion of confined water into the Nafion membrane was ex-amined.
A sub-diffusive regime was evidenced whatever the hydration level. This regime was important at low λ whereas it was found decreasing in favor of diffusive one as the hydration rate increased. A first progressive sub-diffusive
395
to diffusive transition as a function of the water uptake was then evidenced. Structural analyses were then carried out to structurally understand this dy-namical behavior. Cluster size study evidenced a polydisperse distribution of nanometric cluster inducing nanophases. The first hypothesis was that, at low water uptake, water molecules are trapped in these nanophases and locally
diffu-400
sive in small size environment inducing a sub-diffusive regime. The percolation occurs from higher hydration level such that all nanophases begin to be gath-ered in a single interconnected structure. The progressive transition between sub-diffusive to diffusive regime as the increase in water uptake was then, in first time, ascribed to the structural process. More especially, we have shown
that the water molecules firstly adsorb on the sufonate groups and grow to form these water nanophases around sulfonate groups. As well water uptake increases nanophases grows to finally interconnect and to form a single structure.
However, we have shown the presence of a permanent single interconnected water structure involving that the sub-diffusive to diffusive transition could
410
be only the result of the time assembly of nanophases. Analyses of the local dynamics helped us to examine the molecular origin of this dynamics. From radial distribution calculations three regions around the sulfonate groups and the fluorine atoms were drawn, corresponding to the bounded (B) water, to the loosely bounded (LB) water and the free (F) water. Local dynamics have
415
been then investigated by considering this spatial division. In the (B) bound-ary of sulfonate groups the sub-diffusive regime was always evidenced and was found progressively timely replaced by the diffusive one in all range of λ. The so-observed sub-diffusive regime was ascribed to the water molecules strongly anchored close to the sulfonate groups and locally diffusive in small size
envi-420
ronment. We evidenced that the sub-diffusive to diffusive time transition was the result of the elapsed time before to escape of the attractive interactions of the sulfonate groups. This phenomenon was found independent of the water up-take. The diffusive regime is then possible from the diffusive corridors induced by the percolation of the hydrogen bonding network. On the contrary in both
425
LB and F regions the dynamics were found rather diffusive. As a function of the location of the water molecules their dynamics can be then drastically different involving dynamical heterogeneities.
The progressive transition between sub-diffusive to diffusive regime as a func-tion of the hydrafunc-tion level is ascribed to the respective weight of diffusive
dy-430
namics that increase with respect to the sub-diffusive regime due to the increase in diffusive pathways at the expense of the localized dynamics.
Close to the fluorocarbon backbones the dynamics of water molecules is also sub-diffusive but faster than the water located close to the sulfonate groups. Additionally, time dynamical transition was not observed. Dynamics of
wa-435
vicinity of sulfonate groups, close to the fluorocarbon backbones and in the nanometric channels) involving then dynamical heterogeneities. Furthermore we highlighted the existence of water corridors based on the hydrogen bonds between molecules leading to the formation of a single file structure which is in
440
line with a sub-diffusive dynamics. This water corridor structure is assimilated to a possible conducting pathway of protons in a Grotthuss mechanism. From a Nafion standpoint, we exhibited an interdigitated structure where the sulfonate groups are interleaved. At high water uptake, we exhibit the self-organizing of Nafion leading to a phase separation between water and the Nafion
mem-445
brane. Eventually, a specific interfacial organization was evidenced involving a hydrophilic surface and then a water/Nafion interface. At the microscopic scale, water molecules diffuse then close to the sulfonate groups (hydrophilic regions) and slide along the Fluorine groups (hydrophobic zones). However, at the macroscopic scale (corresponding to the NMR results) the water transport
450
corresponds to the diffusion through the hydrophilic nanophases defined by the sulfonate groups leading to a hydrophilic surface. That suggests then an inter-facial transport at the membrane/fluid interface.
Competing Financial Interest
The authors declare no competing financial interests.
455
Acknowledgements
We are grateful to the CNRS for its financial support through the project ”Waterloo”, PICS. A.F. and A.S. thank Calcul Qu´ebec and Compute Canada to provide computational resources, through the financial support of the Canadian
460
Foundation Innovation (CFI). Their work was supported by the Universit´e de Sherbrooke, the Fonds Qu´eb´ecois de la Recherche sur la Nature et les Technolo-gies (FRQNT), and the Natural Sciences and Engineering Research Council of Canada (NSERC).
References
465
[1] I. EG&G Technical Services, Fuel Cell Handbook, U.S. Departement of Energy - Office of Fossil Energy - National Energy Technology Laboratory, P.O Box 880 - Morgantown, West Virginia 26507-0880, 2004.
[2] W. Goddard−III, B. Merinov, A. V. duin, T. Jacob, M. Blanco, V. Mo-linero, S. Jang, Y. Jang, Multi-paradigm multi-scale simulations for fuel
470
cell catalysts and membranes, Mol. Sim. 32 (2006) 251.
[3] S. Cui, J. Liu, M.-E. Selvan, D. Keffer, B. Edwards, W. Steele, A molecu-lar dynamics study of a nafion polyelectrolyte membrane and the aqueous phase structure for proton transport, J. Phys. Chem. B 111 (2007) 2208. [4] P. Laflamme, A. Beaudoin, T. Chapaton, C. Spino, A. Soldera, Simulated
475
infrared spectra of triflic acid during proton dissociation, J. Comp. Chem. 33 (12) (2012) 1190.
[5] P. Laflamme, A. Beaudoin, T. Chapaton, T. Spino, A. Soldera, Molecu-lar modeling assisted design of new monomers utilized in fuel cell proton exchange membranes, J. Mem. Sci. 401 (2012) 56.
480
[6] N. Metatla, S. Palato, A. Soldera, Change in morphology of fuel cell mem-branes under shearing, Soft Matter 9 (2013) 11093.
[7] H. Mendil−Jakani, S. Pouget, G. Gebel, P. Pintauro, Insight into the mul-tiscale structure of prestretched recast nafion membranes: Focus on the crystallinity features, Polymer 63 (2015) 99.
485
[8] A. Fleury, A. Godey, F. Laflamme, A. Ghoufi, A. Soldera, Is fine-grained simulation able to propose new polyelectrolyte membranes?, Fuell Cells 16 (2016) 675.
[9] Q. Berrod, S. Hanot, A. Guillermo, S. Mossa, S. Lyonnard, Water sub-diffusion in membranes for fuel cells, Scientific Reports 7 (2017) 8326.
[10] N. Martinez, A. Morin, Q. Berrod, B. Frick, J. Olivier, L. Porcar, G. Gebel, S. Lyonnard, Multiscale water dynamics in a fuel cell by operando quasi elastic neutron scaterring, J. Phys. Chem. C 122 (2018) 1103.
[11] M. Tripathy, P. S. Kumar, A. Deshpande, Molecular structuring and per-colation transition in hydrated sulfonated poly(ether ether ketone)
mem-495
branes, J. Phys. Chem. B 121 (2017) 4873.
[12] A. Vishnyakov, R. Mao, M.-T. Lee, A. Neimark, Coarse-grained model of nanoscale segregation, water diffusion, and proton transport in nafion membranes, J. Chem. Phys 148 (2018) 024108.
[13] C. de Grotthuss, Sur la d´ecomposition de l’eau et des corps qu’elle tient en
500
dissolution `a l’aide de l’´electricit´e galvanique, Ann. Chim. 58 (1806) 54. [14] T. Peckham, S. Holdcroft, Structure-morphology-property relationships of
non-perfluorinated proton-conducting membranes, Adv. Mater. 22 (2010) 4667.
[15] Z. Lu, G. Polzos, D. Macdonald, E. Manias, State of water in
perfluorosul-505
fonic ionomer (nafion 117) proton exchange membranes, J. Elec. Soc. 155 (2008) B163.
[16] F. Xu, S. Leclerc, D. Canet, Nmr relaxometry study of the interaction of water with a nafion membrane under acid, sodium, and potassium forms. evidence of two types of bound water, J. Phys. Chem. B 117 (2013) 6534.
510
[17] T. Shimoaka, C. Wakai, T. Sakabe, S. Yamazaki, T. Hasegawa, Hydration structure of strongly bound water on the sulfonic acid group in a nafion membrane studied by infrared spectroscopy and quantum chemical calcu-lation, Phys. Chem. Chem. Phys. 17 (2015) 8843.
[18] T. Zawodzinski, M. Neeman, L. Sillerud, S. Gottesfeld, Determination of
515
water diffusion coefficients in perfluorosulfonate ionomeric membranes, J. Phys. Chem. 95 (1991) 6040.
[19] S. Motupally, A. Becker, J. Weidner, Diffusion of water in nafion 115 mem-branes, J. Elec. Soc. 147 (2000) 3171.
[20] S. Ochi, O. Kamishima, J. Mizusaki, J. Kawamura, Investigation of proton
520
diffusion in nafion 117 membrane by electrical conductivity and nmr, Solid State Ionics 180 (2009) 580.
[21] D. Hallinan, M. D. Angelis, M. Baschetti, G. Sarti, Y. A. Alabd, Non-fickian diffusion of water in nafion, Macromolecules 43 (2010) 4667. [22] Q. Zhao, P. Majsztrik, J. Benziger, Diffusion and interfacial transport of
525
water in nafion, J. Phys. Chem. B 115 (2010) 2717.
[23] Q. Duan, H. Wang, J. Benziger, Transport of liquid water through nafion membranes, J. Mem. Sci. 88 (2012) 392.
[24] O. Sel, L. T. T. Kim, C. Debiemme-Chouvy, C. Gabrielli, C. Laberty-Robert, H. Perrot, Determination of the diffusion coefficient of protons in
530
nafion thin films by ac-electrogravimetry, Langmuir 29 (2013) 13655. [25] J. Song, O. Han, S. Han, Nanometer-scale water and proton diffusion
het-ergenities across water channels in polymer electrolyte membranes, Angew. Chem. Int. Ed. 54 (2015) 3615.
[26] Z.-Z. Li, L. Chen, W.-Q. Tao, Molecular dynamics simulation of water
535
permeation through the nafion membrane, Numerical heat transfer, Part a 70 (2016) 1232.
[27] C. Casieri, A. Monaco, F. D. Luca, Evidence of temperature−induced sub-diffusion of water on the micrometer scale in a nafion membrane, Macro-molecules 43 (2010) 638.
540
[28] T. Mabuchi, T. Tokumasu, Relationship between proton transport and morphology of perfluorosulfonic acid membranes: A reactive molecular dy-namics approach, J. Phys. Chem. B 122 (2018) 5922.
[29] R. Devanathan, A. Venkatnathan, M. Dupuis, Atomistic simulation of nafion membrane: I effect of hydration on membrane nanostructure, J.
545
Phys. Chem. B 111 (28) (2007) 8069.
[30] D. Theodorou, U. Suter, Detailed molecular structure of a vinyl polymer glass, Macromolecules 18 (1985) 1467.
[31] D. Hofmann, L. Fritz, J. Ulbrich, C. Schepers, M. Bohning, Detailed-atomistic molecular modeling of small molecule diffusion and solution
pro-550
cesses in polymeric membrane materials, Macromol. Theory Simul. 9 (2000) 293.
[32] A. Ghoufi, G. Maurin, Hybrid monte carlo simulations combined with a phase mixture model to predict the structural transitions of a porous metal-organic framework material upon adsorption of guest molecules, J. Phys.
555
Chem. C 114 (2010) 6496.
[33] S. L. Mayo, B. D. Olafson, W. Goddard−III, Dreiding: a generic force field for molecular simulations, J. Phys. Chem. 94 (1990) 8897.
[34] S. Jang, V. Molinero, T. Cagm, W. Goddard−III, Nanophase-segregation and transport in nafion 117 from molecular dynamics simulations: Effect
560
of monomeric sequence, J. Phys. Chem. B 108 (2004) 3149.
[35] M. Baaden, M. Burgard, G. Wipff, Tbp at the water-oil interface: The effect of tbp concentration and water acidity investigated by molecular dynamics simulations, J. Phys. Chem. B 105 (2001) 11131.
[36] Y. Wu, H. Tepper, G. Voth, Flexible simple point-charge water model with
565
improved liquid-state properties, J. Chem. Phys 124 (2006) 024503. [37] J. Abascal, C. Vega, A general purpose model for the condensed phases of
water: Tip4p/2005, J. Chem. Phys. 123 (2005) 23505.
[38] P. Ewald, Die berechnung optischer und elektrostatischer gitterpotentiale, Ann. Phys. 64 (1921) 253.
[39] T. Darden, L. Perera, L. Pedersen, New tricks for modelers from the crys-tallography toolkit: the particle mesh ewald algorithm and its use in nucleic acid simulations, Structure 7 (1999) R55.
[40] I. Todorov, W. Smith, K. Trachenko, M. Dove, Dlpoly3: new dimensions in molecular dynamis simulations via massive parallelism, J. Mater. Chem.
575
16 (2006) 1911.
[41] W. Hoover, Canonical dynamics: Equilibrium phase-space distributions, Phys. Rev. A 31 (1985) 1695.
[42] A. Ghoufi, P. Malfreyt, Local description of surface tension through ther-modynamic and mechanical definitions, Mol. Sim. 39 (2012) 603.
580
[43] F. Biscay, A. Ghoufi, P. Malfreyt, Surface tension of water-alcohol mixtures from monte carlo simulations, J. Chem. Phys 134 (2011) 044709.
[44] J.-P. Bouchaud, A. Georges, Anomalous diffusion in disordered media: Sta-tistical mechanisms, models and physical applications, Physics Reports 195 (4) (1990) 127.
585
[45] E. Flenner, J. Das, M. Rheninstadter, I. Kosztin, Subdiffusion and lateral diffusion coefficient of lipid atoms and molecules in phospholipid bilayers., Phys. Rev. E 79 (2009) 011907.
[46] J. Perrin, S. Lyonnard, F. Volino, Quasielastic neutron scattering study of water dynamics in hydrated nafion membranes, J. Phys. Chem. C 111
590
(2007) 3393.
[47] S. Stoddard, Identifying clusters in computer experiments on systems of particles, J. Comp. Physics 27 (2) (1978) 291.
[48] A. Luzar, D. Chandler, Effect of environnement on hydrogen bond dynam-ics in liquid water, Phys. Rev. letters 76 (1996) 928.
595
[49] W. Hsu, T. D. Gierke, Ion transport and clustering in nafion* prefluorinated membranes, J. Mem. Sci. 13 (3) (1983) 307.
[50] S. Dixit, J. Crain, W. poon, J. Finey, A. Soper, Molecular segregation observed in a concentrated alcohol-water solution, Nature 416 (2002) 829. [51] X. Wu, X. Wang, G. He, J. Benziger, Differences in water sorption and
600
proton conductivity between nafion and speek, Pol. Phy. part B 49 (2011) 1437.
[52] A. Bizzarri, S. Cannistraro, Molecular dynamics of water at the protein-solvent interface, J. Phys. Chem. B 106 (2002) 6617.
[53] F. Goujon, P. Malfreyt, J. Simon, A. Boutin, B. Rousseau, A. Fuchs, Monte
605
carlo versus molecular dynamics simulations in heterogenous systems: An application to the n-pentane liquid-vapor interface, J. Chem. Phys. 121 (2004) 12559.
[54] H. Jobic, Observation of single-file diffusion in a mof, Phys. Chem. Chem. Phys 18 (2016) 17190.
610
[55] C. Knox, G. Voth, Probing selected morphological models of hydrated nafion using large-scale molecular dynamics simulations, J. Phys. Chem. B 114 (9) (2010) 3205.