HAL Id: hal-01926847
https://hal.archives-ouvertes.fr/hal-01926847
Submitted on 12 Oct 2020
HAL is a multi-disciplinary open access archive for the deposit and dissemination of sci-entific research documents, whether they are pub-lished or not. The documents may come from teaching and research institutions in France or abroad, or from public or private research centers.
L’archive ouverte pluridisciplinaire HAL, est destinée au dépôt et à la diffusion de documents scientifiques de niveau recherche, publiés ou non, émanant des établissements d’enseignement et de recherche français ou étrangers, des laboratoires publics ou privés.
Water permeation across artificial I-quartet membrane
channels: from structure to disorder
Samuel Murail, Tudor Vasiliu, Andrei Neamtu, Mihail Barboiu, Fabio
Sterpone, Marc Baaden
To cite this version:
Samuel Murail, Tudor Vasiliu, Andrei Neamtu, Mihail Barboiu, Fabio Sterpone, et al.. Water perme-ation across artificial I-quartet membrane channels: from structure to disorder. Faraday Discussions, Royal Society of Chemistry, 2018, 209, pp.125 - 148. �10.1039/c8fd00046h�. �hal-01926847�
Water permeation across artificial I-quartet
membrane channels: from structure to
disorder
Samuel Murail,*a Tudor Vasiliu,b Andrei Neamtub,c, Mihail Barboiu,d Fabio Sterponee and Marc Baaden*,e
a MTi (Molécules Thérapeutiques in silico), INSERM UMR-S973, University Paris Diderot. E-mail : [email protected] b Center of Advanced Research in Bionanocojugates and Biopolymers, “Petru Poni” Institute of Macromolecular Chemistry, Iasi, Romania
Aleea Grigore Ghica Voda 41A, 70487
c
Department of Physiology, “Gr. T. Popa” University of Medicine and Pharmacy of Iasi, Str. Universitatii nr. 16, 700115, IASI, Romania
d Adaptive Supramolecular Nanosystems Group, Institut Européen des Membranes, ENSCM-UMII-UMR CNRS 5635.
e Laboratoire de Biochimie Théorique, CNRS UPR9080, Univ Paris Diderot, Sorbonne Paris Cité, PSL Research University, Institut de
Biologie Physico-Chimique. E-mail : [email protected]
Abstract
Artificial water channels (AWC) have been designed for water transport across membranes with the aim to mimic the high water permeability observed for biological systems such as aquaporins (~108-109 water molecules/s/channel), as well as their selectivity to reject ion permeation at the same time. Recent works on designed self-assembling alkylureido-ethylimidazole compounds forming imidazole-quartet channels (I-quartets), have shown both high water permeability and total ionic-rejection1. I-quartets are thus promising candidates for further development of AWCs. However, the molecular mechanism of water permeation as well as I-quartet organization and stability in a membrane environment need to be fully understood to guide their optimal design.
Here, we use a wide range of all-atom molecular dynamics (MD) simulations and their analysis to understand the structure/activity relationships of the I-quartet channels. Four different types with varying alkyl chain length or chirality have been studied in a complex fully hydrated lipid bilayer environment at both microsecond and nanosecond scale.
Microsecond simulations show two distinct behaviors; (i) two out of four systems maintain chiral dipolar oriented water wires, but also undergo a strong reorganization of the crystal shape, (ii) the two other I-quartet channels completely lose the initial organization, nonetheless keeping a water transport activity. Short MD simulations with higher time resolution were conducted to characterize the dynamic properties of water molecules in these model channels and provided a detailed hypothesis on the molecular mechanism of water permeation. The ordered confined water was characterized with quantitative measures of hydrogen-bond life-time and single particle dynamics, showing variability among I-quartet channels.
We will further discuss the underlying assumptions, currently based on self-aggregation simulations and crystal patches embedded in lipid bilayer simulations and attempt to describe possible alternative approaches to computationally capture the water permeation mechanism and the self-assembly process of these AWC.
Introduction
The present urgent demand for fresh water (agriculture, drinking) has stimulated the search for optimized filtering systems. Biological water transport systems are an ideal model since they are able to overcome membrane barriers and range amongst the most efficient molecular machinery with potential biotechnological applications. Great interest is placed in the development of artificial water channels (AWC) with the purpose to mimic the selective transport capabilities of natural systems and possibly surpass them. The most used strategy to construct the AWCs is the bottom-up supramolecular approach, in which biomimetic architectures are put together via their self-assembly. Another route concerns unimolecular structures that can be used as water channels spanning the bilayer membranes, e.g. carbon nanotubes.
From such examples, we know that a pore with a diameter of ∼3 Å is a critical prerequisite for ion-exclusion behaviors2. This dimension closely matches biological systems in the cellular environment, such as the Aquaporin family (AQP) with fast water transport properties across membranes (~108-109 water molecules/s/channel). A complete exclusion of ions is observed in this case thanks to an hourglass structure with the narrowest constriction of 2.8 Å. As the water molecule diameter is roughly the same size, a 3 Å pore diameter would prevent any permeation of hydrated ions. In the case of partially dehydrated ions, some ion passage has been observed for ion channel selectivity filters, for instance K+ channels, with smallest known diameter of 3.6-3.9 Å3. Although AQP-like molecular systems represent a natural device to be incorporated in artificial membranes for biotechnological applications such as water purification, their large-scale application is not yet possible, because of the high costs of the AQPs production, low stability and practical synthetic fabrication constraints. This situation emphasizes the expectations for AWCs to fill this gap.
Why are Artificial Water Channels conceptually so important?
The performance of natural biological channels serves as an inspiration for artificial design. In fact, in a biological structure such as AQP the water flux is granted by the reshuffling of the almost uni-dimensional water hydrogen bond pattern. For example, in Aquaporin-Z channels, rapid water diffusion with selective blocking of protons and ions is achieved via the creation of water wires of opposite dipolar orientation4–6. Notably, when incorporated in polymeric vesicles, water-permeability of AqpZ is at least an order of magnitude larger than that of classical polymeric systems6. Artificial hydrophobic7, hydrophilic8–10 or amphiphilic pores11,12 have been designed to selectively transport water efficiently across lipid bilayer membranes, achieving 100% efficiency and estimated 1.5 x 10⁶ molecules/s/channel permeation rates for the I-quartet channels discussed in this paper2. The molecular-scale hydrodynamics of water permeation through these channels depends on channel-water and water-water interactions and on the in-pore water electrostatic dipolar profile within the channel.
Major insights are gained from molecular simulations.
In particular concerning such molecular-scale processes, atomistic simulations have been pivotal to our understanding of key concepts of water transport in biological and synthetic systems. Seminal work based on molecular dynamics (MD) simulations of Aquaporin channels has clarified the molecular mechanisms
responsible for their efficiency and selectivity13. Another model system of great importance concerns the study of water transport in carbon nanotubes14. Such examples show that molecular-level insights are key to our understanding and can be achieved through molecular dynamics type simulations acting as a computational microscope. A few studies of artificial water channels have appeared recently, our own included1,15,16, and contribute to understand the dynamic behaviors of water molecules under confined conditions.
The molecular simulations provide a detailed and dynamic atomistic view that allows the characterization of the water dynamics during permeation, including the characteristic lifetimes of hydrogen bonds, diffusion coefficients, orientational dynamics, detailed interactions with the environment, energetics, emerging electrostatic patterns, collective behaviour and ion exclusion mechanism. This knowledge may help improve AWCs by fine-tuning the balance between attractive and repulsive elements.
How to accurately model AWC properties through MD simulations?
In order to explore the molecular details of water transport in artificial channels via MD simulations it is necessary to construct a realistic model. Extensive, yet very expensive simulations can be used to mimic the assembling of the molecular channel in the membrane. Because of the long time-scale of this process, a simplified representation of the membrane environment, e.g. the use of alkane chains as membrane-mimetic, may help to speed up the self-assembling.
Clearly, the available resolved crystalline structure for a given compound facilitates the task. In fact, patches of the crystal can be embedded in the membrane, and their stability tested against perturbations, e.g. temperature, membrane composition, as well as the molecular details of the compounds. We used this approach to understand the structure/activity relationships of artificial water channels, embedding small (ca. 3 nm wide) channel patches based on X-ray structures in a lipid bilayer environment with the same composition as that used in permeation experiments to begin each simulation1. Once a full characterization at an all-atom level has been achieved, it is possible to devise a coarse-grained model in order to study larger assemblies and longer timescales.
Extensive classical MD simulations provide access to the unbiased process of water flow, but in order to gather specific information of thermodynamic character, e.g. the barrier for transport of water, proton and ionic species, the deployment of enhanced sampling techniques is required, but comes with a high computational cost.
What type of information can simulations contribute?
The theoretical stability and dynamics of AWC membrane assemblies can be tested, for instance probing different stoichiometries or the influence of membrane composition. The size of the observed aggregates, the similarity and homogeneity of the formed channels can be characterized. How chirality affects the aggregation process and the aggregate properties is an important aspect. Detailed structural and architectural characteristics are described by analyses such as radial distribution functions, density profiles, root mean square deviations and channel pore profiles. The water channels may show a variety of sizes and different single-file water net dipole orientations, directly connected to their specific function. Their selectivity toward other permeants (ions, protons, molecules) can be assessed, depending strongly on the channel structure and dimensionality, channel-water affinity, the average pore occupancy and the dynamics of the permeating water.
Understanding the molecular-scale dynamics of water clusters confined in such structurally simple artificial channels is of fundamental and crucial importance. The mechanisms of water transport through aquapores are related to structural behaviors of these water clusters entering the channels, which lose or change part of the hydrogen bonds connecting the water molecules, depending on the hydrophobic or hydrophilic nature of the channel. Spontaneous and continuous diffusion of a one-dimensional ordered chain of water molecules in interaction or not with the surrounding aquapore is related to molecular interactions with the inner pore surface and diameter, and the dipolar water orientation. The detailed energetics of water transport can be fully assessed17,18.
Topical focus on MD simulations of I-quartet channels
We previously designed self-assembling molecules around an imidazole scaffold (I-quartet) that allows for high water permeability (106 water molecules/s/channel) in a membrane environment combined with total ionic-rejection1,8. These features result in I-quartets being a good candidate scaffold to further optimize AWCs. However, the molecular mechanism of the associated water permeability and the precise structural organization in the membrane environment remain to be fully understood.
In previous studies, we showed that I-quartet superstructures are stable in their solid state and within bilayers, leading to functional water-channels. The ion-exclusion in these systems is caused by dimensional steric effects, whereas hydrophobic effects appear to be less important. The confined water wires observed in the crystal, like in aquaporin channels, form one hydrogen bond with the inner wall of the I-quartet and another hydrogen bond with an adjacent water molecule. Moreover, the water molecules adopt a unique dipolar orientation and preserve their overall electrochemical dipolar potential along the channel. Our analysis suggests that the supra-molecular chirality of I-quartets may be strongly associated with water-induced polarization by their unique dipolar orientation within the channels.
In the present manuscript we continue the investigation of artificial channels formed by I-quartet molecules. We namely focus on the stability of the construct, the mechanism of self-assembling, and the water dynamics inside the pore. The insight gained from the simulations, up to now, points to two extreme scenarios of water permeation mechanisms, a low rate structured transport through single water files, and a higher rate mechanism via loosely aggregated “sponge”-like structures formed by the I-quartets in the membrane. We further observe intermediate situations in membrane exposed channels that keep some of the single-file structure, yet enable higher permeation rates.
Methods
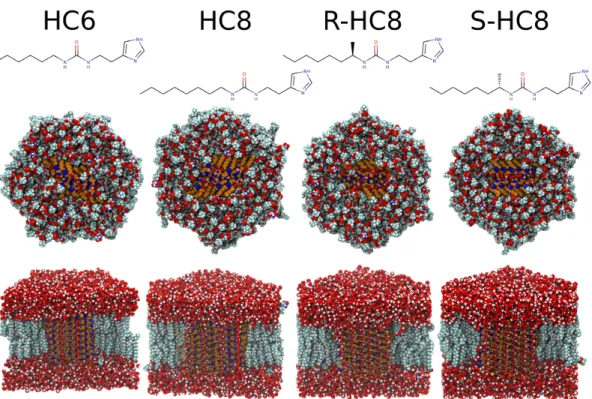
We used all atom molecular dynamics (MD) simulations to inspect the behavior of four artificial water channels formed by the hexylureido-ethylimidazole (HC6), octylureido-ethylimidazole (HC8), R-octylureido-ethylimidazole (RHC8) and S-octylureido-ethylimidazole (SHC8) I-quartet compounds embedded in a membrane bilayer. In our simulations we have either pre-assembled the channels inside the membrane, following a previously tested protocol based on their crystal structures, or we have monitored the self-assembly from random mixtures for one specific system.
System Preparation
Simulation of crystal patches embedded in a membrane bilayer. Based on the
crystallographic structures we used the Mercury 3.5.1 software to fill the crystallographic unit cell with missing molecules, then replicate it keeping 2, 6 and 8 slices in x, y and z axis directions, respectively, resulting in a 96 molecules patch. The four HC6, HC8, RHC8 and SHC8 systems include respectively 2, 2, 6 and 6 water channels. We subsequently inserted them in a pre-equilibrated triclinic membrane patch containing a 5:4:1 ratio of cholesterol:palmitoyloleoyl phosphatidylcholine (POPC):palmitoyloleoyl phosphatidylserine (POPS) molecules. We deleted overlapping water and lipid molecules and added a concentration of roughly 50 mM Na+Cl- to the solvent, as well as an excess of Na+ ions to neutralize the system charge induced by the negatively charged PS lipids.
Simulation of micelle formation in water. In order to simulate the self-assembly
process of the SHC8 compound in water, a single molecule of SHC8 was replicated 64 times and evenly distributed in the simulation box. The box was then filled with TIP3P water and a 50 ns simulation was started.
Molecular Dynamics Simulations
Simulations were performed using the CHARMM-36 force field19 for lipid molecules and the TIP3P model20 for water. To represent the HC6, HC8, RHC8 and SHC8 molecules, and generate their topologies, we used the CHARMM General Force Field (CGenFF)21 together with the paramchem web service22. The GROMACS 4.6 software23 was used to run the simulations using virtual interaction sites allowing a 5 fs integration time step. All bonds were constrained using the LINCS algorithm. The particle mesh Ewald algorithm was used to handle electrostatics with a 10 Å cutoff for the short-range part and a grid spacing of 1.2 Å for the long-range contribution in reciprocal space. The Verlet buffer scheme was used for non-bonded interactions, the neighbor list was updated every 20 steps. Three baths (imidazoles, lipids, water and ions) were coupled to a temperature of 310 K using the Bussi velocity rescaling thermostat with a time constant τ = 0.1 ps. In our previous work1, we showed that high lateral pressure could stabilize the structure of the I-quartets, as a result, pressure in the x/y dimensions was scaled isotropically with a Berendsen weak barostat and coupled to a reference pressure of 10 bar, while pressure in the z dimension was coupled independently to a reference pressure of 1 bar. For all dimensions, the same pressure coupling parameters were used: τ = 5.0 ps and compressibility of 4.5 10-5 bar-1. All systems were minimized for 10 000 steps with a steepest descent algorithm and equilibrated for 20 ns, using position restraints of 1 000 kJ.mol-1.nm-2 on imidazole molecules' heavy atoms, with the crystal structure as a reference. Production runs were finally computed and extended with respect to previous studies to systematically reach simulation times of 1 µs without any position restraints, coordinates were saved every 25 ps. For the three systems HC8, RHC8 and SHC8, additional production runs of 5 ns were computed, using the starting coordinates from the previous production, at frame 100 ns. During these three short production runs, coordinates were saved with high frequency every 200 fs.
For reference on bulk water properties, an additional simulation of a cube with 37.2 Å side length, containing 1 728 water molecules, was conducted for 10 ns with similar simulation parameters as used in the three short production runs. The only difference in parameters is the pressure coupling, which instead of being
semi-isotropic is semi-isotropic at a 1 bar pressure. Only the second half of this simulation was analyzed.
Figure 1 View of the equilibrated simulation systems for the four I-quartet channels inserted in a 5:4:1
cholesterol/POPC/POPS membrane bilayer. Above the structural views of the simulation systems, the chemical structure of the imidazole compound is given. The top structural image shows a view down the membrane normal, showing the hexagonal simulation cell. The inserted crystal patch is shown in orange and blue color, water molecules above the membrane are omitted for clarity. On the bottom, a side view with part of water and membrane omitted to view the membrane insertion of the I-quartet structures. The first row of I-quartet molecules is represented as sticks, and subsequent layers are depicted as van der Waals spheres.
Micelle insertion in the membrane
The simulation involving the insertion of the micelle in the membrane implied 3 steps: (i) in the first step, 96 molecules of SHC8 were evenly distributed inside the water compartment above the membrane and the simulation ran until the formation of the solvated micelle was complete, (ii) the second step involved pulling each molecule of SHC8 from the previously formed aqueous micelle to the middle of the membrane (on the z axis) and thereby embedding them forcefully. The forced insertion of SHC8 was achieved using the pull code from GROMACS. This bias was necessary because the spontaneous fusion time of the entire micelle with the bilayer would have been too long, (iii) the third step involved the simulation of the freely evolving system with the micelle embedded in the bilayer.
Insertion of randomly distributed SHC8 molecules in the membrane
For this simulation, the SHC8 molecules were evenly distributed on both sides of the membrane and had constraints set on their x and y coordinates to prevent micelle formation during the pulling. After their complete membrane insertion, the restraints were removed and the molecules were left to self-assemble within the bilayer.
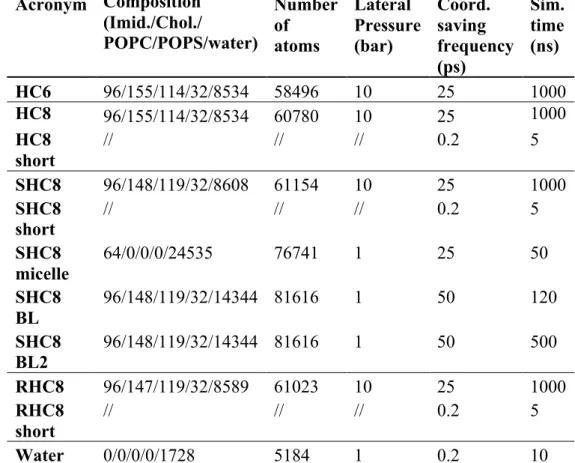
Table 1 Overview of all simulations. Acronym Composition (Imid./Chol./ POPC/POPS/water) Number of atoms Lateral Pressure (bar) Coord. saving frequency (ps) Sim. time (ns) HC6 96/155/114/32/8534 58496 10 25 1000 HC8 96/155/114/32/8534 60780 10 25 1000 HC8 short // // // 0.2 5 SHC8 96/148/119/32/8608 61154 10 25 1000 SHC8 short // // // 0.2 5 SHC8 micelle 64/0/0/0/24535 76741 1 25 50 SHC8 BL 96/148/119/32/14344 81616 1 50 120 SHC8 BL2 96/148/119/32/14344 81616 1 50 500 RHC8 96/147/119/32/8589 61023 10 25 1000 RHC8 short // // // 0.2 5 Water 0/0/0/0/1728 5184 1 0.2 10
General Molecular Dynamics Simulation Analysis
MD simulation analyses were performed using in house developed VMD24 scripts. Pore profiles were computed using the Hole software25.
Water Dynamics Analysis
Water dynamics were analyzed using the water analysis code of MDAnalysis26. Continuous hydrogen bonds (HB) lifetime was computed as in Luzar et al.27, by computing the individual water hydrogen bond lifetime autocorrelation function:
𝐶!" 𝑡 = ℎ!" 𝑡! ℎ!" 𝑡!+ 𝑡 ℎ!" 𝑡! !
where hijis a binary function taking value 1 if the HB donor-acceptor pair i j meets the geometric hydrogen bond criteria; or zero otherwise. A HB is considered formed if the distance between the donor and the acceptor is less than 4 Å and the formed D-H-A angle is less than 110°. The time correlation is taken only for continuous bond formation times, therefore the reforming kinetics is excluded. All water oxygen atoms are considered as possible donors and acceptors, whereas non-protonated imidazole nitrogen atoms are considered as possible acceptors. We used a double exponential function to fit the 𝐶!" 𝑡 :
𝐶!" 𝑡 ≈ 𝐴!𝑒 !!!! + (1 − 𝐴!)𝑒
!! !!
and to extract the characteristic HB life time, 𝜏!"#$% :
Water reorientation dynamics are monitored via the second-order rotational autocorrelation function of individual dipoles28, and computed only for the time-elapse during which the water molecule is inside the channel:
𝐶! 𝑡 = 𝑃! 𝑢 𝑡! . 𝑢 𝑡!+ 𝑡
where 𝑢 is the unit vector of the water dipole direction, and P2(x) is the second Legendre polynomial given as 𝑃! = 3𝑥! − 1 2 . Again, we used a double
exponential function to fit the time correlation function 𝐶! 𝑡 : 𝐶! 𝑡 ≈ 𝐴!𝑒 !!!! + 𝐴!𝑒
!! !!
The rotational characteristic time 𝜏! is computed as:
𝜏! = 𝐴!𝜏!+ 𝐴!𝜏! 𝐴!+ 𝐴!
Similarly, the mean-squared displacement (MSD) for water inside the channel has been calculated as:
𝑀𝑆𝐷 𝑡 = 𝑟! 𝑡 − 𝑟! 0 !
where 𝑟! 𝑡 is the location of the examined water oxygen atom i at time t.
Results and Discussion
Membrane stability of I-quartet aggregates taken from crystal patches
Our first attempt to simulate I-quartet-based artificial water channels consisted in inserting patches of 96 molecules based on the I-quartet crystal structures into membrane bilayers. The membrane composition with a 5:4:1 ratio of Chol.:POPC:POPS and the I-quartet to lipid ratio were similar to the ones used during experimental transport characterization as described in Licsandru et al.1. Different behavior was observed for the four systems. Despite the use of a lateral pressure of 10 bar to stabilize the inserted aggregate, the arrangement of HC6 molecules quickly drifted away from the crystal organization. After 300 ns, the RMSD rose dramatically (Fig. 2A). A detailed analysis of each single molecule (Fig. 2B) reveals that at this time almost none of the imidazole molecules were in the crystalline form any more. The same behavior could be observed for HC8, but on a slower time scale, with such profound reorganization only occurring towards the end, after 800 ns of simulation.
Figure 2. Stability of the membrane-inserted I-quartet channels. (A) RMSD of I-quartet heavy atoms compared
to the starting crystal structure, RMSD has been computed only on the most stable half of the I-quartet molecules. (B) Time series of the fraction of I-quartet molecules still in the crystalline form. To define whether a molecule is still in the crystalline form, its individual RMSD should be less than 5 Å from the crystal position. The final shape of the HC8 compounds in a membrane environment, as displayed on Figure 3, does not show any regular organization but resembles more a loosely aggregated so-called “sponge”-like organization. In the latter sections we will discuss the effect of this disordered state compared to the ordered ones on water permeability in more detail.
Figure 3. Initial and final water-wire (water molecules in licorice representation with oxygen in red and
hydrogen in white) and dipole (yellow arrows) orientations within the I-quartet HC8, RHC8 and SHC8 channels (grey surface). For the final step, an additional panel depicts the electrostatic potential field across the membrane and water channel region for HC8, SHC8 and RHC8 systems. I-quartet molecules are shown as sticks and a volume slice of the electrostatic potential density map is shown in the background. The electrostatic potential map is depicted using a color scale, from negative values (-100 kT/e) in dark blue, to neutral values in white, to positive values in red (100 kT/e).
It should be noted that a clear electrostatic pattern emerges for the chiral RHC8 and SHC8 systems, whereas the HC8 arrangement does not build up such directionality (Fig. 3, bottom row). RHC8 and SHC8 systems also form the most stable
structures, with an RMSD of half of the most stable I-quartet molecules converging around 2.5-3 Å. Similarly, the fraction of molecules remaining in the crystal form seems to stabilize around 60% towards the end of the simulation (1 µs). This consolidation of the structure occurs despite the important reorganization observed compared to the initial crystal structure. Visual inspection of the I-quartet arrangement at the end of the simulation shows that upper and lower leaflets tend to depart from the crystal packing first, whereas molecules in the hydrophobic core of the membrane remain the closest to the initial crystal organization, constituting a central core of molecules in a crystal-like pattern.
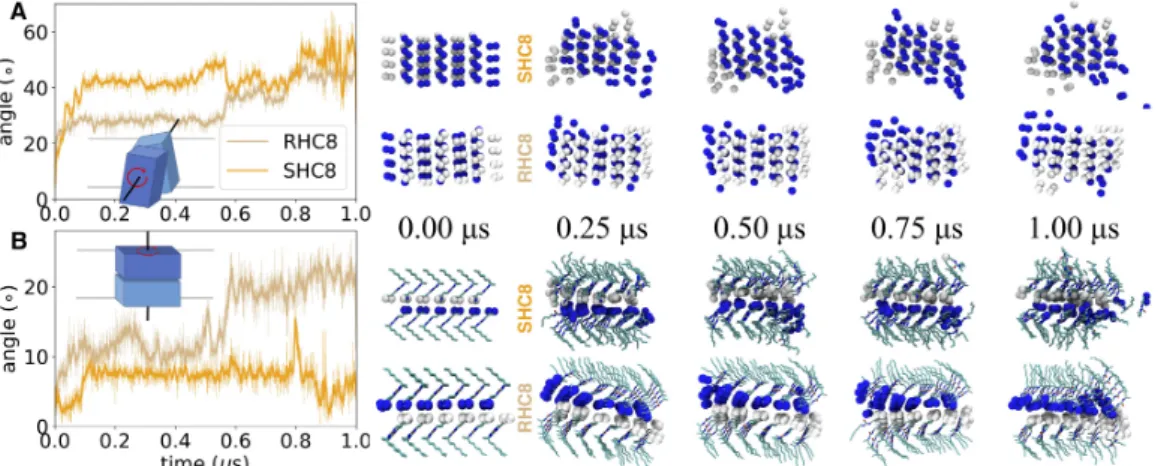
A strong overall reorganization was observed for RHC8 and SHC8: the rotation between lateral slices (Fig. 4A) increases dramatically in less than 50 ns, by about 28° for RHC8 and up to 42° for SHC8. The difference in rotation amplitude between RHC8 and SHC8 might explain some part of the previously noted RMSD difference observed in the first half of the simulations.
Figure 4. Rotational reorientation of I-quartet sheets along two axes. A, Sideways rotation around an axis
parallel to the membrane plane, between lateral I-quartet leaflets. B, In-plane rotation between upper and lower I-quartet layers around an axis perpendicular to the membrane. On all snapshots, imidazole nitrogen atoms are represented as van der Waals spheres, colored as a function of I-quartet slices (blue and white). On the in-plane rotation snapshots, remaining I-quartet atoms are represented as sticks, colored as a function of atom type: carbon, nitrogen and oxygen atoms colored in cyan, blue and red, respectively.
In comparison, the rotation between layers of I-quartet compounds (Fig. 4B) shows a limited amplitude, around 8° for SHC8 and more than 10° for RHC8 during the first half of the simulation, then up to 20° during the second half of the simulation. In order to consistently measure the rotation over the full simulation period, its value was only computed for the stable core of the I-quartet channels. These robust selections used to compute the angle between leaflets were only separated by 10 Å in the z axis. The initial size of the channels along the same axis is superior to 30 Å. Depending on the stability of the channels (the upper and lower leaflets being the first ones to leave the crystal organization), the amplitude of the rotation angle between the upper and lower leaflets could be multiplied by a factor of two to three. Consequently, both rotations are in the same amplitude range and denote a strong and quick reorganization of the crystal pattern.
Water permeation and leakage through I-quartet channel pores
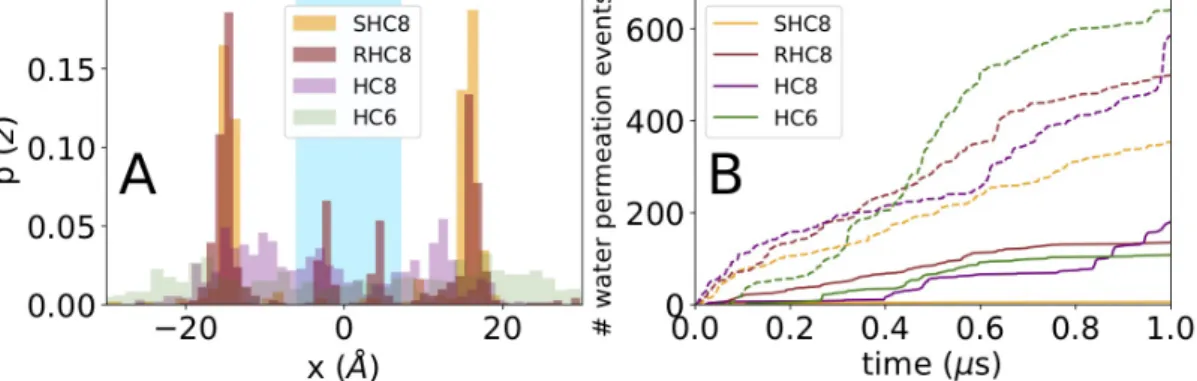
For all simulations, the water and ionic permeation across the membrane was measured. Consistent with bilayer membrane transport experiments1, ionic permeation was nil for all systems. Concerning water (Fig. 5A), the observed permeation events occur prominently at lateral positions corresponding to the most membrane exposed and perturbed channel structures of the inserted crystal patch.
During the simulation timescale of 1µs, we observe a consistent number of membrane crossing events in all systems, ranging from 320 for SHC8 up to 600 for HC6. In the central channel the permeability is much reduced showing a drop of about a factor 3-4. The case of SHC8 is probably the most illustrative, only 6 permeation events out of a total of 360 could be observed in the two central channels that remain close to the ones observed in the crystal. Concerning HC8 and HC6, permeation in the central channel was almost nil at the beginning of the simulation until the onset of a strong disorganization of the initial crystal shape (Fig. 5B). In fact, in the two central HC8 channels, the continuous single file water wire was disrupted quickly, with only one out of two crystal water sites occupied.
Figure 5. Water transport activity time series for membrane-inserted HC6, HC8, SHC8 and RHC8 I-quartet
compounds. A Quantification of water permeation events as a function of lateral permeating water position in the crystal patch. Cyan background emphasizes a central water channel position, protected from the lipids, in contrast to white background displaying lateral and membrane exposed channels. B Cumulated transport of water molecules across the membrane in both outward and inward directions. Central pore transport is shown as plain lines, whereas lateral channel transport events are indicated as dashed lines.
Table 2 Experimental and simulated water conductance. For HC6 and HC8, water conductance was computed
for two cases: when the structures were ordered or in a sponge-like structure. Simulation times used to differentiate both structures were 300 and 850 ns for HC6 and HC8, respectively. The sponge-like channel was considered as a four channel structure. Literature references for experimental values and aquaporin simulation conductance are indicated between parentheses.
Water conductance (molecules/s/channel)
Experimental Central Membrane
exposed Sponge-like
Aquaporin(AQP1) ~1× 10⁹ (29) 1.6× 10⁹ (30) - -
HC6 - 3.8 × 10⁶ 7.6 × 10⁶ 4.8 × 10⁷
HC8 1.4 ± 0.4 106 (1) 3.5 × 10⁶ 2.6 × 10⁷ 8.9 × 10⁶
RHC8 7.9 ± 2.1 105 (1) 6.8 × 10⁷ 7.9 × 10⁷ -
SHC8 1.5 ± 0.1 106 (1) 3.0 × 10⁶ 1.2 × 10⁷ -
The average duration of permeation events, despite a broad range of deviations, was always faster for lateral channels than for central ones. For SHC8, the average time of permeation was 78 ± 97 vs. 13 ± 50 ns, for central and lateral channels respectively. For RHC8, a clear difference could be observed with 23 ± 21 vs. 8 ± 24 ns, however, for HC8 and HC6 the difference was negligible with 8 ± 23 vs. 6 ± 9 ns and 7 ± 11 vs. 5 ± 7 ns, respectively.
Compared to experimental conductance (Table 2), simulations predict values of the same magnitude for central channels (~3 × 10⁶ mol/s/channel) with the exception of RHC8, which features a one order of magnitude higher permeation rate. Similarly, membrane exposed and sponge-like structures display higher conductance (~ 107 mol/s/channel).
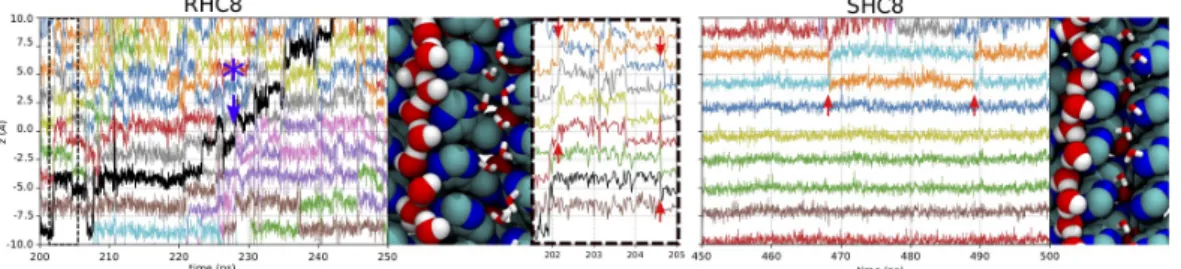
It should be noted that the permeation is not linear in time, with intermediate periods of waiting time, probably related to transitions between close states occurring at the timescale of 102 ns. Indeed, the travelling of water along the channel occurs via a site-by-site jump dynamics, with a localization time in each site > 1 ns. The displacement occurs in a concerted way with several water molecules diffusing coherently along the transmembrane direction5. This process is highlighted in Figure 6 where we show the dynamic behavior of a single water wire in one of the two central channels for the RHC8 system. One full permeation event was observed during this period and is highlighted as black curve in Fig. 6; the permeation occurs through a succession of backward and forward jumps. In contrast, for SHC8, we observe a quasi-static situation, with a few occasional local switches as highlighted in Fig. 6.
Figure 6 Example of single water wire dynamics in I-quartet channels. The z axis position of water molecules in
individual channels is plotted for selected time intervals (200-250 ns for RHC8 and 450-500 ns for SHC8). On each panel, all water molecule positions are displayed with differently colored curves, representing the z positions of a water molecule oxygen atom as a function of time. On the RHC8 panel, a water molecule crossing the channel from the bottom to the top is displayed as a black curve, a position jump, indicated by a blue star, is detailed in Figure 12A. For the same system, an additional zoomed graph shows more detailed water dynamics between 200 and 206 ns. The inset illustrates a coordinated water movement, depicted by red arrows. For each AWC system, a snapshot picture on the right displays the followed water molecules as red and white van der Waals spheres; I-quartets are shown as blue and cyan spheres, whereas neighboring channel water molecules are represented as red and white sticks.
To characterize the channel geometry and its influence on permeation, we computed the pore profile of one of the central channels for the three most organized HC8, RHC8 and SHC8 systems (Fig. 7). As mentioned before, the pore of HC8 collapses early on in the simulation, which was confirmed by the pore profile calculation, first maintaining a crystal-like organization of the I-quartets, later followed by a transition to a disordered sponge-like arrangement. The time series of the minimal pore radius drops quickly to less than 0.4 Å, compared to values oscillating between 1.0 and 1.2 Å for RHC8 and SHC8 (Fig. 8). However, and interestingly, as soon as the central channels become disordered (membrane exposed HC8 molecules leaving the complex, time > 400 ns) we observed increasingly high permeability for this system.
Figure 7. Pore profiles of the central water channels for HC8, RHC8 and SHC8 compounds. Average pore
profiles across the membrane axis were computed by taking a 50 ns average over instantaneous values calculated with the hole25 software for HC8, RHC8 and SHC8. Pore profiles are colored according to the time interval used for averaging.
Focusing on the structurally more stable constructs, substantial differences in pore profiles are observed between RHC8 and SHC8. In the first part of the simulation, both pore profiles display the same oscillatory character mirroring the ordered crystalline structure. For SHC8 the pore profile then rapidly flattens after 50ns, whereas for RHC8 it maintains the oscillatory profile at least until 500 ns. For these two very stable systems the ordered crystalline structure in the central channel seems to grant water permeability, allowing water to experience alternate closed vs. open states (low and high pore radius). The lack of crystalline order causes an average restriction of the pore with associated decreased permeability.
Figure 8. Time series of instantaneous minimal pore radius calculated with the hole software25. For each time
step, minimal pore radius is indicated as colored points, for clarity smoothed data using a sliding moving average is shown as plain line.
Our finding suggests two different scenarios. When the constructs manifest a stable structure, the central channel favors permeability only when it maintains a crystalline-like alternate open/closed pore radius profile along the z direction. These alternate states allow for jump events necessary for water transport, see Figure 6. When the alternate pore profile is lost, even the most stable system (SHC8) does not manifest any transport in the central channel. However, two elements suggest that the most interesting scenario for permeability relates to the presence of at least some amount of disordered states. First, for all systems, the higher permeability is always observed in the lateral channels in proximity with the membrane interface, where the structure is more disordered. Secondly, for the very unstable HC6 and HC8 systems, while the crystalline structure is lost in favor of a sponge-like configuration, permeability is always high in both lateral and central channels. This result is somewhat at odds with stopped-flow light scattering experiments1, in particular for HC6, where water/proton conduction follows the order SHC8>RHC8>HC8>>>HC6. This contradiction can be related to the fact that the
disordered sponge structure for the HC6 system, on the long-time scale, can lose permeability because of a further degradation and transformation of the aggregate. This decay was already observed for the HC6 system1 at 1 bar of lateral pressure: an increased permeability could be observed during the reorganization in a “sponge” structure, but towards the middle of the simulation (400 ns), the permeability suddenly dropped and only a few permeation events could be observed for the rest of it. The experimental rank for water transport reinforces the idea that the simulation system size effect is an essential aspect to model the process in silico, since it is plausible that most of the water flow should occur at the lateral channels. To enhance the presence of these paths in the construct could be an avenue for further designs.
From the quantitative point of view, we must also point out that due to the absence of osmotic pressure in our simulations and the relatively short time scale spanned by the simulations (hence limited statistics), our data is not intended to reproduce experimental water permeation rates quantitatively. Future simulations may address this issue by mimicking such effects through hydrostatic pressure31 or osmotic gradients32 and by improving sampling and statistics.
In depth characterization of picosecond scale water dynamics
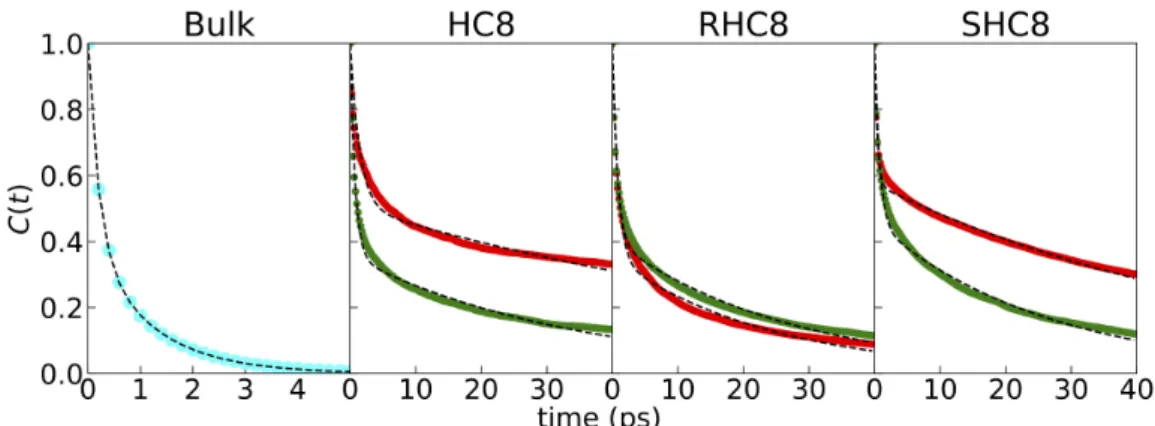
While the water transport occurs at the nanosecond time scales, it is also interesting to characterize water dynamics at short time scale, when the molecule is located in a specific site inside the channel. For this purpose, we conducted an additional 5 ns simulation for each of the HC8, RHC8 and SHC8 systems, starting from the previous simulations at time 100 ns. At this time all I-quartets structures are relatively close to the crystal organization. In future work, we may also run a similar analysis on the sponge-like disordered HC8 aggregate for comparison. The system coordinates were saved every 200 fs of the simulation, allowing to follow water dynamics with a higher time resolution required for the analyses carried out. We first computed the water hydrogen bond breaking kinetics (Fig. 9) and extracted hydrogen bond lifetimes τHbond (Table 3) for central (in red color) and membrane exposed (in green) water channels, as well as for bulk water as a reference. For all channels we observe a slow decay with characteristic time τHbond ~9-42 ps depending on the system, and the type of channel (inner or membrane exposed). The characteristic time is therefore much longer than the one observed in bulk solution, a slowdown due to the strong confinement33 (excluded volume) and the limited number of hydrogen bond switching partners in the local environment. For HC8 and SHC8, a clear difference between central and membrane exposed channels could be observed: for central channels τHbond is around 40 ps, whereas membrane exposed channels depict lower values around 10 ps. Interestingly, for RHC8, both channels show similar values around 10 ps, suggesting a similar dynamic behavior.
Figure 9 Water hydrogen bond lifetime autocorrelations. For each system, hydrogen bond autocorrelation is
colored in red and green for central and membrane exposed channels, respectively. On the left panel the bulk autocorrelation function colored in cyan is displayed for reference. For each autocorrelation function, the double exponential function fit is depicted as a dashed line. It should be noted that for clarity, the time scale is different for bulk water (0-5 ps) and for artificial channel water (0-40 ps).
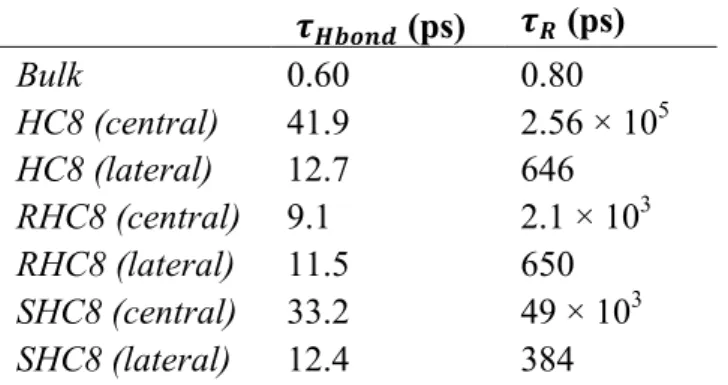
Water dipole orientation relaxation (Fig. 10 and Table 3) shows results in agreement with the hydrogen bond lifetime analysis. We could observe extremely slow relaxation for central channel water of HC8 and SHC8 (τR of 256.103 and 49.103 ps). The extreme relaxation of HC8 could be explained by the fact that the water wire within the channel is no more continuous, only one in two positions being filled by a water molecule, and that consequently water can only interact with HC8 imidazole sites, which induces restrictions for lowering barriers to reorientations. Considering that mean square fluctuations (Fig. 11) monitor the local fluctuations, at the sub-nanosecond timescale water is far from a diffusive regime, and manifests rather a confined dynamics. In the lateral channels we have a jump event from one site to another corresponding to a displacement of about 3 Å, for times in 725, 500, 420 ps for the systems, HC8, RHC8, SHC8, respectively. In the central part the displacement times are much longer, coherently with the lower trans-membrane transport.
Figure 10 Water dipole orientation relaxation within the water channels. Autocorrelations of the dipolar
moment’s angle with respect to the membrane normal for central and membrane exposed channels are displayed as red and green points, respectively. The left panel displays bulk dipole relaxation as cyan points. For each autocorrelation function, the double exponential function fit is depicted as a dashed line. It should be noted that for clarity time scale is different for bulk water (0-4 ps) and channel waters (0-200 ps).
Figure 11 Oxygen water Mean Square Deviation (MSD). Central and membrane exposed channel water MSD measurements are displayed as red and green points, respectively. Reference bulk water MSD is colored in cyan. For each MSD graph, the linear fit between 10 and 40 ps is depicted as a dashed line. It should be noted that for clarity, the MSD scale is different for bulk water (0-150 Å2) and channel water (1-3 Å2). Table 3 Water Dynamic properties: hydrogen bond lifetime and rotational reorientation time 𝝉𝑯𝒃𝒐𝒏𝒅 (ps) 𝝉𝑹 (ps) Bulk 0.60 0.80 HC8 (central) 41.9 2.56 × 10⁵ HC8 (lateral) 12.7 646 RHC8 (central) 9.1 2.1 × 10³ RHC8 (lateral) 11.5 650 SHC8 (central) 33.2 49 × 103 SHC8 (lateral) 12.4 384
While such local dynamics provide some interesting clue about the local organization of the channel, it is even more interesting to follow the jump event associated with the transport across the membrane. A detailed investigation will be reserved for a further work. However, for one selected study case observed in the RHC8 system (see black trace in Figure 6), we show the correlation among the evolution along the z direction, and the orientation of the dipole moment as Figure
12A. It is obvious that any jump in the z direction requires a reorientation of the
dipole associated to the breaking and forming of a new hydrogen bond along the channel spine. While the actual transition is fast, the overall mechanism operates at a significantly longer timescale as it is rate limited by excluded volume and hydrogen bond strength factors33.
Membrane exposed channels of RHC8 have similar 𝜏!"#$% and 𝜏! values compared
to central channels, however, the water diffusion process shows great discrepancy (Fig. 11), as illustrated by one water jump snapshot shown on Figure 12B. More generally, membrane exposed channels show higher water permeation (Fig. 5B,
Table 2), and could be considered as an intermediate between central ordered
channel and sponge-like disordered structure permeation scenarios.
In sponge-like aggregates, permeation is high on the simulated timescale, the mechanism of permeation as illustrated in Figure 12C is rather complex, warranting further investigations to understand more clearly the water dynamics involved in this event.
Figure 12. Snapshot of Water jump and dipolar moment reorientation in RHC8 and HC8. A RHC8 central
channel permeation. The water molecule of interest is the one depicted by the black curve on Figure 6. B RHC8 membrane exposed channel permeation. C HC8 permeation in a sponge-like channel. On left panels, all molecules are represented as VdW spheres, lipid carbon atoms are colored in orange. On right panels, the water molecule of interest is represented as thick stick, other channel waters are represented as thin sticks, while the RHC8 molecules are shown as VdW spheres (molecules in the first plane are omitted for clarity). The water dipole moment is shown as a yellow arrow, whereas hydrogen bonds involving the water molecule of interest with other channel waters are indicated as orange dashed lines and with HC8 or RHC8 as purple dashed lines.
Directions to go beyond simulations of small crystal patches
The simulations reported above expose two major limitations: the inserted crystal patches are relatively small, and the arrangement to form channels is predefined by the crystal matrix. Because of the limited size, the currently simulated crystal patches exhibit a large part that is in direct contact with the lipids of the bilayer, which induces perturbations. This is nicely illustrated with the comparison between "lateral" channels that are membrane exposed and exhibit different properties than central channels, protected from the lipid perturbations. An obvious workaround is to increase the size of the crystal patch until a stable core of a significant size can be simulated. As an important question relates to the structural integrity and stability of the channel forming structures, it may also be required to increase the realism with which the membrane environment is modeled. This may pertain to the precise composition and to the presence of possible stabilizing driving forces such as cross-bilayer gradients. In terms of composition, we noticed for instance some specific interactions of cholesterol with the crystal patch boundary region that would warrant further investigation. In terms of gradients, osmotic pressure and electric fields are obvious extensions that can be taken into account in the modeling.
In order to move away from imposing a preformed channel structure in the simulations, a natural way to address the issue would be to simulate rather the full process of dissolution, solubilisation and subsequent membrane insertion of such a
crystal patch. In terms of molecular simulations, this approach is, of course, an extremely time-consuming one. Alternatively, one may carry out self-aggregation runs starting from a random mixture of constituents, which can significantly speed up the computations. We have explored this approach and discuss the first observations in the following paragraph.
Exploratory self aggregation simulations of the SHC8 system
In order to study the mechanism of structured water permeation induced by I-quartet molecules' self-assembly in phospholipid membranes, and to remove possible biases from the crystal structure, we started to explore the behavior of a fully randomly distributed mixture of all components (the channel-forming molecules of interest, phospholipids, water and ions). The water conducting supramolecular structure is expected to assemble itself during the membrane formation process. This strategy was applied to the SHC8 compound. Several combinations of the simulation parameters were tested in order to establish the optimum settings. It was found, as previously described34, that an initial simulation using an isotropic pressure scheme, followed by an adequately long semi-isotropic coupling, yielded the best results. In order to favor the membrane formation during the isotropic coupling stage, it was found that the initial cubic simulation box side length has to be commensurate with the side length of the membrane patch, which is expected to be finally formed. Figure 13 presents the results of the self-assembly process. It can be seen that the membrane was almost completely assembled after around 100 ns. In the final equilibrated membrane, the SHC8 molecules were randomly dispersed with no detectable channel-like structure traversing the membrane. Still, water may permeate by transiently forming pores, as observed for short-lived porous structures found in the membrane immediately after its formation (Fig. 13B).
Figure 13 A, Snapshots taken from the MD simulation of SHC8 (in blue) membrane self-assembly from fully
random mixtures (from top-left to bottom-right: 0 ns, 3.5 ns, 16 ns, 94 ns, 110 ns and 220 ns). B, Detail of a porous structure assembled in the membrane right after the bilayer formation, emphasizing the possibility of water permeation.
An alternative approach is to insert molecules in an already formed and equilibrated membrane, either as a whole micelle or as individual molecules. The first method of inserting a micelle in the membrane that we tested implied 3 steps: (a) in the first step, a certain number of evenly distributed SHC8 molecules were added into the water layer above the membrane and were left to freely form a micelle; (b) the
second step involved the pulling of each SHC8 molecule from the previously formed micelle towards the middle of the membrane (on the z axis) and (c) the third step (the production run) simulated the freely evolving system with the micelle embedded in the bilayer. It could be observed by visual inspection that the pulled molecules also dragged the surrounding SHC8 molecules with them and thus a micelle-like structure formed inside the bilayer at the end of the process (Fig. 14A). Unfortunately, together with the SHC8 molecules, the phospholipid heads, cholesterol and water molecules were also forced towards the center of the bilayer, inducing a general perturbation of the membrane. However, several features became apparent during the production run (Fig. 14B). SHC8 molecules started to migrate towards the surface of the membrane and to align with their alkyl chains to the bilayer normal. Their imidazole-urea ends started to partition into the phospholipid’s polar head region. Porous aggregate structures, delimited by imidazole rings, were also visible (Fig. 14C). Analysis of inter-atomic contacts and hydrogen bonds between SHC8 molecules showed reduced variations reflecting the slow and incomplete system relaxation on the current simulation time scale. In our opinion this approach suffers from several drawbacks, the most important one being the structural damage on the bilayer.
Figure 14 A, MD snapshots during the SHC8 micelle insertion process. Phosphorus atoms of POPC and POPS
were represented as orange van der Waals spheres to highlight the membrane space. B, Initial and final structures of the SHC8 aggregate from the production simulation. C, Structural detail of a porous structure selected from the aggregate in the middle of the bilayer highlighting a water permeation pathway.
The second alternative approach that we tested involved randomly embedding individual molecules. Our protocol started with SHC8 molecules evenly distributed on both sides of the membrane. Restraints were applied on their x and y coordinates (that is in the plane parallel to the membrane) to prevent micelle formation during the pulling process. After their complete insertion, the restraints were removed and the molecules were left to self-assemble in the bilayer. During this step the
molecules started to diffuse towards the membrane surface inserting themselves with their imidazole-urea end into the polar head region. A dynamic, imidazole delineated channel-like structure formed around the center of the membrane patch
(Fig. 15). This structure was stable for the last 300 ns of simulation. By using this
approach, structural rearrangements that may sub-serve larger aggregates or ordered structure formation could not be observed so far on the current simulation time scale.
Figure 15 A, Snapshots of the random insertion MD trajectory at the beginning and at the end of the
production simulation (orange spheres represent P atoms of POPC and POPS lipids). B, Structural detail of a channel like structure selected from the aggregate, depicting water permeation.
As a general conclusion, considering that the equilibration of the self-assembled supramolecular structures in the membrane environment is driven by rate-limiting rare events, implying long waiting times, conventional molecular dynamics simulations may be too slow and costly as simulation approach. The long times required for the small molecule self-organized aggregates to relax inside the membrane environment impose a highly inefficient sampling of relevant conformations by current simulations. After initial self-assembling structures are obtained starting from random initial conditions, enhanced sampling methods may be required to fully equilibrate such structures.
Two contrasting, yet complementary views of water transport: ordered water wires vs porous sponges
The simulation approaches we report herein to characterize I-quartet water channel properties in a membrane environment lead to two plausible transport scenarios. The crystal patch simulations suggest a well-organized and structured pre-defined route for water permeation, somewhat reminiscent of biological channels. A more dynamic and disorganized view emerges from the self-assembly and insertion simulations, where porous, sponge-like membrane perturbations catalyze water permeation. Membrane-exposed channels feature an intermediate situation. Significantly longer simulations would be needed to possibly converge to a common scenario, which may, furthermore, be dependent on the simulation box size, the composition and concentration of the various compounds.
From an experimental point of view, the trends among HC8, RHC8 and SHC8 observed in the crystal patch simulations, the feature of a chiral organization for the latter two compounds, and the specific properties of the single file water molecules, seem to match the measurements for these C8-chain compounds quite well as detailed in Kocsis et al. and recalled in table 216. Experimental characterization of
shorter chain C4- and C6-compounds actually may be in line with the sponge-like permeation picture. Unfortunately, experimental data on the structural characterization in a membrane environment is yet missing to assess this. Possibly both the structured and disordered scenarios may be in equilibrium with different weights depending on the specific properties of a given compound.
Conclusions
We presented results from simulations of I-quartet compounds in a membrane environment, where we extended previous simulations of crystal patches to a consistent 1 microsecond duration to provide improved and detailed analysis of structural and transport properties. As an alternative approach to characterize possible membrane arrangements of these compounds, we presented self-aggregation simulations starting from a random mixture of compounds, or intermediate micellar structures. A different picture emerges in both cases, ranging from a strongly organized single file water transport scenario via an intermediate semi-structured case, to a local membrane perturbation view, where porous micro-structures may lead the way to permeation. We obtained first insights on the structured transport mechanism hinting at a specific water jump dynamics to move through the channel. In future work, these precise underlying molecular mechanisms will be further analyzed for both scenarios.
Acknowledgements
This work was conducted within the ANR-15-CE29-0009 DYNAFUN project (Mihail Barboiu). The study was further supported by the "Initiative d'Excellence" program from the French State (Grant "DYNAMO", ANR-11-LABX-0011-01 and ANR-11-EQPX-0008). Computational work was performed using HPC resources from GENCI-CINES (grant number 2016-072292) to Marc Baaden. This publication received support from the European Union’s Horizon 2020 research and innovation programme under Grant No. 667387 WIDESPREAD 2-2014 SupraChem Lab.
References
1 E. Licsandru, I. Kocsis, Y. Shen, S. Murail, Y.-M. Legrand, A. van der Lee, D. Tsai, M. Baaden, M. Kumar and M. Barboiu, J. Am. Chem. Soc., 2016, 138, 5403–5409.
2 M. Barboiu, Chem. Commun., 2016, 52, 5657–5665.
3 D. Naranjo, H. Moldenhauer, M. Pincuntureo and I. Díaz-Franulic, J. Gen.
Physiol., 2016, 148, 277–291.
4 P. Agre, Angew. Chem. Int. Ed Engl., 2004, 43, 4278–4290.
5 E. Tajkhorshid, P. Nollert, M. Ø. Jensen, L. J. W. Miercke, J. O’Connell, R. M. Stroud and K. Schulten, Science, 2002, 296, 525–530.
6 M. Kumar, M. Grzelakowski, J. Zilles, M. Clark and W. Meier, Proc. Natl.
Acad. Sci. U. S. A., 2007, 104, 20719–20724.
A. Hammer, P. A. Heiney and V. Percec, J. Am. Chem. Soc., 2007, 129, 11698– 11699.
8 Y. Le Duc, M. Michau, A. Gilles, V. Gence, Y.-M. Legrand, A. van der Lee, S. Tingry and M. Barboiu, Angew. Chem. Int. Ed., 2011, 50, 11366–11372. 9 M. Barboiu, Angew. Chem. Int. Ed., 2012, 51, 11674–11676.
10 M. Barboiu and A. Gilles, Acc. Chem. Res., 2013, 46, 2814–2823.
11 X.-B. Hu, Z. Chen, G. Tang, J.-L. Hou and Z.-T. Li, J. Am. Chem. Soc., 2012, 134, 8384–8387.
12 W. Si, L. Chen, X.-B. Hu, G. Tang, Z. Chen, J.-L. Hou and Z.-T. Li, Angew.
Chem. Int. Ed., 2011, 50, 12564–12568.
13 J. S. Hub, H. Grubmüller and B. L. de Groot, Handb. Exp. Pharmacol., 2009, 57–76.
14 J. C. Rasaiah, S. Garde and G. Hummer, Annu. Rev. Phys. Chem., 2008, 59, 713–740.
15 Y. Shen, W. Si, M. Erbakan, K. Decker, R. D. Zorzi, P. O. Saboe, Y. J. Kang, S. Majd, P. J. Butler, T. Walz, A. Aksimentiev, J. Hou and M. Kumar, Proc.
Natl. Acad. Sci., 2015, 112, 9810–9815.
16 I. Kocsis, M. Sorci, H. Vanselous, S. Murail, S. E. Sanders, E. Licsandru, Y.-M. Legrand, A. van der Lee, M. Baaden, P. B. Petersen, G. Belfort and M. Barboiu, Sci. Adv., 2018, Under Press.
17 B. L. de Groot and H. Grubmüller, Curr. Opin. Struct. Biol., 2005, 15, 176– 183.
18 P. Vidossich, M. Cascella and P. Carloni, Proteins Struct. Funct.
Bioinforma., 2004, 55, 924–931.
19 J. B. Klauda, R. M. Venable, J. A. Freites, J. W. O’Connor, D. J. Tobias, C. Mondragon-Ramirez, I. Vorobyov, A. D. MacKerell Jr. and R. W. Pastor, J Phys
Chem B, 2010, 114, 7830–43.
20 W. L. Jorgensen, J. Chandrasekhar, J. D. Madura, R. W. Impey and M. L. Klein, J. Chem. Phys., 1983, 79, 926–935.
21 K. Vanommeslaeghe, E. Hatcher, C. Acharya, S. Kundu, S. Zhong, J. Shim, E. Darian, O. Guvench, P. Lopes, I. Vorobyov and A. D. Mackerell, J. Comput.
Chem., 2010, 31, 671–690.
22 K. Vanommeslaeghe and A. D. MacKerell, J. Chem. Inf. Model., 2012, 52, 3144–3154.
23 B. Hess, C. Kutzner, D. van der Spoel and E. Lindahl, J. Chem. Theory
Comput., 2008, 4, 435–447.
24 W. Humphrey, A. Dalke and K. Schulten, J Mol Graph, 1996, 14, 33–8, 27– 8.
25 O. S. Smart, J. G. Neduvelil, X. Wang, B. A. Wallace and M. S. P. Sansom,
J. Mol. Graph., 1996, 14, 354–360.
26 N. Michaud-Agrawal, E. J. Denning, T. B. Woolf and O. Beckstein, J.
Comput. Chem., 2011, 32, 2319–2327.
27 A. Luzar and D. Chandler, Nature, 1996, 379, 55–57.
28 Y. Yeh and C.-Y. Mou, J. Phys. Chem. B, 1999, 103, 3699–3705.
29 M. L. Zeidel, S. V. Ambudkar, B. L. Smith and P. Agre, Biochemistry
(Mosc.), 1992, 31, 7436–7440.
30 B. L. de Groot and H. Grubmüller, Science, 2001, 294, 2353–2357. 31 F. Zhu, E. Tajkhorshid and K. Schulten, Biophys. J., 2002, 83, 154–160. 32 Y. Luo and B. Roux, J. Phys. Chem. Lett., 2010, 1, 183–189.
4116–4119.
34 A. A. Skjevik, B. D. Madej, C. J. Dickson, C. Lin, K. Teigen, R. C. Walker and I. R. Gould, Phys Chem Chem Phys, 2016, 18, 10573–10584.