HAL Id: inserm-00182959
https://www.hal.inserm.fr/inserm-00182959
Submitted on 6 Jun 2008
HAL is a multi-disciplinary open access archive for the deposit and dissemination of sci-entific research documents, whether they are pub-lished or not. The documents may come from teaching and research institutions in France or abroad, or from public or private research centers.
L’archive ouverte pluridisciplinaire HAL, est destinée au dépôt et à la diffusion de documents scientifiques de niveau recherche, publiés ou non, émanant des établissements d’enseignement et de recherche français ou étrangers, des laboratoires publics ou privés.
Early loss of HIV-infected patients on potent
antiretroviral therapy programmes in lower-income
countries.
Martin Brinkhof, François Dabis, Landon Myer, David Bangsberg, Andrew
Boulle, Denis Nash, Mauro Schechter, Christian Laurent, Olivia Keiser,
Margaret May, et al.
To cite this version:
Martin Brinkhof, François Dabis, Landon Myer, David Bangsberg, Andrew Boulle, et al.. Early loss of HIV-infected patients on potent antiretroviral therapy programmes in lower-income countries.. Bulletin of the World Health Organization, World Health Organization, 2008, 86 (7), pp.559-67. �10.2471/07.044248�. �inserm-00182959�
Early loss to program in HIV-infected patients starting potent
antiretroviral therapy in lower-income countries
The ART-LINC Collaboration of the International Databases to Evaluate AIDS (IeDEA)*
* See end of paper for writing committee and members of collaboration
Correspondence to: François Dabis, MD, PhD
INSERM U.593
ISPED, Université Victor Segalen Bordeaux 2 146 Rue Léo Saignat, 33076 Bordeaux Cedex, France
francois.dabis@isped.u-bordeaux2.fr
Abstract 274 words, main text 3146 words, 4 tables, 1 figure, 26 references, 3 additional tables (available on request)
HAL author manuscript inserm-00182959, version 1
HAL author manuscript
HAL author manuscript inserm-00182959, version 1
HAL author manuscript
2
Abstract
Objective: The follow-up of patients starting antiretroviral therapy (ART) is important to monitor clinical outcomes and evaluate program effectiveness. We analysed early loss to follow-up in resource-limited settings.
Methods: Using data on 5,491 adult patients starting ART with a combination ≥3 drugs in 15 treatment programs in Africa, Asia and Latin America and ≥12 months of potential follow-up, we investigated risk factors for no up after the treatment initiation visit, loss to follow-up and death in the first 6 months after starting ART.
Findings: The median age at ART initiation was 35 years, 46% of patients were women and the median CD4 cell count was 105 cells/µl. A total of 211 patients (3.8%) had no follow-up, 880 (16.0%) were lost to follow-up and 141 (2.6%) were known to have died in the first six months. The probability of no follow-up (odds ratio [OR] 5.06, 95% CI 1.28-20.0) and loss to follow-up in the first six months (hazard ratio [HR] 7.62, 4.55-12.8), but not of recorded death (HR 1.02, 0.44-2.36) was higher in years 2003-2004 compared to 2000 or earlier. Compared to baseline CD4 cell count ≥50 cells/µl, CD4 <25 cells/µl were associated with a higher probability of no follow-up (OR 2.49 [1.43-4.33]), loss to follow-up (HR 1.48 [1.23-1.77]) and death (HR 3.34 [2.10-5.30]). Compared to free treatment, fee for service programs were associated with no follow-up (OR 3.71 [0.97-16.05]) and higher mortality (HR 4.64 [1.11-19.41]).
Conclusion: Early losses to ART programs are increasingly common in the context of scaling-up and associated with fee for service programs and more advanced
immunodeficiency at baseline. Measures to maximize program retention are required in resource-poor countries.
Introduction
The increasingly widespread use since 1996 of potent antiretroviral combination therapy (ART) has substantially improved the prognosis of HIV-infected patients in industrialized countries. 1-3 In resource-constrained settings in Africa, Asia and South America, where 90% of people with HIV/AIDS live, access to ART has improved substantially in recent years: according to the World Health Organization (WHO) an estimated two million people living with HIV/AIDS were receiving treatment in low- and middle-income countries in December 2006, representing around 28% of the estimated 7.1 million people in urgent need of treatment. 4
ART of individual patients as well as the monitoring and evaluation of HIV/AIDS treatment programs critically depends on regular and complete follow-up of patients, in order to inform individual treatment decisions in the light of clinical and laboratory results and to allow accurate estimates of treatment response, rates of complications, and mortality at the program level.
Using data from a network of treatment programs in Africa, Asia and Latin America, we examined early losses to program in individuals starting ART in low-income countries, including lack of follow-up after the initial visit and loss to follow-up and death in the first six months.
4
Methods
Study population
The Antiretroviral Therapy in Lower Income Countries (ART-LINC) collaboration of the International Databases to Evaluate AIDS (IeDEA) (see www.art-linc.org and www.iedea-hiv.org) is a network of HIV/AIDS treatment programs in Africa, South America, and Asia that has been described elsewhere. 5;6 In brief, treatment programs from low- and middle-income countries were approached to determine their interest and capacity to collaborate. Programs that systematically collected prospective data on adolescents and adults aged 16 years or older starting ART were eligible; 23 treatment programs were approached, 19 agreed to participate and 15 contributed data to the present analysis. At all sites, institutional review boards or ethics committees approved the collection of data.
Information obtained on patients included age, sex, date of starting ART, type of treatment initiated, date of last contact with the program, date of death, and, when available, CD4 cell count, WHO clinical stage, total lymphocyte count, haemoglobin and HIV-1 RNA plasma level at baseline and during follow-up. The most common ART regimens were d4T/3TC/NVP, ZDV/3TC/EFZ, ZDV/3TC/NVP and d4T/3TC/EFZ. These four combinations accounted for 66% of all regimens used. 5;6 Type of ART regimen was defined as protease inhibitor (PI)-based (2 nucleoside reverse transcriptase inhibitors (NRTIs) plus 1 PI, including ritonavir-boosted PI), non-nucleoside reverse transcriptase inhibitor (NNRTI)-based (2 NRTIs plus 1 NNRTI) and other combinations (including triple NRTI regimens and any other
regimen containing a minimum of three drugs). The characteristics of treatment programs were also recorded, including procedures in place for tracing patients lost to follow-up. We included all patients who had not previously received antiretroviral (ARV) drugs except for the prevention of mother-to-child transmission of HIV, were aged 16 years or older and had a documented date of starting ART.
Outcomes
We considered three endpoints to characterize losses to program: no follow-up, loss to follow-up and death in the first six months after starting ART. No follow-up refers to the situation when a patient never returned to the clinic after the ART initiation visit, although she or he had 12 months or more of potential follow-up until the closing date of the database. A patient was considered to be lost to follow-up if the last follow-up visit subsequent to ART initiation was recorded during the first six months after starting ART and the patient had at least another six months of additional potential follow-up until the closing date of the database. Loss to follow-up was assessed at six months to accommodate the longest interval between visits across programmes participating in the study. The closing date was defined as the date of the most recent follow-up visit in a given cohort.
Statistical analysis
Logistic regression with a random effect on cohort was used to examine factors associated with no follow-up. We used competing risk models7 to analyse time to loss to follow-up and time to death, measuring time from the start of ART (baseline). Competing risk analysis assumes that each individual is exposed to two risks, loss to follow-up and death, and accounts for the fact that these risks may not be independent. The competing risk dataset was prepared by stacking of the data and generating separate strata for death and loss to follow-up, with each patients appearing in both strata. The effect of prognostic factors on outcomes was analyzed using a Weibull proportional hazard model, controlling for cohort and stratifying by event, thus allowing the baseline hazard to differ between competing risks. Robust variance adjustment was used to allow for the fact that each individual contributed two data points. P-values for the contribution of prognostic factors to the explained variance were derived by a Wald-test. The effect of program level factors was evaluated controlling for individual level factors.
6 Some patients had missing data at baseline for CD4 cell count or clinical stage. We therefore created dummy variables, which indicated whether or not CD4 cells and clinical stage had been assessed. In sensitivity analysis we used multiple imputations of CD4 cell counts and clinical stage, as described previously. 6 The following variables were considered for inclusion in logistic and competing risk models: sex, age, CD4 cell count (<25, 25-50, >50, not measured), clinical stage, initial ART regimen, and calendar period of ART initiation (<2001, 2001-2002, 2003-2004). The choice of CD4 categories reflects the fact that there was little variation in the rate of loss to follow-up among patients with more than 50 cells/µL. Clinical stage of disease was categorised as less advanced (US Centres for Disease Control [CDC] stage A/B, WHO stage I/II), more advanced (CDC stage C, WHO stage III/IV) and not assessed. Two program level variables, free access to treatment with no cost to patients and type of follow-up (active tracing of patients versus passive follow-up), were also included in the models. All analyses were done in Stata (version 9.2, Stata Corporation, College Station, TX, USA). Results are presented as odds ratios (ORs) or hazard ratios (HRs) with 95% confidence intervals (CIs).
Results
The database included a total of 7,651 patients who started ART in 15 treatment programs in Africa, Asia and Latin America; 5,491 patients were eligible for the present analysis. The characteristics of the programs contributing data are shown in Table 1. The number of patients on ART increased rapidly, particularly in some of the African programs and the site in India. Eleven sites actively followed patients, using telephone calls (often to mobile phones), letters or home visits and 11 provided free access to treatment. The number of patients included in analyses ranged from 36 in Thailand to 1219 in Malawi and the median baseline CD4 cell count from 45 cells/µl in the township of Khayelitsha to 241 cells/µl in the Cape Town AIDS Cohort (CTAC), both in South Africa. Patient characteristics at baseline are summarised in Table 2. The median age was 35 years, 2,519 patients (46%) were women and the median CD4 cell count was 105 cells/µl. Most patients (1,727; 69%) were in an advanced clinical stage when starting ART. A total of 2,498 patients (45%) were treated in programs with active follow-up and 3,298 (60%) had free access to ART.
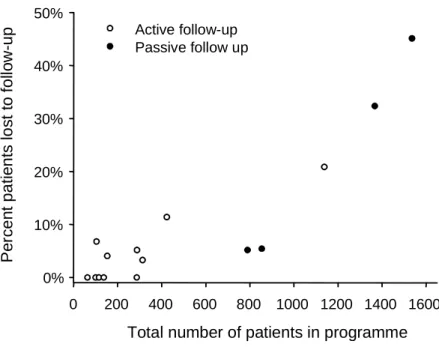
Overall 211 patients (3.8%) were not seen after the initial visit when ART was started, 880 (16.0%) were lost to follow-up later on and 141 (2.6%) were known to have died in the first six months, with considerable variation across treatment sites (Table 1). Sites with larger numbers of patients were less likely to actively trace patients who did not return to the clinic, and these sites had also higher rates of loss to follow-up (Figure 1).
Individual-level factors associated with the three outcomes are shown in Table 3: more recent calendar years of starting ART were associated with an increased probability of loss to program, both for no follow-up after the initial visit and loss to follow-up later on, with a striking increase since the year 2000: the OR for no follow-up comparing the years 2003-2004 with 2000 or earlier was 5.06 (95% CI 1.28-20.0) and the corresponding HR for loss to follow-up in the first six months was 7.62 (95% CI 4.55-12.8). Low baseline CD4 cell counts
8 and lack of CD4 measurements were also associated with loss to program, with particularly strong associations with no follow-up and death. More advanced HIV disease, and lack of an assessment of clinical stage were strongly associated with the risk of death, but not with no follow-up and loss to follow-up in the first six months. Patients aged 50 years or over were more likely to have no follow-up after the initial visit. Finally, the type of ART regimen was not associated with any of the three outcomes.
At the program level, as shown in Table 4, being treated in a fee for service program was associated with increased probability of no follow-up and death. Furthermore, programs with no active tracing of patients in place were more likely to experience losses after the initial visit and less likely to record deaths. In programs with active follow-up, death rates are higher due to improved ascertainment of deaths.
Results from sensitivity analyses based on multiply imputed data for baseline CD4 cell count and clinical stage were similar to those presented here. Additional tables with these results are available from the authors on request. Of note, 81% of cases with unknown disease staging were classified as having advanced disease following multiple imputations, and in these analyses advanced stage was associated with no follow-up after the initial visit.
Discussion
Summary of main findings
Using data from a large collaborative network of treatment programs in resource-limited settings, we investigated three important early outcomes of ART: failure to return after the first prescription of ART, and loss to follow-up and death in the first six months after starting ART. We found that only 3% of patients were known to have died by six months, but on average 21% of patients had been lost to programs by that time, including about 4% who had not been seen since receiving their first prescription of ART. Losses to program increased substantially in more recent calendar periods compared to the period before the year 2000. This suggests that many sites find it increasingly difficult to follow-up the growing population of patients, and to trace those not returning to the clinic. Confronted with the urgent, large-scale need for treatment, starting a maximum number of new patients on ART has been the top priority of many public sector programs, with the possible consequence that infrastructure and number of staff for documenting and tracing of patients lost to follow-up has become increasingly inadequate. 8
Strengths and limitations
An important strength of our study is the inclusion of a diverse group of clinics and programs, including sites that may not have reported their outcomes outside this collaborative network. This made the examination of factors that influence the probability of retention in programs both at the individual level and the level of program possible. However, we stress that the reasons for loss to follow-up were not collected systematically at the individual level. Our study has several other limitations. While the ART-LINC cohorts are broadly
representative of the types of ART services operating across resource-limited settings, the generalizability of these results requires careful consideration. A limitation of large
10 collaborative databases is the relatively small number of variables available for analysis: the standardization and harmonization of data collection across many different sites is
challenging. This means that the available information is limited, which prevents examination of factors that are more difficult to assess, for example adherence.
Another limitation is that we were unable to explore the relationships between patient numbers, the approach to tracing patients, staffing and infrastructure with losses to program: detailed, standardised and up-to-date information was not available and the size of treatment programmes was closely related to whether or not active tracing of patients was done. It was therefore not possible to unequivocally link time trends in loss to follow-up to changes in specific program characteristics over time. Program size and features of ART services that contribute to optimal patient outcomes require further investigation to inform decisions of national health systems and international donors on how to best deliver ART to large numbers of HIV-infected patients.
Results in context with other studies
We focussed on the first six months of treatment, which is a crucial period for the long-term success of ART. Initial response to ART is of long-term prognostic significance, and optimizing adherence in the early months of treatment is important to ensure long-term immunological and virological success. 9;10 Data from the ART-LINC collaboration6 and other treatment programs, for example the Médecins Sans Frontières (MSF) program in Malawi, showed that loss to follow-up and death mostly occur in the first six months after ART initiation and that community support improved outcomes. 11;12 Not all studies have shown this, however. Data from a South African ART program demonstrated that while mortality decreased rapidly after ART initiation, rates of loss to follow-up remained fairly constant during the first two years on ART. 13
Other studies of treatment programs in resource-limited settings also found high rates of loss to follow-up. For example, in the urban primary health care setting of Lusaka, 3,406 (21%) of 16,199 patients starting ART in 2004/2005 were more than 30 days late for a scheduled pharmacy appointment. 14 An evaluation of the UNAIDS/Uganda Ministry of Health HIV Drug Access Initiative, in which patients paid reduced prices for their
medications, found that 114 (24%) of 476 patients were lost to follow-up in the first year. 15 Other studies found lower rates of loss to follow-up: in Port-au-Prince, Haiti, for example, only 71 (7%) of 910 patients were lost over a median 13 months of follow-up. 16 In a large observational cohort of Médecins sans Frontières (MSF) HIV/AIDS programs 4.8% of patients were lost to follow-up over a median period of 4.1 months. 17 Unfortunately, the results from studies are often not directly comparable because definitions of loss to follow-up differed, or because no clear definition was reported. Of note, whether a patient is lost to follow-up can only be determined retrospectively, and only for patients who potentially could have been seen at the clinic before the data were analysed. Some cohorts were established in a clinical research context, with relatively small numbers of patients who were closely monitored. 18-21 These studies reported low rates of loss to follow-up, but they will not reflect the realities and constraints many clinics and programs face in the context of scaling up ART. Reasons for losses to follow-up
Few programs in resource-limited settings systematically assess the reasons for losses to follow-up, but surveys found that a substantial proportion of those lost had died. For example, among 727 patients lost to follow-up at the Lighthouse clinic in Lilongwe, Malawi, 30% had died, 19% transferred to another facility, 22% were alive and on treatment, 3% had stopped treatment and 26% could not be found. The latter group had a low median CD4 count, suggesting that some of these patients may also have died. 22 A smaller study from northern Malawi investigated the fate of 253 patients lost to follow-up and reported that 50%
12 had died, 23% were alive and 27% could not be traced, mainly because the address was incorrect. 23 Similarly, among 801 patients traced after they missed scheduled visits in Lusaka, Zambia, 46% had died. 24 Taken together, these data suggest that about 50% of patients lost to follow-up in lower-income settings may have died.
The present analysis extends our previous study of mortality in high-income and low-income countries6 and shows that free access to treatment is a critical determinant of program retention, as well as mortality. This association was particularly strong with no follow-up after ART was started, whereas there was little evidence for an association with loss to follow-up later on. Interestingly, in the UNAIDS/Uganda Ministry of Health HIV Drug Access Initiative, a fee for service program, the majority of patients (65%) who were lost did not return after their initial visit. 15 As discussed previously, 6 payments for ARVs during the initial treatment phase do not mean that households have the ability to pay later on. Provision of ART free of charge was also found to be associated with an increased probability of achieving and maintaining suppression of viral replication, and better adherence to therapy.25
At the individual level, we found that older age and profound immune suppression are associated with early losses. One might speculate that some older people fail to return to the clinic because they do not want to be a burden to their families, who may contribute to the costs of care and transport. Patients with advanced HIV infection may not return because they are too weak to travel. Access to transport is also important in this context. For example, ownership of a bicycle was associated with reduced loss to follow-up in one program, but patients’ access to individual or public transport was not consistently assessed across programs and sites. In the Lusaka program, some patients had stopped treatment because of high transport cost.23 In the large Academic Model for the Prevention and Treatment of HIV/AIDS (AMPATH) program in Eldoret, Kenya, men were more likely to be lost to
follow-up than women.26 In our study there was some evidence that men were less likely than women to return to the clinical after the initial visit.
Implications and conclusions
Our results support the notion that evaluations of the scale-up of ART in resource-limited settings should consider not only the numbers of new patients starting ART but also the number remaining in care long-term: loss to follow-up is an important indicator of programme effectiveness. 13 Our results indicate that better ART outcomes (including higher retention in programs) may be obtained in services that have smaller numbers of patients, compared to larger services, and that therefore population coverage should be achieved with smaller, decentralized facilities rather than few large programs. In general, given the large numbers of patients and limited resources facing health services, the development of strategies that prevent patients from missing appointments may be more efficient than spending resources on tracking those not returning to the clinic. 8 Future studies should address the causes of late initiation of ART13 as well as the barriers preventing some patients from returning to clinics, and record transfers to other programs and assess mortality in patients lost to programs. In conclusion, early losses to ART programs are increasingly common in resource-limited countries. This should not detract from the fact that many patients benefit from the introduction and scaling-up of ART in these settings or from the need for continued efforts to improve access to therapy.
14 Writing Committee
Martin W.G. Brinkhof, François Dabis, Landon Myer, David R. Bangsberg, Andrew Boulle, Denis Nash, Mauro Schechter, Christian Laurent, Olivia Keiser, Margaret May, Eduardo Sprinz, Matthias Egger, Xavier Anglaret.
The ART-LINC Collaboration Central Coordinating Team
Martin Brinkhof, Eric Balestre, Claire Graber (project manager), Catherine Seyler, Hapsatou Touré, François Dabis (principal investigator), Matthias Egger (principal investigator), Mauro Schechter (principal investigator).
Steering committee
Kathryn Anastos (Kigali); David Bangsberg (Mbarara/Kampala); Andrew Boulle (Cape Town); Jennipher Chisanga (Lusaka); Eric Delaporte (Dakar); Diana Dickinson (Gaborone); Ernest Ekong (Lagos); Kamal Marhoum El Filali (Casablanca); Mina Hosseinipour
(Lilongwe); Charles Kabugo (Kampala); Silvester Kimaiyo (Eldoret); Mana
Khongphatthanayothin (Bangkok); N Kumarasamy (Chennai); Christian Laurent (Yaounde); Ruedi Luthy (Harare); James McIntyre (Johannesburg); Timothy Meade (Lusaka); Eugene Messou (Abidjan); Denis Nash (New York); Winstone Nyandiko Mokaya (Eldoret); Margaret Pascooe (Harare); Larry Pepper (Mbarara); Papa Salif Sow (Dakar); Sam Phiri (Lilongwe); Mauro Schechter (Rio de Janeiro); John Sidle (Eldoret); Eduardo Sprinz (Porto Alegre); Besigin Tonwe-Gold (Abidjan); Siaka Touré (Abidjan); Stefaan Van der Borght
(Amsterdam); Ralf Weigel (Lilongwe); Robin Wood (Cape Town).
Participating centers
Service des Maladies Infectieuses, Casablanca, Maroc; Moi Teaching and Referral Hospital, Eldoret, Kenya; Immune Suppression Syndrome clinic, Mbarara, Uganda; Generic
Antiretroviral Treatment Project, Kampala, Uganda; Centre de Prise en Charge, de Recherche et de Formation sur le VIH/SIDA (CEPREF), Abidjan, Côte d'Ivoire; Initiative sénégalaise d'accès aux antirétroviraux (ISAARV), Dakar, Senegal ; ANRS 1215/1290 Study Group, Dakar, Senegal ; Women's Equity in Access To Treatment (WE-ACTx), Kigali; Independent Surgery, Gaborone, Botswana; Lighthouse Trust Clinic, Lilongwe, Malawi; Gugulethu ART Programme, Gugulethu, South Africa; Perinatal HIV Research Unit (PHRU), Soweto, South Africa ; Khayelitsha ART Programme, Khayelitsha, South Africa; Helen Joseph Hospital Themba Lethu Clinic, Johannesburg, South Africa; CorpMed Medical Centre, Lusaka, Zambia ; Connaught Clinic, Harare, Zimbabwe; Prospective Evaluation in the Use and Monitoring of Antiretrovirals in Argentina (PUMA), Buenos Aires, Argentina; Rio HIV Cohort, Rio de Janeiro, Brazil; South Brazil HIV Cohort (SOBRHIV), Hospital de Clinicas, Porto Alegre, Brazil; YRG Care, Chennai, India; Thai Red Cross AIDS Research Centre, Bangkok, Thailand ; MTCT-Plus Initiative, Mailman School of Public Health, Columbia University, New York, USA ; Heineken ART Programme, Amsterdam, The Netherlands.
Acknowledgements
The ART-LINC Collaboration is funded by the US National Institutes of Health (Office of AIDS Research) and the French Agence Nationale de Recherches sur le Sida et les hépatites virales (ANRS). Special thanks to Jack Whitescarver and Paolo Miotti (NIH/OAR), Carolyn Williams (NIH/NIAID), Michel Kazatchkine, Jean-François Delfraissy,Brigitte Bazin and Séverine Blesson (ANRS) for encouraging and supporting this collaborative work.
16
References
1. Egger M, Hirschel B, Francioli P, Sudre P, Wirz M, Flepp M et al. Impact of new antiretroviral combination therapies in HIV infected patients in Switzerland: prospective multicentre study. Br Med J 1997;315:1194-9.
2. Hogg RS, Yip B, Kully C, Craib KJ, O'Shaughnessy MV, Schechter MT et al. Improved survival among HIV-infected patients after initiation of triple-drug antiretroviral regimens. CMAJ. 1999;160:659-65. 3. Mocroft A, Vella S, Benfield TL, Chiesi A, Miller VT, Gargalianos P et al. Changing patterns of
mortality across Europe in patients infected with HIV-1. Lancet 1998;352:1725-30.
4. World Health Organization. Towards universal access by 2010 : How WHO is working with countries to scale-up HIV prevention, treatment, care and support.
http://www.who.int/hiv/mediacenter/universal_access_progres_report_en.pdf . 2007. WHO, Geneva. Ref Type: Electronic Citation
5. Dabis F, Balestre E, Braitstein P, Miotti P, Brinkhof WGM, Schneider M et al. Antiretroviral Therapy in Lower Income Countries (ART-LINC): International collaboration of treatment cohorts . Int.J Epidemiol 2005;34:979-86.
6. Braitstein P, Brinkhof MW, Dabis F, Schechter M, Boulle A, Miotti P et al. Mortality of HIV-1-infected patients in the first year of antiretroviral therapy: comparison between low-income and high-income countries. Lancet 2006;367:817-24.
7. Fine JP,.Gray RJ. A proportional hazards model for the subdistribution of a competing risk.
J.Am.Stat.Assoc. 1999;94:496-509.
8. Myer L,.el Sadr W. Expanding access to antiretroviral therapy through the public sector--the challenge of retaining patients in long-term primary care. S.Afr.Med J 2004;94:273-4.
9. Chene G, Sterne JA, May M, Costagliola D, Ledergerber B, Phillips AN et al. Prognostic importance of initial response in HIV-1 infected patients starting potent antiretroviral therapy: analysis of prospective studies. Lancet 2003;362:679-86.
10. Carrieri MP, Raffi F, Lewden C, Sobel A, Michelet C, Cailleton V et al. Impact of early versus late adherence to highly active antiretroviral therapy on immuno-virological response: a 3-year follow-up study. Antivir.Ther. 2003;8:585-94.
11. Ferradini L, Jeannin A, Pinoges L, Izopet J, Odhiambo D, Mankhambo L et al. Scaling up of highly active antiretroviral therapy in a rural district of Malawi: an effectiveness assessment. Lancet 2006;367:1335-42. 12. Zachariah R, Teck R, Buhendwa L, Fitzerland M, Labana S, Chinji C et al. Community support is
associated with better antiretroviral treatment outcomes in a resource-limited rural district in Malawi.
Trans.R.Soc.Trop.Med Hyg. 2007; 101:79-84.
13. Lawn SD, Myer L, Harling G, Orrell C, Bekker LG, Wood R. Determinants of mortality and nondeath losses from an antiretroviral treatment service in South Africa: implications for program evaluation. Clin
Infect.Dis. 2006;43:770-6.
14. Stringer JS, Zulu I, Levy J, Stringer EM, Mwango A, Chi BH et al. Rapid scale-up of antiretroviral therapy at primary care sites in Zambia: feasibility and early outcomes. JAMA 2006;296:782-93. 15. Weidle PJ, Malamba S, Mwebaze R, Sozi C, Rukundo G, Downing R et al. Assessment of a pilot
antiretroviral drug therapy programme in Uganda: patients' response, survival, and drug resistance. Lancet 2002;360:34-40.
16. Severe P, Leger P, Charles M, Noel F, Bonhomme G, Bois G et al. Antiretroviral therapy in a thousand patients with AIDS in Haiti. N.Engl.J Med 2005;353:2325-34.
17. Calmy A, Pinoges L, Szumilin E, Zachariah R, Ford N, Ferradini L. Generic fixed-dose combination antiretroviral treatment in resource-poor settings: multicentric observational cohort. AIDS 2006;20:1163-9.
18. Landman R, Schiemann R, Thiam S, Vray M, Canestri A, Mboup S et al. Once-a-day highly active antiretroviral therapy in treatment-naive HIV-1-infected adults in Senegal. AIDS 2003;17:1017-22. 19. Laurent C, Diakhate N, Gueye NF, Toure MA, Sow PS, Faye MA et al. The Senegalese government's
highly active antiretroviral therapy initiative: an 18-month follow-up study. AIDS 2002;16:1363-70. 20. Danel C, Moh R, Anzian A, Abo Y, Chenal H, Guehi C et al. Tolerance and acceptability of an
efavirenz-based regimen in 740 adults (predominantly women) in West Africa. J.Acquir.Immune.Defic.Syndr. 2006;42:29-35.
21. Orrell C, Bangsberg DR, Badri M, Wood R. Adherence is not a barrier to successful antiretroviral therapy in South Africa. AIDS 2003;17:1369-75.
22. Hochgesang, M., Kuyenda, A., Hosseinipour, M., Phiri, S., Weigel, R., Mhango, E., Nkhawazi, B., and Boxshall, M. Active tracing of ART patients lost to follow-up at Lighthouse shows that few stopped treatment for their own reasons, but many have died. XVI International AIDS Conference, Toronto, August 13-18, 2006 Abstract TUPE0119. 2006.
Ref Type: Abstract
23. Yu JK, Chen SC, Wang KY, Chang CS, Makombe SD, Schouten EJ et al. True outcomes for patients on antiretroviral therapy who are "lost to follow-up" in Malawi. Bull World Health Organ 2007;85:550-4. 24. Krebs, D., Chi, B., Mulenga, Y., Cantrell, R., and Levy, J. A community-based contact tracing program
for patients enrolled in a district-wide program for antiretroviral therapy (ART). XVI International AIDS Conference, Toronto, August 13-18, 2006 Abstract TUPE0143. 2007.
Ref Type: Abstract
25. Ivers LC, Kendrick D, Doucette K. Efficacy of antiretroviral therapy programs in resource-poor settings: a meta-analysis of the published literature. Clin Infect.Dis. 2005;41:217-24.
26. Wools-Kaloustian K, Kimaiyo S, Diero L, Siika A, Sidle J, Yiannoutsos CT et al. Viability and effectiveness of large-scale HIV treatment initiatives in sub-Saharan Africa: experience from western Kenya. AIDS 2006;20:41-8.
18 Table 1: Number of patients and main baseline and follow-up characteristics by program, ART-LINC Collaboration of IeDEA.
Number of Status at 6 months after start of ART
patients starting ART (<2001; <2003) No follow-up Initially followed-up, then lost Known to have died Region and name of
program Country Number of eligible patients Median CD4 count (cells/µl) Free access to treatment Tracing of patients lost to follow-up n (%) n (%) n (%) North Africa
Morocco ART Cohort Morocco 423 (127; 270) 412 108 Yes Phone / letter 0 (0%) 47 (11%) 15 (3.6%)
Southern Africa
Gaborone Independent Botswana 288 (228; 279) 213 185 No Phone / letter 1 (0.5%) 10 (4.7%) 2 (0.9%) Lighthouse Malawi 1520 (0; 732) 1219 56 No None 109 (8.9%) 441 (36%) 36 (3.0%) CTAC South Africa 313 (275; 307) 305 241 Yes Home visits 0 (0%) 10 (3.3%) 1 (0.3%) Khayelitsha South Africa 287 (0; 287) 273 45 Yes Home visits 0 (0%) 0 (0%) 34 (13%) OPERA South Africa 63 (1; 54) 46 87 Yes Phone / letter 0 (0%) 0 (0%) 0 (0%)
East Africa
Eldoret Kenya 1138 (0; 223) 839 94 Yes Home visits 33 (3.9%) 142 (17%) 6 (0.7%)
Central & West Africa
Cotrame ANRS 1203 Côte d’Ivoire 137 (43; 128) 123 133 Yes Home visits 0 (0%) 0 (0%) 8 (6.5%) Nigeria HAART Nigeria 115 (2; 36) 44 213 No Phone / letter 0 (0%) 0 (0%) 3 (6.8%) ISAARV Senegal 153 (140; 153) 148 125 Yes Home visits 0 (0%) 6 (4.1%) 6 (4.1%) HIMS Various 104 (0; 61) 59 142 Yes Phone / letter 2 (3.4%) 2 3.4%) 0 (0%)
South America
Rio de Janeiro HIV Brazil 789 (378; 654) 541 166 Yes None 0 (0%) 28 (5.2%) 2 (0.4%) SobrHIV Brazil 854 (640; 800) 516 161 Yes None 3 (0.6%) 25 (4.8%) 1 (0.2%)
Asia
YRG Care India 1367 (84; 744) 717 83 No None 63 (8.8%) 169 (24%) 27 (3.8%) HIV NAT Thailand 100 (76; 85) 36 121 Yes Phone / letter 0 (0%) 0 (0%) 0 (0%)
Total 7651 (1994; 4813) 5491 211 (3.8%) 880 (16%) 141 (2.6%)
Row percentages are given ART, antiretroviral therapy
* Phone / letter or home visit for tracing patients lost to follow-up
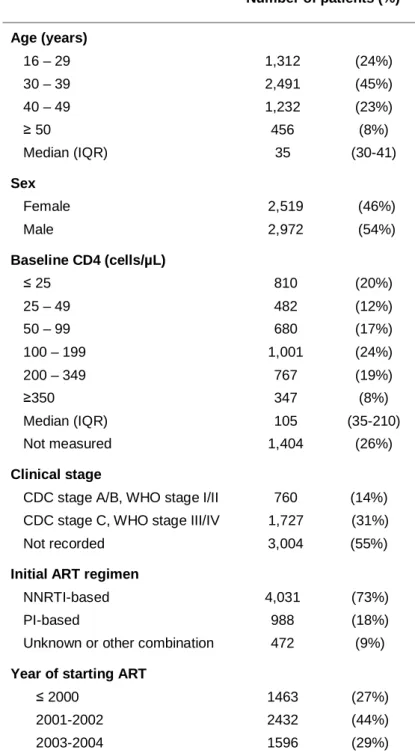
Table 2: Baseline characteristics of 5491 patients starting antiretroviral treatment in the ART-LINC Collaboration of IeDEA.
Number of patients (%)* Age (years) 16 – 29 1,312 (24%) 30 – 39 2,491 (45%) 40 – 49 1,232 (23%) ≥ 50 456 (8%) Median (IQR) 35 (30-41) Sex Female 2,519 (46%) Male 2,972 (54%) Baseline CD4 (cells/µL) ≤ 25 810 (20%) 25 – 49 482 (12%) 50 – 99 680 (17%) 100 – 199 1,001 (24%) 200 – 349 767 (19%) ≥350 347 (8%) Median (IQR) 105 (35-210) Not measured 1,404 (26%) Clinical stage
CDC stage A/B, WHO stage I/II 760 (14%) CDC stage C, WHO stage III/IV 1,727 (31%) Not recorded 3,004 (55%)
Initial ART regimen
NNRTI-based 4,031 (73%)
PI-based 988 (18%)
Unknown or other combination 472 (9%)
Year of starting ART
≤ 2000 1463 (27%)
2001-2002 2432 (44%)
2003-2004 1596 (29%)
IQR: inter-quartile range; ART: highly active antiretroviral therapy; NNRTI: non-nucleoside reverse transcriptase inhibitor; CDC: Centers for Disease Control and Prevention; WHO, World Health Organization; PI: protease inhibitor.
* unless otherwise indicated
20 Table 3: Individual-level factors and probability of loss to program in the first 6 months of ART: ART-LINC Collaboration of IeDEA.
No follow-up Initially followed-up, then lost Death
Odds ratio (95% CI)
P-value* Hazard ratio (95% CI)
P-value* Hazard ratio (95% CI) P-value* Age (years) < 0.0001 0.0040 0.061 16-29 0.83 (0.61-1.14) 1.38 (1.05-1.83) 0.84 (0.38-1.83) 30-39 0.72 (0.56-0.94) 1.05 (0.82-1.36) 1.36 (0.67-2.78) 40-49 0.73 (0.64-0.83) 1.28 (0.98-1.66) 0.84 (0.38-1.84) ≥50 1 1 1 Sex 0.25 0.93 0.31 Male 1 1 1 Female 0.76 (0.49-1.20) 0.99 (0.86-1.15) 0.83 (0.58-1.18) Time period 0.055 < 0.0001 0.35 ≤2000 1 1 1 2001-2002 4.54 (1.28-16.1) 2.70 (1.64-4.46) 1.38 (0.69-2.78) 2003-2004 5.06 (1.28-20.0) 7.62 (4.55-12.8) 1.02 (0.44-2.36)
Initial ART regimen 0.31 0.35 0.58
Two NRTIs + one NNRTI 1 1 1
Two NRTIs + one PI 0.30 (0.06-1.45) 0.79 (0.50-1.23) 1.38 (0.63-3.02) Other or unknown 1.24 (0.44-3.44) 1.21 (0.77-1.92) 1.75 (0.40-7.72)
Baseline CD4 (cells/µl) & < 0.0001 < 0.001 < 0.0001
≥50 1 1 1 25 – 50 2.76 (1.69-4.51) 1.03 (0.81-1.32) 1.52 (0.79-2.93) <25 2.49 (1.43-4.33) 1.48 (1.23-1.77) 3.34 (2.10-5.30) Not measured 2.88 (1.43-5.77) 1.16 (0.96-1.40) 1.81 (0.97-3.40) Clinical stage # 0.26 0.83 0.036 Less advanced 1 1 1 More advanced 0.85 (0.43-1.69) 0.96 (0.69-1.35) 5.35 (1.50-19.1) Not assessed 3.73 (0.77-18.1) 1.07 (0.76-1.51) 4.36 (0.93-20.5)
Odds ratios from multivariable random-effects logistic regression; hazard ratios from multivariable Weibull proportional hazards models incorporating the competing risks of death and loss to follow-up. Estimates were adjusted for all variables listed in the Table.
CI: confidence interval
* Wald test & Not measured in 1404 patients # Not assessed in 3004 patients
ART: highly active antiretroviral therapy; NNRTI: non-nucleoside reverse transcriptase inhibitor; NRTI: nucleoside reverse transcriptase inhibitor; PI: protease inhibitor.
22 Table 4: Program-level factors and probability of no follow-up, loss to program and death in the first 6 months of ART: ART-LINC Collaboration of IeDEA.
No follow-up Initially followed-up, then lost Death
Odds ratio (95% CI)
P-value* Hazard ratio (95% CI)
P-value* Hazard ratio (95% CI)
P-value*
Access to treatment 0.055 0.46 0.031
Free of charge 1 1 1
Fee for service 3.71 (0.97-16.05) 1.69 (0.42-6.77) 4.64 (1.11-19.41)
Follow-up 0.58 0.21 0.035
Passive 1 1 1
Active 0.66 (0.15-2.92) 0.41 (0.10-1.66) 5.15 (1.16-22.79)
Odds ratios from multivariable random-effects logistic regression; hazard ratios from multivariable Weibull proportional hazards models incorporating the competing risks of death and loss to follow-up. Models were adjusted for the variables listed in the table and age, sex, time period, initial ART regimen, baseline CD4 count and clinical stage.
Figure 1: Loss to follow-up in relation to programme size and system of follow-up. The number of patients in programme includes all patients starting antiretroviral treatment over the study period.
Total number of patients in programme 0 200 400 600 800 1000 1200 1400 1600 Pe rc en t pati e nts l o s t t o fol lo w -u p 0% 10% 20% 30% 40% 50% Active follow-up Passive follow up
24 ADDITIONAL TABLES (available on request)
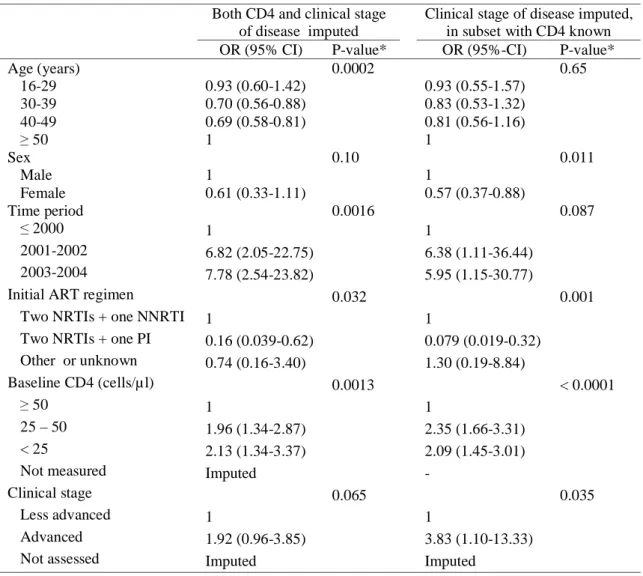
Table A: Odds ratios of no follow-up following multiple imputations (n=20) of both missing baseline CD4 and baseline clinical stage of disease (n=5491; middle columns), or multiple imputations of missing clinical stage of disease only in a subset with CD4 cell count known (n=4087; right columns).
Both CD4 and clinical stage of disease imputed
Clinical stage of disease imputed, in subset with CD4 known
OR (95% CI) P-value* OR (95%-CI) P-value*
Age (years) 0.0002 0.65 16-29 0.93 (0.60-1.42) 0.93 (0.55-1.57) 30-39 0.70 (0.56-0.88) 0.83 (0.53-1.32) 40-49 0.69 (0.58-0.81) 0.81 (0.56-1.16) ≥ 50 1 1 Sex 0.10 0.011 Male 1 1 Female 0.61 (0.33-1.11) 0.57 (0.37-0.88) Time period 0.0016 0.087 ≤ 2000 1 1 2001-2002 6.82 (2.05-22.75) 6.38 (1.11-36.44) 2003-2004 7.78 (2.54-23.82) 5.95 (1.15-30.77)
Initial ART regimen 0.032 0.001
Two NRTIs + one NNRTI 1 1
Two NRTIs + one PI 0.16 (0.039-0.62) 0.079 (0.019-0.32)
Other or unknown 0.74 (0.16-3.40) 1.30 (0.19-8.84)
Baseline CD4 (cells/µ l) 0.0013 < 0.0001
≥ 50 1 1
25 – 50 1.96 (1.34-2.87) 2.35 (1.66-3.31)
< 25 2.13 (1.34-3.37) 2.09 (1.45-3.01)
Not measured Imputed -
Clinical stage 0.065 0.035
Less advanced 1 1
Advanced 1.92 (0.96-3.85) 3.83 (1.10-13.33)
Not assessed Imputed Imputed
Odds ratios from multivariable random-effects logistic regression. Models were adjusted for all variables listed in the table.
CI: confidence interval * Wald test
ART: highly active antiretroviral therapy; NNRTI: non-nucleoside reverse transcriptase inhibitor; NRTI: nucleoside reverse transcriptase inhibitor; PI: protease inhibitor.
Table B: Hazard ratios of lost to follow-up and progression to death in the first six months following start of ART with multiple imputations (n=20) of missing baseline CD4 and missing baseline clinical stage of disease (n=5280 patients).
Lost to follow-up Death
HR (95% CI) P-value* HR (95% CI) P-value*
Age (years) 0.0036 0.071 16-29 1.39 (1.05-1.83) 0.86 (0.39-1.89) 30-39 1.05 (0.81-1.35) 1.37 (0.67-2.79) 40-49 1.27 (0.97-1.65) 0.84 (0.38-1.83) ≥ 50 1 1 Sex 0.91 0.36 Male 1 1 Female 1.01 (0.87-1.16) 0.85 (0.59-1.21) Time period < 0.0001 0.38 ≤ 2000 1 1 2001-2002 2.65 (1.61-4.37) 1.37 (0.68-2.77) 2003-2004 7.51 (4.49-12.58) 1.03 (0.45-2.35)
Initial ART regimen 0.31 0.63
Two NRTIs + one NNRTI 1 1
Two NRTIs + one PI 0.76 (0.49-1.19) 1.35 (0.62-2.93)
Other or unknown 1.19 (0.75-1.87) 1.64 (0.38-7.04)
Baseline CD4 (cells/µ l) & < 0.0001 < 0.0001
≥ 50 1 1
25 – 50 1.12 (0.89-1.40) 1.54 (0.82-2.92)
< 25 1.52 (1.28-1.82) 3.32 (2.12-5.19)
Not measured Imputed Imputed
Clinical stage # 0.39 0.016
Less advanced 1 1
Advanced 1.16 (0.82-1.63) 5.28 (1.37-20.41)
Not assessed Imputed Imputed
Odds ratios from multivariable random-effects logistic regression; hazard ratios from multivariable Weibull proportional hazards models incorporating the competing risks of death and loss to follow-up. Models were adjusted for all variables listed in the table.
CI: confidence interval
* Wald test & Not measured in 1299 patients # Not assessed in 2813 patients
ART: highly active antiretroviral therapy; NNRTI: non-nucleoside reverse transcriptase inhibitor; NRTI: nucleoside reverse transcriptase inhibitor; PI: protease inhibitor.
26 Table C: Hazard ratios of lost to follow-up and progression to death in the first six months following start of ART after imputation of missing clinical stage of disease in a subset of the data with baseline CD4 known (n=3981 patients).
Lost to follow-up Death
Adjusted HR (95% CI) P-value* Adjusted HR (95% CI) P-value* Age (years) 0.0025 0.091 16-29 0.97 (0.75-1.26) 1.10 (0.45-2.71) 30-39 0.70 (0.56-0.88) 1.43 (0.63-3.26) 40-49 0.86 (0.68-1.09) 0.68 (0.27-1.73) ≥ 50 1 1 Sex 0.24 0.27 Male 1 1 Female 0.91 (0.77-1.07) 0.79 (0.53-1.20) Time period < 0.0001 0.067 ≤ 2000 1 1 2001-2002 1.17 (0.81-1.68) 1.57 (0.68-3.60) 2003-2004 3.90 (2.59-5.88) 0.78 (0.29-2.13)
Initial ART regimen 0.060 0.79
Two NRTIs + one NNRTI 1 1
Two NRTIs + one PI 0.58 (0.37-0.92) 1.28 (0.54-3.02)
Other or unknown 1.05 (0.61-1.80) 1.59 (0.21-12.04) Baseline CD4 (cells/µ l) 0.0002 < 0.0001 ≥ 50 1 1 25 – 50 1.02 (0.79-1.32) 1.47 (0.75-2.86) < 25 1.48 (1.22-1.81) 3.16 (1.96-5.08) Not measured - - Clinical stage # 0.13 0.020 Less advanced 1 1 Advanced 0.76 (0.53-1.09) 4.32 (1.26-14.83)
Not assessed Imputed Imputed
Hazard ratios from multivariable Weibull proportional hazards models incorporating the competing risks of death and loss to follow-up. Models were adjusted for all variables listed in the table. CI: confidence interval
* Wald test # Not assessed in 1782 patients
ART: highly active antiretroviral therapy; NNRTI: non-nucleoside reverse transcriptase inhibitor; NRTI: nucleoside reverse transcriptase inhibitor; PI: protease inhibitor.