HAL Id: hal-01887907
https://hal.uca.fr/hal-01887907
Submitted on 4 Oct 2018
HAL is a multi-disciplinary open access
archive for the deposit and dissemination of
sci-entific research documents, whether they are
pub-lished or not. The documents may come from
teaching and research institutions in France or
abroad, or from public or private research centers.
L’archive ouverte pluridisciplinaire HAL, est
destinée au dépôt et à la diffusion de documents
scientifiques de niveau recherche, publiés ou non,
émanant des établissements d’enseignement et de
recherche français ou étrangers, des laboratoires
publics ou privés.
Microscopic observation on compacted sandy soil using
micro-focus X-ray CT Observation microscopique par
micro-tomographie à rayons X de sables compactés
Jun Otani, Toshifumi Mukunoki, Daiki Takano, Bastien Chevalier
To cite this version:
Jun Otani, Toshifumi Mukunoki, Daiki Takano, Bastien Chevalier. Microscopic observation on
com-pacted sandy soil using micro-focus X-ray CT Observation microscopique par micro-tomographie à
rayons X de sables compactés. Proceedings of the 18th International Conference on Soil Mechanics
and Geotechnical Engineering, Sep 2013, Paris, France. �hal-01887907�
Microscopic observation on compacted sandy soil using micro-focus X-ray CT
Observation microscopique par micro-tomographie à rayons X de sables compactés
J. Otani & T. Mukunoki
Kumamoto University, Kumamoto, Japan
D. Takano
Port and Airport Research Institute, Yokosuka, Japan
B. Chevalier
Université Blaise Pascal, Clemont-Ferrand, France
ABSTRACT: It has been suggested based on the technical report of the damages on the recent heavy rains or liquefaction after earthquakes that there are some numbers of local areas where the compaction of soils is not enough and thus, the revision of the current compaction control has been expected. In this paper, the precise behavior or mechanism of soil compaction was discussed using the results of micro-focus X-ray Computed Tomography (CT). A series of model compaction test with sandy soils were conducted and this compacted soil was scanned at different step of compactions. Here, not only visualization of the behavior using CT images but also more quantitative discussion such as the spatial distribution of porosity in the soils were on the discussion after conducting image analysis of the CT images. Finally, it is believed that all those findings are valuable information for reconsidering the way of compaction control for the riverbank.
RÉSUMÉ : Les récents rapports techniques relatifs aux dommages consécutifs aux fortes précipitations ou à la liquéfaction post-séisme suggèrent qu'il existe un certain nombre de zones localisées où le compactage des sols n'a pas été suffisant. Suite à ce constat, une reconsidération des méthodes actuelles de contrôle de compactage est attendue. Dans cet article, les comportements et mécanismes exacts du compactage des sols sont discutés à partir de résultats issus de la micro-tomographie à rayons X. Une série d'échantillons compactés de sols sableux a été réalisée puis scannée à différentes étapes du processus de compactage. Les images résultant de la tomographie ont permis une analyse du processus de compactage à la fois qualitative, portant sur la visualisation des mécanismes, mais aussi quantitative, notamment vis-à-vis des variations du volume des vides dans les différents échantillons. Sur la base des résultats obtenus, une discussion sur l'évolution de la répartition spatiale des vides dans l'échantillon a également été menée. L'ensemble des résultats et observations représente une source d'information précieuse pour reconsidérer les méthodes de contrôle du compactage des digues.
KEYWORDS:Compaction, density, image analysis, sandy soil, X-ray CT.
1 INTRODUCTION
Compaction control for riverbanks is usually done by the density of the soils no matter how difference on the design criteria or soils is. However, it has been suggested based on the technical report of the damages on the recent heavy rains or liquefaction after earthquakes that there are some numbers of local areas where the soil compaction is not enough and thus, the revision of the current compaction control has been expected. Under those circumstances, the goal of this study is to develop a new quantitative compaction control for riverbank. In this paper, the soils after compaction are precisely investigated using micro-focus X-ray Computed Tomography (CT) scanner which is the one of non destructive testing methods with high resolution (Higo et. al. 2011). This investigation makes the micro level of the discussion possible.
2 SUMMARY OF TESTING
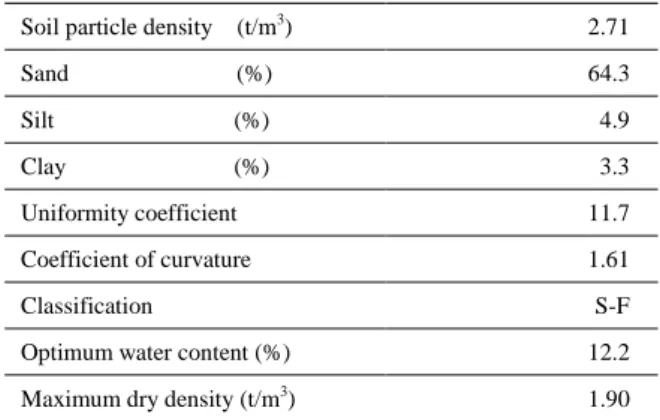
In this test, micro-focus X-ray CT (TOSCANER-32300FPD, Toshiba) at Kumamoto University was used and this apparatus makes the micro level of discussion possible in the soils without any destructions. A series of X-ray CT scanning were conducted on the model ground under the process of compaction to evaluate the change of soil property due to compaction. A sandy soil called “Yamazuna” sand was used in this study and Table 1 shows those of soil properties. As shown in Figure 1, “Yamazuna” sand has a wide range of the size of soil particles, so that it can be suitable for soils in the riverbank. For the
Figure 1. Particle size distribution of “Yamazuna” sand. Table 1. Soil properties of “Yamazuna “sand. 0 20 40 60 80 100 0.001 0.01 0.1 1 10 Diameter (mm) P er ce n t fi n er b y w ei g h t (% )
Soil particle density (t/m3) 2.71 Sand (%) 64.3 Silt (%) 4.9 Clay (%) 3.3 Uniformity coefficient 11.7 Coefficient of curvature 1.61 Classification S-F
Optimum water content (%) 12.2 Maximum dry density (t/m3) 1.90
compaction properties, a series of compaction test were conducted and maximum dry density of 1.90 t/m3 and the
optimum water content of 12.3 % were obtained.
First of all, the sand was prepared in the acrylic mould (height: 100mm, diameter: 50mm) with the conditions of the optimum water contents and dry density of 1.50 t/m3. Dynamic
compaction method was used with controlling its compaction energy and here, as shown in Table 2, two different cases were examined, which are Case-1 and Case-2. Case-1 is the case of relatively high energy in which the height of each time of falling rammer is 0.20 m while Case-2 is the one for low energy which is 0.10m for the falling weight. The weight of falling rammer was 9.81 N. Figure 2 shows those two cases in which the level of compaction is also shown in this figure. As shown in this figure, the amount of work was set as equal for both cases in each level of compaction although the degree of the compaction was slightly different between two cases. Table 3 shows the conditions of CT scanning and Figure 2 shows the scanning area of the specimen, which was the area from 15 mm high and up to 55mm from the bottom of the specimen and the width of scanning area was 40mm. The precise contents of X-ray CT can be found in the references (Otani, 2003, and Watanabe et. al., 2012).
3 IMAGE ANALYSIS
The characteristic of compacted soils was discussed with the results of CT scanning and those are not only direct result from image visualization but also more quantitative ones such as distribution of the voids in the soil using image data. In order to obtain quantitative results, image analysis plays an important role and especially, the determination of the threshold value between two materials such as soil particles and voids is most important for this quantification. Figure 3 shows the frequency of so called “CT-value” in the whole specimen for Case-1. This “CT-value” has been known as the well correlated value with material density (Otani et. al., 2000). As shown in this figure, there are two dominant CT-values in the specimen and due to the level of compaction, those peaks are gradually changed. X-ray CT has a spatial resolution and in this case, this resolution was 75m. The sand used in this test has a fine fraction (less than 5 m) of 8.2% and as a result, there is no way to distinguish all the sizes of the particles. However, it can be said from Figure 3 that the higher peak moves to the higher frequency and the lower peak moves to the lower frequency after the compaction. This means that the increase of the CT-value due to compaction is the cause of the fact that the small particles move to the voids and then those areas are shown as the areas of higher CT-values. In the mean time, the area of low density is decreased due to the decrease of the voids.
In order to discuss more quantitative sense, the threshold value of two peaks shown in Figure 3 was determined. Here, EM algorithm (Dempster et. al., 1977) which is one of the maximum likelihood methods was used and this method is
Figure 2. Area of CT scanning.
Table 2. Test cases and degree of compaction.
Scan area 15 40 100 図-2 CT撮影領域 (mm) Compaction Energy (kJ/m3) Case-1 No. of Compaction Case-1 Deg. of Compaction (%) Case-2 No. of Compaction Case-2 Deg. of Compaction (%) Initital 0 0 79.4 0 78.3 LevelA 15 1 83.3 2 81.3 LevelB 75 5 88.2 10 84.7 LevelC 150 10 91.5 20 87.1 LevelD 374 25 97.5 50 90.6 LevelE 749 50 102.0 100 93.8 LevelF 1497 100 106.0 200 96.5 LevelG 2995 200 109.3 400 98.5
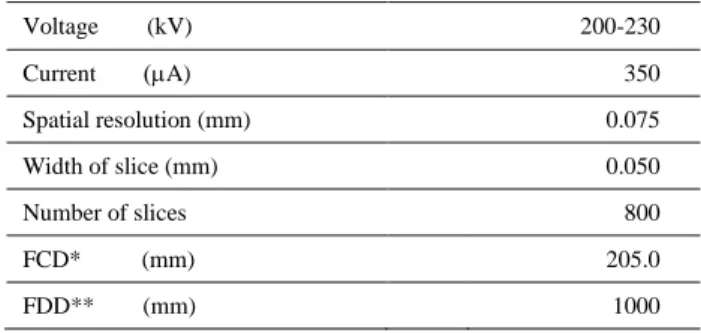
Table 3. Condition of CT scanning. Figure 3. Frequency of CT-value for Case-1.
Figure 4. Relationship between porosity and compaction energy. 500 1000 1500 2000 2500 3000 5 10 15 20 25 30 0 Compaction energy (kJ/m 3 ) P o ro si ty (%) Case-1 measure Case-1 analysis Case-2 measure Case-2 analysis 0 50 100 150 200 250 0 2 4 6 8 CT-value Case-1 initial Level A Level B Level C Level D Level E Level F Level G (×106) F re q u en cy Voltage (kV) 200-230 Current A) 350 Spatial resolution (mm) 0.075 Width of slice (mm) 0.050 Number of slices 800 FCD* (mm) 205.0 FDD** (mm) 1000 *: distance from X-ray tube to the specimen **: distance from the specimen to the detector
useful for the case of multiple peaks of the frequency curve. Here, the calculation with its iteration process has to be conducted in order to obtain the optimum threshold value.
4 RESULTS AND DISCUSSION
4.1 CT images
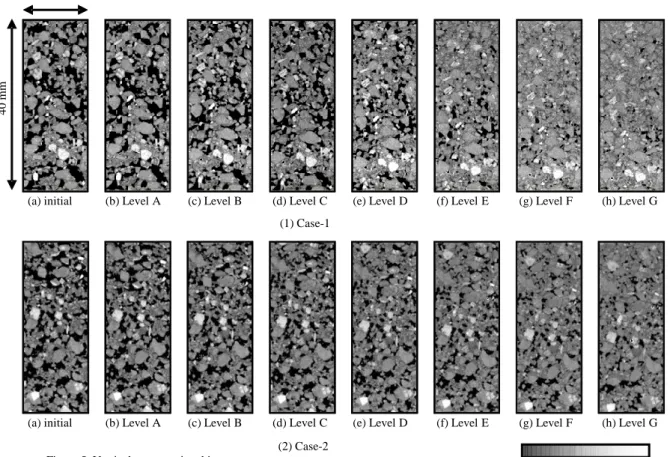
First of all, the obtained threshold value was checked with the measurement of the volume of the voids in the soil. Figure 4 shows the changes of the porosity due to the increase of compaction energy for both cases and the results of the analysis using the obtained threshold values were compared with the measurement results. As easily realized from this figure, both results are fairly close and thus, it can be said that the obtained threshold value can be effective for this study. And it is also concluded that the porosity decreases with the increase of the compaction energy. Figure 5 shows the vertical cross-sectional CT images for both cases from initial to the end of compaction level (Level G). In the CT images, the color of black indicates the area of low density while that of white shows the area of high density with total of 256 levels. It is obvious that the area of the voids decreases with increase of compaction energy for both cases. And the movement of each soil particle is integrated around the top of the specimen for both cases. Looking at the degree of compaction shown in Table 2, the Level D shows already more than 90% of compaction but there are still some areas of black color. Thus, it is concluded that average value of compaction degree, 90% has still many voids in the compacted soil.
4.2 Spatial distribution of air voids
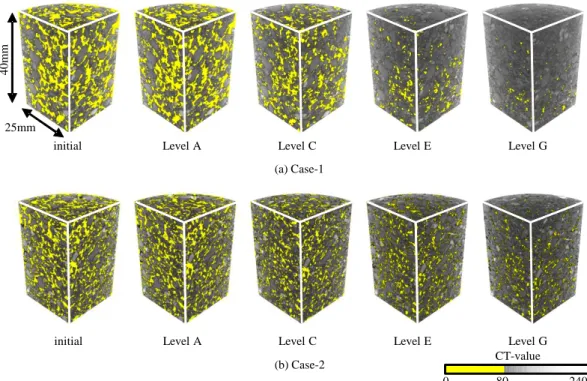
Figure 6 shows the spatial distribution of air voids in the soil in three dimensions using the results of CT scanning. The areas of
light color show those of the voids. As easily realized from those images, the more the compaction energy is the more the porosity decreases. And when Case-1 and Case-2 are compared, it is obviously said that the porosity for Case-2 is more than that of Case-1. Especially, it is realized that the distribution of porosity in the soil is somehow different between two cases. Figure 7 shows the distribution of porosity in the soil for both cases, in which the porosity of every 5mm depth was plotted with the average values as dotted lines. As realized from those figures, it is concluded that the compaction for Case-1 which is higher energy for one cycle of compaction is more effective than that of Case-2 and especially, for Case-2, it can be realized that there are not enough compaction areas around the bottom of the soils. This means that the way of compaction changes the effectiveness of the compaction.
5 CONCLUSIONS
The main purpose of this study was to develop a new method of compaction control for riverbank. Here in this paper, micro level of the mechanism on compacted sandy soil was discussed using micro-focus X-ray CT. The conclusions drawn from this discussion are summarized as follows:
(1) Based on three dimensional visualization of the compacted soil using micro-focus X-ray CT, it has been found that the soils with 90% of average compaction degree still have some degree of the voids left; and
(2) According to the results of comparison on different compaction energy, the case of higher energy for one cycle has better compaction capacity and this was proved by the spatial distribution of the porosity in the soil.
Finally, although those findings were rather fundamental, more quantitative discussion will be continued using special image analysis such as Digital Image Correlation (DIC) method.
Figure 5. Vertical cross sectional images.
(1) Case-1 (a) initial (b) Level A
15 mm CT-value Low High 4 0 mm
(c) Level B (d) Level C (e) Level D (f) Level E (g) Level F (h) Level G
(a) initial (b) Level A (c) Level B (d) Level C (e) Level D (f) Level E (g) Level F (h) Level G (2) Case-2
6 REFERENCES
Dempster, A.P., Laird, N.M. and Rubin, D.B. 1977. Maximum likelihood from incomplete data via the EM algorithm. Journal of the Royal Statistical Society, Series B: Methodological, 39, 1-38. Higo, Y., Oka, F., Kimoto, S., Sanagawa, T. and Matsushima, Y. 2011.
Study of strain localization and microstructural changes in partially saturated sand during triaxial tests using microfocus X-ray CT, Soils and Foundations, 51(1), 95-111.
Otani, J., Mukunoki, M. and Obara, Y. 2000. Application of X-ray CT method for characterization of failure in soils, Soils and Foundations, 40(2) 111-118.
Otani, J. 2003. State of the art report on geotechnical X-ray CT research at Kumamoto University, Keynote Lecture, X-ray CT for Geomaterials, Balkema, 43-77.
Watanabe, Y., Lenoir, N., Otani, J. and Nakai, T. 2012. Displacement in sand under triaxial compression by tracking soil particles on X-ray CT data, Soils and Foundations, 52(2), 312-320.
Figure 6. Spatial distribution of porosity in the soil.
Figure 7. Distribution of porosity in the soil.
0 80 240
CT-value initial Level A Level C Level E Level G
4 0 mm 25mm (a) Case-1 (b) Case-2
initial Level A Level C Level E Level G
0 5 10 15 20 25 30 35 20 30 40 50 Porosity (%) D ist an ce f ro m t h e b o tt o m (mm) initial Level A Level B Level C Level D Level E Level F Level G
(a) 5mm each (b) Average initial Level A Level B Level C Level D Level E Level F Level G Air contents 0 5 10 15 20 25 30 35 20 30 40 50 Porosity (%) D ist an ce f ro m t h e b o tt o m (mm) initial Level A Level B Level C Level D Level E Level F Level G
(a) 5mm each (b) Average initial Level A Level B Level C Level D Level E Level F Level G Air contents (a) Case-1 (b) Case-2