HAL Id: inserm-00077887
https://www.hal.inserm.fr/inserm-00077887
Submitted on 1 Jun 2006
HAL is a multi-disciplinary open access archive for the deposit and dissemination of sci-entific research documents, whether they are pub-lished or not. The documents may come from teaching and research institutions in France or abroad, or from public or private research centers.
L’archive ouverte pluridisciplinaire HAL, est destinée au dépôt et à la diffusion de documents scientifiques de niveau recherche, publiés ou non, émanant des établissements d’enseignement et de recherche français ou étrangers, des laboratoires publics ou privés.
human auditory cortex.
Julien Besle, Alexandra Fort, Claude Delpuech, Marie-Hélène Giard
To cite this version:
Julien Besle, Alexandra Fort, Claude Delpuech, Marie-Hélène Giard. Bimodal speech: early suppres-sive visual effects in human auditory cortex.. European Journal of Neuroscience, Wiley, 2004, 20 (8), pp.2225-34. �10.1111/j.1460-9568.2004.03670.x�. �inserm-00077887�
Bimodal Speech: Early Suppressive Visual Effects in the Human
Auditory Cortex
Julien BESLE, Alexandra FORT, Claude DELPUECH and Marie-Hélène GIARD
INSERM U280, Mental Processes and Brain Activation 151 Cours Albert Thomas, 69003 Lyon, France
Running Title: Audiovisual interactions during speech perception Keywords: electrophysiology, audiovisual, speech perception, multisensory integration
Correspondence to: Marie-Hélène Giard
INSERM U280
151 Cours Albert Thomas
69424 Lyon cedex 03
France Tel: +33 472 68 19 06
Fax: +33 472 68 19 02 E-mail: [email protected]
'This is a preprint of an Article accepted for publication in the European Journal of Neuroscience © 2004 Federation of European Neuroscience Societies’
Abstract
While everyone has experienced that vision of lip movements may improve speech perception, little is known about the neural mechanisms by which audiovisual speech information is combined. Event-related potentials (ERPs) were recorded while subjects performed an auditory recognition task among four different natural syllables randomly presented in the auditory (A), visual (V) or congruent bimodal (AV) condition. We found that (1) bimodal syllables were identified more rapidly than auditory-alone stimuli; (2) this behavioural facilitation was associated with crossmodal [AV - (A+V)] ERP effects around 120-190 ms latency, mainly expressed as a decrease of unimodal N1 generator activities in the auditory cortex. This finding provides evidence for suppressive, speech-specific audiovisual integration mechanisms, which are likely to be related to the dominance of the auditory modality for speech perception. Furthermore, the latency of the effect indicates that integration operates at pre-representational stages of stimulus analysis, probably via feedback projections from visual and/or polymodal areas.
Introduction
It is commonly known and agreed that vision may improve the comprehension of a talker in a face-to-face conversation or on the television. In behavioural studies, the influence of visual information on auditory speech perception has been particularly explored in the “McGurk effect” (McGurk & McDonald, 1976), an auditory illusion produced for particular syllables when the lip movements do not match the auditory signal (for example, auditory /ba/ combined with visual /ga/ is perceived as /da/).
Yet, the neural mechanisms by which auditory and visual speech information is combined in normal communication are still poorly understood. Several functional neuroimaging studies have identified possible sites of multisensory convergence and integration for linguistic material with various results. Haemodynamic responses to semantically congruent audiovisual speech stimuli were found to be enhanced in sensory-specific auditory and visual cortices, compared to the responses to unimodal or incongruent bimodal inputs (Calvert et al., 1999). However, when only the brain areas presenting supra-additive response enhancement to congruent bimodal inputs and sub-additive response to incongruent cues were considered as integration sites, only the left superior temporal sulcus (STS) exhibited significant integration effects. In another fMRI experiment, a supra-additive enhancement was found only in the left claustrum/insula while activation of the STS occurred for lip-reading alone (Olson et al., 2002; see also Calvert & Campbell, 2003). Whatever the precise sites of multisensory integration, Calvert (2001) hypothesized that increased activity in sensory-specific cortices would be due to backward projections from polymodal areas such as the STS.
However, this assumption is beyond the reach of haemodynamic imaging techniques because of their poor temporal resolution. In contrast, neuromagnetic (MEG) and event-related
potential (ERP) recordings can provide significant insights into the timing of bimodal speech integration.
In three studies using audio-visual oddball paradigms (Sams et al., 1991; Möttönen et al., 2002; Colin et al., 2002), deviant “McGurk syllables” differing from standard syllables only on the visual dimension were found to elicit a Mismatch Negativity (MMN) around 150-180 ms post-stimulus, an ERP/MEG component generated for its main part in the auditory cortex. Since MMN probably reflects a neuronal mismatch between deviant auditory inputs and a neural representation of the past stimuli in auditory sensory memory (review in Näätänen & Winkler, 1999), one may conclude from these previous studies that visual speech information has been integrated to the auditory input before the MMN process was triggered, that is before about 150 ms. This McGurk paradigm, however, only put an indirect upper bound on the timing of multisensory integration and the question remains open as to when and where in the sensory processing chain, and by which neural mechanisms auditory-visual speech is combined.
One way to investigate these questions is to compare the electrophysiological responses to bimodal sensory inputs with the sum of the responses to unimodal cues presented separately. This approach was used in humans to analyze the mechanisms of audiovisual integration in bimodal object recognition (Giard & Peronnet, 1999) and revealed the existence of multiple interactions within the first 200 ms post-stimulation, expressed both as modulations (increase and decrease) and as new activations in sensory-specific and polymodal brain areas. Subsequent experiments using this additive model have provided evidence for different integrative operations according to the stimulus type, the modalities involved, or the task required (Raij et al., 2000; Foxe et al., 2000; Fort et al., 2002a, b; Molholm et al., 2002).
In the present study we therefore used the same approach to investigate the time-course and neural mechanisms of audiovisual integration in the particular case of speech perception
Material and Methods
Subjects
Sixteen right-handed native speakers of French (mean age: 23.0, 8 females) were paid to participate in the study, for which they gave a written informed consent in accordance with the Code of Ethics of the World Medical Association (Declaration of Helsinki). All subjects were free of neurological disease, had normal hearing and normal or corrected-to-normal vision.
Thirteen other subjects (mean age: 22.4, 4 females) participated in an additional behavioural-only experiment.
Stimuli
ERP study of multisensory integration requires to strictly control the timing of the unimodal input signals, a particularly heavy constraint in the case of natural speech. We therefore proceeded in the following way:
1. A hundred utterances of 4 different audiovisual syllables (/pa/, /pi, /po/ and /py/) were produced by a French female speaker and recorded with a DV camera at a video sampling rate of 25 fps and an audio sampling rate of 44.1 kHz.
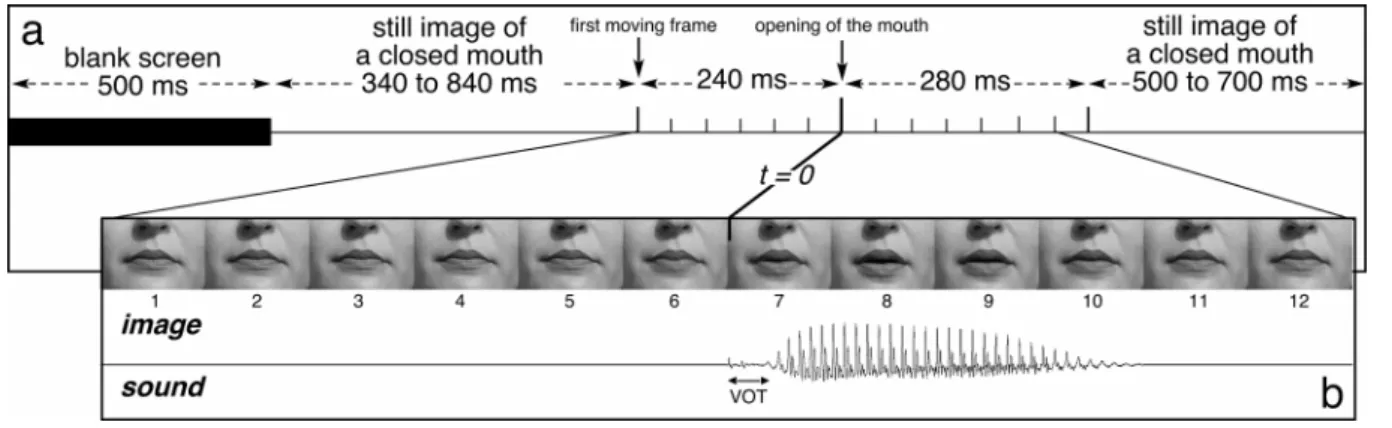
2. Visual inspection of the video stream showed that for most utterances, 6 frames (240 ms) separated the first detectable lip movements from the opening of the mouth (corresponding roughly with the beginning of the speech sound). To have stimuli with similar auditory-visual
structures, we selected a subset of these syllables. The sound onset was then strictly post-synchronised with the onset of the 7th frame. This point in time (240 ms after the beginning of lip movements) was taken as the time zero for ERP averaging and latency measurements (see Figure 1B). The voice onset times (the intervals between the consonant burst and the voicing corresponding to the vowel), originally ranging from 15 to 26 ms, were artificially shortened to 15 ms for all the stimuli.
3. Using a unique exemplar of each syllable (/pa/, /pi/, /po/ or /py/) could have led subjects to learn and recognize the stimuli on the basis of low-level sensory features specific to each stimulus but irrelevant for phonetic processing. We therefore selected three exemplars of each syllable, that is 12 different utterances.
4. Eventually, lip movements preceding the sound emission anticipate the shape that will produce the vowel (co-articulation) and can therefore slightly differ between the different syllables. Although the pre-vowel lip movements were very faint during the first 6 frames of the video stream, we ensured that they could not allow the subjects to make the identity of the syllable out before the sound onset (7th frame): we asked 7 subjects (who did not participate in the main experiment) to visually identify the syllables on the basis of the first 6, 8 or 13 frames. Results showed that subjects did respond at chance level in the 6-frame condition.
All the images of the video stream were cropped in order to keep only the mouth, the cheeks and the bottom of the nose (see Figure 1B). In the final frames, the mouth was about 5 cm wide and was presented on a video monitor placed 130 cm in front of the subjects’ eyes, subtending a visual angle of 2.2°. The duration of the 12 sounds corresponding to the 12 syllables ranged from 141 to 210 ms; their amplitudes were adjusted to have the same perceived intensity (kept constant for all subjects).
Procedure
Subjects were seated in a dark, sound-attenuating room and were given instructions describing the task along with a practice block of 70 trials (a trial is described in figure 1A). Then subjects were presented with 31 repetitions of the 12 syllables in each of the three following conditions: auditory-only (A), visual-only (V) and audiovisual (AV). These 1116 trials were divided into 16 blocks (block duration: about 2 min 35 s, mean ISI: 2210 ms). In all blocks, trials were delivered pseudo-randomly with the constraint that two stimuli of the same condition could not occur in a row.
At the beginning of each block, one of the 4 syllables (/pa/, /pi/, /po/ or /py/) was designated as the target (so that each syllable could be target or non-target depending on the block). The subjects’ task was to press a mouse-button with the right forefinger whenever they heard (A and AV conditions) the target-syllable in the block sequence.
An auditory task alone was chosen because estimation of the crossmodal interactions using the additive [AV - (A+V)] model (see Data Analysis) requires that the attention level in each modality is similar between the unimodal and the bimodal conditions (but not necessarily between the two unimodal conditions). Indeed, since the subjects are instructed to make an auditory discrimination task, the auditory attention effect will be expressed rather similarly in A and AV brain responses and mostly eliminated in [AV - (A+V)]. On the other hand, because lip-reading is unnatural and difficult for untrained, normal-hearing subjects, a task in the three A, V and AV conditions would have led the subjects to naturally engage much more visual attention to process visual than bimodal stimuli. As a consequence, a larger visual attention effect in the V than in AV responses would not have been eliminated in the model. On the contrary, the task used here required a rather similar (if any) visual attention effort to
process the visual and audio-visual stimuli, then minimizing any attentional bias in the additive model.
EEG Recording
EEG was continuously recorded via a Neuroscan Compumedics system through Synamps DC coupled amplifiers (0.1 to 200 Hz analogue bandwidth; sampling rate: 1 kHz) from 36 Ag-AgCl scalp electrodes referenced to the nose and placed according to the International 10-20 System: Fz, Cz, Pz, POz, Iz; Fp1, F3, F7, FT3, FC1, T3, C3, TP3, CP1, T7, P3, P7, PO3, O1, and their counterparts on the right hemiscalp; Ma1 and Ma2 (left and right mastoids, respectively); IMa and IMb (midway between Iz-Ma1 and Iz-Ma2, respectively). Electrode impedances were kept below 5 kΩ. Horizontal eye movements were recorded from the outer canthus of the right eye; eye blinks and vertical eye movements were measured in channels Fp1 and Fp2.
Data Analysis
EEG analysis was undertaken with the ELAN Pack software developed at the INSERM U280 laboratory (Lyon, France). Trials with signal amplitudes exceeding 100 µV at any electrode from 2000 ms before time zero to 500 ms after were automatically rejected to discard the responses contaminated by eye movements or muscular activities. One subject was excluded from analysis for general noise in EEG at most sites. For 7 other subjects, the excessively noisy signals at one or two electrodes were replaced by their values interpolated from the remaining electrodes.
ERPs to non-target stimuli were averaged offline across the 12 different syllables separately for each modality (A, V, AV), over a time period of 1000 ms including 500 ms pre-stimulus (the zero time corresponding to the onset of the sound, or the onset of the 7th video frame for
visual-only trials). Trials including false alarms were not taken into account when averaging. The mean numbers of averaged trials (by subject) were 155, 157 and 170 in the A, V and AV conditions, respectively (about 40% of the trials were discarded due to important eye movements).
ERPs were finally digitally filtered (bandwidth: 1-30 Hz, slope: 24 dB/octave). The mean amplitude over the [-300 to -200 ms] pre-stimulus period was taken as the baseline for all amplitude measurements.
Estimation of Audiovisual Interactions
We assumed that at an early stage of stimulus processing, if auditory (A) and visual (V) dimensions of the stimulus were to be independently processed, the neural activities induced by the audiovisual (AV) stimulus should be equal to the algebraic sum of the responses generated separately by the two unisensory stimuli. Hence, any neural activity departing from the mere summation of unimodal activities should be attributed to the bimodal nature of the stimulation, that is to interactions between the inputs from the two modalities (Barth et al., 1995; Miniussi et al., 1998; Giard & Peronnet, 1999; see discussion in Besle et al., in press). This assumption is valid only if the period of analysis does not include non-specific activities that would be common to all three types of stimuli, and particularly late activities related to semantic processing, response selection or motor processes. ERP litterature shows that these "non-specific" components generally arise after about 200 ms, whereas the earlier latencies are characterized by sensory-specific responses (e.g. Hillyard et al., 1998 for a review). We have therefore restricted the analysis period to [0-200] ms and used the following summative model to estimate the AV interactions:
ERP (AV) = ERP (A) + ERP (V) + ERP (A×V interactions)
This expression is valid whatever the nature, configuration or asynchrony of the underlying neural generators and is based on the law of superposition of electric fields. However, estimation of AV interactions using this procedure further requires that (1) the levels of modality-specific attention are similar between each unimodal condition and the bimodal condition (see Procedure), and (2) the effects potentially found in a particular structure cannot be attributed to deactivation processes in that structure under unimodal stimulation of a concurrent modality (see Discussion).
Significant interaction effects were assessed by Student’s t-tests comparing the amplitudes of the [AV - (A+V)] difference waves to zero for each time sample at each electrode. Student’s t maps could then be displayed at each latency. Correction for multiple comparisons was performed using the Guthrie & Buchwald (1991)’s procedure, which tabulates the minimum number of consecutive time samples that should be significant in ERP differences, in order to have a significant effect over a given time series. Since these tables are given for a horizon of 150 time samples, we under-sampled our data at 500 Hz over the [0 - 200 ms] analysis period, as proposed by the authors. We therefore considered as significant interactions the spatiotemporal patterns having a stable topography with significant amplitude (p < 0.05) during at least 12 consecutive time samples (24 ms), which is an upper bound for 15 subjects over 100 time samples (200 ms).
Topographic Analysis and Dipole Modeling
To facilitate the interpretation of the voltage values recorded at multiple electrodes over the scalp surface, we analyzed the topographic distributions of the potentials and the associated scalp current densities (SCDs). Scalp potential maps were generated using two-dimensional spherical spline interpolation and radial projection from T3 or T4 (left and right lateral views, respectively), which respects the length of the meridian arcs. SCDs were obtained by
computing the second spatial derivative of the spline functions used in interpolation (Perrin et al., 1987; Perrin et al., 1989). SCDs do not depend on any assumption about the brain generators or the properties of deeper media, and they are reference free. In addition, SCDs reduce the spatial smearing of the potential fields due to the volume conduction of the different anatomical structures, and thus enhance the contribution of local intracranial sources (Pernier et al., 1988).
Topographic analysis was complemented by spatio-temporal source modelling (Scherg & Von Cramon, 1985, 1986; Giard et al., 1994) based on a three-concentric sphere head model for conductive volumes (brain, skull and scalp) and equivalent current dipoles (ECDs) for generators (local activity of brain regions). Data were modelled using two stationary dipoles with symmetrical positions (one in each hemisphere). The dipole parameters were determined by a non-linear iterative procedure (Marquardt minimization method) for the spatial parameters (location and orientation) and with a linear least-mean square algorithm for the time-varying magnitude (Scherg, 1990). The model adequacy was assessed by a goodness-of-fit criterion based on the percentage of experimental variance explained by the model. Note that the modelling procedure was not used here to localize the brain generators involved in the auditory response and/or the crossmodal interactions, but rather to test whether the dipole configuration best explaining the [AV - (A+V)] interactions could also explain most of the auditory response.
Results
Behavioural Results
Subjects (N=16) identified the target syllables more rapidly when presented in the audiovisual condition (mean response time: 400 ms) than in the auditory-alone condition (423 ms, F(1,15)= 18.76, p < 0.001). The error rate was inferior to 1% in each of the two conditions.
According to the race models (Raab, 1962), a shorter reaction time (RT) in bimodal condition (known as the redundant-stimulus effect) does not necessarily imply the existence of crossmodal interactions before the response, since the first of the two unimodal processes completed could have determined the reaction time. Miller (1982) has shown that under this last hypothesis, particular assumptions can be made on the distribution of RTs:
P (RTAV< t) ≤ P (RTA < t) + P (RTV < t), for any reaction time t (1)
where P(RT<t) is the cumulative probability density function (CDF) of RT.
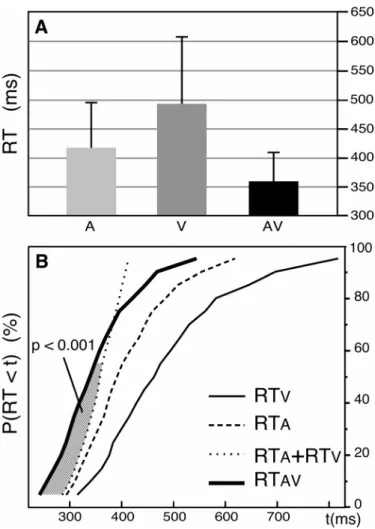
To test this hypothesis on the speech material used in the ERP study, we performed an additional behavioural-only experiment using the same stimuli and paradigm, except that the subjects (N=13) had to respond to the target syllables in the three (A, V, AV) modalities. The mean RTs to identify the auditory, visual and audiovisual stimuli were 418 ms, 496 ms and 356 ms, respectively (Figure 2A). Following the procedure proposed by Ratcliff (1979; see also Miller, 1982), the CDFs of RTs for each subject in each of the three conditions were divided into 19 fractiles (0.05, 0.10, … , 0.90, 0.95) and RTs were group averaged at each fractile, yielding a group distribution (Figure 2B). Comparison of the AV-CDF with the sum of the A- and V-CDFs using Student t-tests reached statistical significance (p<0.001) for the 9 first fractiles (0.05 to 0.45) showing that inequality (1) was violated for shorter RTs.
Electrophysiological Results
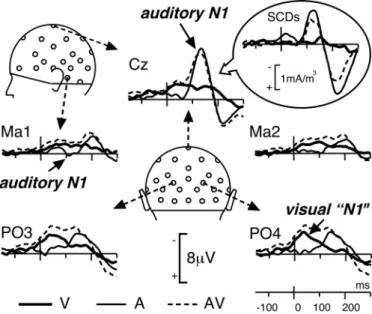
Figure 3present the ERPs elicited by non-target unimodal and bimodal stimuli from 150 ms before time zero (onset of the auditory signal) up to 300 ms after, at a subset of electrodes (and corresponding SCDs at Cz). The unimodal A and V waveforms display morphologies typical of activities in sensory-specific areas: the auditory N1 wave was maximum at 136 ms at fronto-central sites (-8.34 µV at Cz) with a small polarity reversal at mastoid electrodes (Ma1: 0.35 µV at 111 ms; Ma2: 0.01 µV at 108 ms). This spatiotemporal configuration is known to reflect neural activity in the supra-temporal auditory cortex (Vaughan & Ritter, 1970; Scherg & Von Cramon, 1986). Auditory N1 was followed by the P2 wave peaking at 221 ms (3.97 µV at Cz) with polarity reversals at mastoids (Ma1: -2.86 µV at 205 ms and Ma2: -2.25 µV at 207 ms).
The first deflection in visual ERPs peaked around 40 ms at occipito-parietal electrodes (-3.04 µV at PO3 and -3.60 µV at PO4). Although the onset of the visual stimulus began 240 ms before time zero, this wave is likely to correspond to the visual “N1” wave, usually peaking around 180 ms post-stimulus. Indeed typical visual N1 responses are usually obtained with stimuli characterized by steep visual energy changes. In our paradigm, the first lip movements were very faint with small progressive changes every 40 ms (see Figure 1). Therefore the global ERP signal must have also developed progressively, by successive overlaps of small visual responses to each frame delayed by 40, 80, 120 ms…, until reaching a "ceiling" level that appeared about 280 ms after the onset of the first frame. In addition, since we used 12 different visual stimuli (3 exemplars of 4 syllables), the variability of the responses averaged across these stimuli may have reinforced the apparent smoothness of the visual ERP.
A second negative visual component was elicited by lip movements with maximum amplitudes at parieto-central electrodes at about 160 ms (C3: - 2.46 µV at 143ms; C4: -2.16 µV at 179 ms).
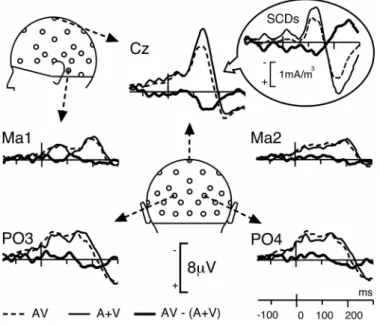
Figure 4 displays the superimposition of the ERPs to non-target bimodal stimuli and the algebraic sum of the responses to unimodal stimuli. Although the morphology of the bimodal response resembles the sum of unimodal ERPs, the differences between the two traces were highly significant over a wide central region within the first 200 ms after time zero. Using the additive criterion [AV - (A+V)] to estimate the interactions, significant patterns were found bilaterally from about 120 to 190 ms at most fronto-central electrodes – that is, in the spatiotemporal range corresponding to the auditory N1 response and the second visual component – (mean amplitude of [AV - (A+V)] over Fz, FC1, FC2, F3, F4, Cz, C3, C4, CP1 and CP2 between 120 and 190 ms: 2.23 µV). The detailed statistical significance of the effect is depicted in Figure 5. The topography of the crossmodal effect remains roughly stable over the whole 120-190 ms time interval and significance reached the 0.001 threshold at several fronto-central electrodes of the left hemiscalp between 125 and 145 ms latency.
As evidenced by Giard & Peronnet (1999), AV interactions can take multiple forms that are not mutually exclusive: (1) new components that are not present in the unimodal responses, (2) modulation of the visual response, (3) modulation of the auditory response. To assess the nature of the interactions, we therefore compared the topography1 of [AV - (A+V)] with those
1 Since ERPs recorded at the scalp surface result from volume conduction activities, it is
fundamental to interpret the data from the global topography of the electrical fields and not from a local analysis at one particular electrode. For example, in Figure 3, the peak amplitudes of the potentials at Cz are similar for A and AV responses, and one could argue
of the unimodal responses at the corresponding latencies, with the following reasoning: if the interaction pattern has the same (or inverse) topography as either unimodal response, it is likely to express a modulation (increase or decrease) of that unimodal response.
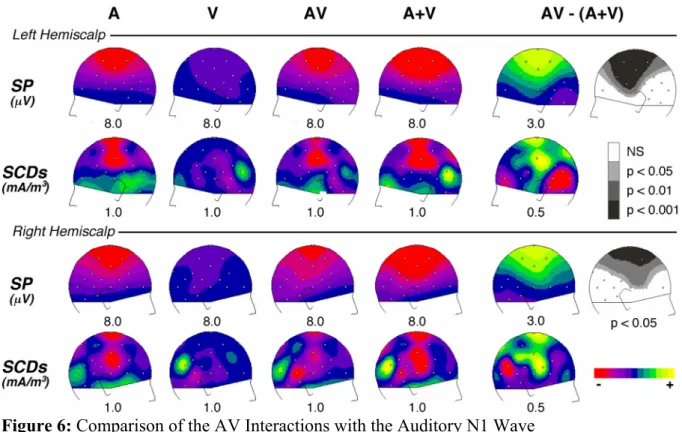
Figure 6 displays the topography of the auditory and visual responses, the bimodal responses, the sum of the unimodal responses and the [AV - (A+V)] pattern at the latency of the auditory N1 peak (136 ms). As can be seen, the distributions of the interaction pattern over the left and right hemiscalps (top and bottom panels, respectively) strongly resemble those of the auditory response, but with opposite polarities. This similarity appears not only in the potential maps (Fig. 6, 1st and 3rd rows), but also in the scalp current density (SCD) distributions (Fig. 6, 2nd and 4th rows). Indeed, on the left hemiscalp, the SCD map of [AV - (A+V)] displays sharp, positive current sources at C3, Cz and Pz and a negative current sink around Ma1-T5 (Fig. 6, row 2, col. 5). A similar current sink/source pattern with opposite signs can be observed in the auditory N1 map (Fig. 6, row 2, col. 1). On the right hemiscalp, the polarity reversals at temporal sites are less clear, but the configurations are again very comparable between the A and [AV - (A+V)] patterns (Fig. 6, row 4, col. 1 and 5).
that an effect in [AV-(A+V)] at that electrode could stem only from the (non null) V signal. However, the corresponding SCD traces (Fig. 3) show a different response pattern at Cz in which (i) A and AV traces clearly differ around their peak latency, and (ii) the V signal is close to zero. As the differences between voltage and SCD signals are mainly due to the reduction of the volume conduction effects from distant generators in SCDs, this example illustrates the difficulty to interpret local (potential or SCD) measures and the necessity to take into account the global topography of the responses.
On the other hand, the latency range of the interaction effects (Fig. 4, Cz) also overlaps that of the second component of the visual response (Fig. 3, PO3/PO4/Cz), suggesting that this component could be modulated by the bimodal inputs. This hypothesis would be supported if the topography of the interactions mirrored that of the unimodal visual response. While the SCD distribution of [AV – (A+V)] could also include part of the topography of the visual reponse around the same latency (particularly over central areas), the overall SCD distributions of the interactions are more complex and differ over occipito-temporal scalp sites.
Finally, we modelled the grand-average [AV - (A+V)] signal in the 110-150 ms period (around the peak of the auditory N1 wave), using two symmetrical (one in each hemisphere) Equivalent Current Dipoles (ECDs). The best fitting ECDs were found at an eccentricity of 0.37 and explained the experimental data with a goodness-of-fit of 95.1%. When applied to the same time interval of the auditory response, these ECDs explained 92.3% of the variance of the data while they explained only 29.3% of the unimodal visual response within the same latency window. (As a comparison, applied to a 40-ms window in the baseline period, the goodness-of-fit was 39.3%).
Hence, although the pattern of audiovisual interactions observed here may include some contributions from central processes activated by visual stimuli alone, it appears to originate for its main part from the same sources as the auditory N1 response, and may therefore reflect a decrease of activity in the N1 generators in the auditory cortex for the bimodal response compared to the unimodal auditory response.
Furthermore, as we have noted, the SCD maps to auditory alone stimuli display two additional currents sinks on parietal (around Pz) and more anterior (Cz) midline, that both resolve in current sources in the [AV - (A+V)] maps. While a precise interpretation of these
current patterns is difficult, the topography of the parietal currents fits with the findings of auditory responses in the posterior intraparietal sulcus (Schroeder et al., in press). On the other hand, the anterior midline currents at Cz could correspond to the "frontal component" of the auditory N1 response described by Giard's group (Giard et al., 1994; Alcaini et al., 1994) The fact that the same patterns are found with opposite polarities in the auditory-alone condition and in [AV - (A+V)] may indicate that more than the supratemporal component of the auditory response has been modulated by bimodal stimulation.
Discussion
Behavioural Facilitation of Bimodal Speech Perception
To date, experimental evidence of behavioural facilitation in bimodal speech perception has been provided almost exclusively on qualitative categorization of phonological continua in situations of sensory conflict (e.g. McGurk illusion: Massaro, 1993) or on detection or intelligibility threshold for degraded unimodal inputs (e.g. speech in noise: Sumby & Pollack, 1954; Grant & Seitz, 2000). Unlike these approaches, our behavioural-only data clearly show that (1) bimodal information facilitates speech processing also in normal conditions of perception (see also Reisberg et al., 1987; Arnold & Hill, 2001), and (2) this facilitation can be expressed in chronometric measures, similarly to the redundant-stimulus effects widely reported in behavioural studies on crossmodal interactions for non-speech stimuli (e.g. Hershenson, 1962; Nickerson, 1973; Giard & Peronnet, 1999; Fort et al., 2002a). RT distributions in the three modalities (A, V, AV) falsified the race models (Raab, 1962), thereby indicating that unimodal speech inputs interacted somehow during stimulus analysis to speed up the response (co-activation model: Miller, 1982, 1986).
Genuine crossmodal interactions in the ERP paradigm?
The differences in tasks and in the observed RTs for bimodal stimuli preclude a direct application of the previous conclusion to the ERP paradigm on the basis of the sole behavioural measures. It may be argued that the RT effects observed in that paradigm could only result from alertness processes as the visual stimulus started before the auditory stimulus. However, although alerting and spatial orienting of attention are two subcomponents of the attentional system that are probably carried out by separate internal mechanisms (Fernandez-Duque & Posner, 1997), it has been shown that the two processes have similar neural effects on the processing of a subsequent incoming stimulus - namely, in the visual modality, an increased activation in extrastriate cortex (Thiel et al., 2004). It is well known in ERP/MEG literature that directing attention to an auditory stimulus results in increased activities in the auditory cortex in a wide latency window including the N1 range (reviews in Näätänen, 1992; Giard et al., 2000). If the auditory processing in the bimodal condition was affected by an alerting process due to the visual signal preceding the acoustic input, the effect would therefore very probably be expressed as a larger auditory N1 amplitude for bimodal than for auditory-alone stimuli. Yet we observed a decrease of the auditory N1 amplitude (see next section), strongly suggesting that the alerting hypothesis can be ruled out as a main explanation for the bimodal facilitation in the ERP experiment.
On the other hand, several functional imaging studies have reported a decrease of activation in sensory-specific cortices in paradigms where subjects were continuously and exclusively exposed to stimuli in a concurrent modality (Kawashima et al., 1995; Lewis et al., 2000; Bense et al., 2001; Laurienti et al., 2002). Such a cortical deactivation would have led to spurious effects in the [AV - (A+V)] model. However, in the present experiment, all auditory, visual and bimodal stimuli were delivered randomly with equal probability, which should considerably reduce this possibility. Furthermore, since attention was mainly focused on the
auditory modality, deactivation processes could have occurred only in the visual cortex (where in fact no [AV - (A+V)] effects were found). Therefore, our significant [AV - (A+V)] effects in temporal areas very probably reflect genuine crossmodal interactions.
Crossmodal Depression in the Auditory Cortex
Both the potential and scalp current density distributions of the crossmodal interactions from about 120 ms to 150 ms after sound onset mimic those of the unimodal auditory N1 wave in the same latency range. This similarity, also evident in the results of spatio-temporal dipole modeling, strongly suggests that audiovisual integration in speech perception operates at least in part by decreasing the N1 generator activities in supratemporal auditory cortex. This interpretation (that does not preclude the involvement of other additional mechanisms) raises several comments.
Firstly, Miki et al. (2004) recently reported no difference in the auditory M100 response (the MEG analogue of the N100 or N1 response) to vowel sounds when they were presented together with the stilled image of a closed mouth or the image of an open mouth pronouncing this vowel. Several reasons may explain these different results: Miki et al. used only one stilled image of a mouth pronouncing /a/ in a passive task while we required an auditory discrimination between 12 (3 exemplars of 4 syllables) ecological moving lip movements. First, the use of a passive task prevents from knowing whether their stimuli induced a behavioral facilitation relative to their control condition. In addition, still images and moving speech stimuli may access partly different cortical networks (Calvert & Campbell, 2003). Given that the crossmodal integrative operations are highly sensitive to both the nature of the task and the sensory “effectiveness” of the unimodal inputs (Fort & Giard 2004), any of the differences in experimental parameters between the two studies might have explained the differences in results.
Secondly, the spatial resolution of scalp ERPs does not allow one to rule out the hypothesis that at least part of the interactions are generated in the STS, which has roughly the same orientation as the supratemporal plane. Suppressive effects have indeed been found in the STS in an MEG study comparing the responses to spoken, written and bimodal letters in a recognition task (Raij et al., 2000). However, these effects took place around 380-540 ms and were related to grapheme/phoneme conversion, and do certainly not reflect the same processes as our early interactions occurring at the latency of the auditory sensory N1 response.
Thirdly, congruent bimodal inputs have generally been found to enhance activation in sensory-specific cortices (estimated either by cerebral blood flow measurements: Calvert et al., 1999; Macaluso et al., 2000; or by electric measurements: Giard & Peronnet, 1999; Foxe et al., 2000; Fort et al., 2002b). Yet, Giard & Peronnet (1999) reported a decrease of the visual N185 wave (155-200 ms) to bimodal relative to unimodal visual stimuli in an object discrimination task. This ERP component generated in extra-striate cortex (Mangun, 1995) has been specifically related to visual discrimination processes (Vogel & Luck, 2000). The reduced N185 response was therefore interpreted as reflecting a lesser energetic demand (neural facilitation) from the visual system to discriminate stimuli made more salient by the addition of an auditory cue (see also Fort & Giard, 2004). Since the auditory N1 wave is known to be related to stimulus feature analysis in the auditory cortex (Näätänen & Picton, 1987; Näätänen & Winkler, 1999), our results may indicate that lip movements have facilitated feature analysis of the syllables in the auditory cortex by a depression mechanism similar to that found in the visual cortex for object processing. This interpretation makes sense if one considers the general advantage of the cognitive system for visual processing (Posner et al., 1976), and the obvious dominance of the auditory modality in the speech domain: crossmodal facilitation would operate, among other neural mechanisms, as suppressive modulation in the more responsive sensory system.
Lastly, a reduced response at the auditory N1 latency appears to be specific to audiovisual speech integration, since this effect differs from those found not only during object recognition (Giard & Peronnet, 1999), but also during the discrimination of verbal material presented in spoken (heard) and written forms (Raij et al., 2000).
Latency of the Crossmodal Effects
In our paradigm, the first auditory information distinguishing between two different vowels appeared 15 ms after time zero (after the voice onset time, see Material and Methods). The onset latency of the crossmodal effects relative to relevant auditory analysis can therefore be estimated at approximately 105 ms. Several studies on multisensory integration using synchronous non-speech stimuli have reported very early crossmodal effects (from 40-50 ms) in sensory-specific cortices (Giard & Peronnet, 1999; Foxe et al., 2000; Fort et al., 2002a; Molholm et al., 2002). In the speech domain, Lebib et al. (2003) recently reported that the processing of congruent and incongruent bimodal inputs generated different ERP effects on the auditory P50 component. Although these and our results may seem hardly compatible with the hypothesis of backprojections from higher-level multisensory areas (Calvert, 2001), one may note that audiovisual speech is special compared to other bimodal objects in that its unimodal inputs are intrinsically asynchronous: coarticulation implies that visual information most often precedes speech sounds, so that visual processing has already started when the sound reaches the auditory system. It is therefore possible that our early effects in the auditory cortex are mediated through visual backprojections from the visual associative system2 or from the STS (found to be activated by articulatory lip movements alone and by biological
2 The visual component peaking bilaterally at occipital sites around 40 ms could well have fed
subsequent crossmodal processes in auditory cortex.
motion in general, review in Calvert & Campbell, 2003). This latter hypothesis fits well with two sets of findings:
At the neural level, while there is growing anatomical and electrophysiological evidence in the primate suggesting that every sensory cortex is likely to receive inputs from each other (from auditory to visual cortex: Falchier et al., 2002; from somatosensory to auditory cortex: Schroeder et al., 2001; Schroeder & Foxe, 2002), no direct pathway from the visual to the auditory cortex has yet been found to our knowledge. However, electrophysiological monkey experiments have shown that the associative auditory cortex receives visual inputs with laminar patterns typical of feedback connections, which suggests that visual information is conveyed in the auditory cortex by backprojections from associative areas (Schroeder & Foxe, 2002). The upper bank of the STS (which receives feedforward auditory and visual information) has been proposed as a candidate for the origin of these visual feedback inputs towards the auditory cortex (see also Pandya et al., 1969; Seltzer & Pandya, 1978).
At a functional level, although we ensured that the subjects could not identify the syllables on the basis of visual information preceding the sound onset, the very first lip movements could have pre-activated phonetic units in the auditory cortex via the STS. Several ERP studies have shown that unimodal (e.g. Holcomb & Neville, 1990) and intersensory (e.g. Holcomb & Anderson, 1993) semantic priming effects can decrease the amplitude of the N400 wave, a component associated with late semantic processes. In the same line, the reduced auditory N1 amplitude observed in the present study might reflect an intersensory priming effect on phonetic units at an earlier stage of sensory analysis. Intersensory phonetic priming may therefore be seen as a genuine integrative mechanism by which auditory feedforward and visual feedback information are combined.
According to Näätänen & Winkler (1999), the auditory N1 component corresponds to a pre-representational stage of stimulus analysis, during which acoustic features are individually analyzed, while the first neural correlate of an integrated auditory trace is the MMN, whose latency onset closely follows that of the N1 wave. Several studies have shown that MMN for speech stimuli is sensitive to phonological (categorical) information (review in Näätänen, 2001). If the MMN is an index of the first phonological trace in the auditory processing chain, then our early crossmodal interactions may reflect online binding of audiovisual information at a pre-representational stage of stimulus analysis, before the phonological (categorical) trace is built. This chronology of events is in agreement both with the observation of MMN to McGurk syllables (Sams et al., 1991; Möttönen et al., 2002; Colin et al., 2002) and with psycholinguistic models of speech perception by ear and eye (Summerfield, 1987; Massaro & Cohen, 2000).
References
M. Alcaini, M. H. Giard, M. Thevenet & J. Pernier (1994) Two separate frontal components in the N1 wave of the human auditory evoked response. Psychophysiology, 31, 611-615.
P. Arnold & F. Hill (2001) Bisensory augmentation: A speechreading advantage when speech is clearly audible and intact. Br. J. Psychol., 92, 339-355.
D. S. Barth, N. Goldberg, B. Brett & S. Di (1995) The spatiotemporal organization of auditory, visual and auditory-visual evoked potentials in rat cortex. Brain. Res., 678, 177-190.
S. Bense, T. Stephan, T. A. Yousry, T. Brandt & M. Dieterich (2001) Multisensory cortical signal increases and decreases during vestibular galvanic stimulation (fMRI). J.
Neurophysiol., 85, 886-899.
J. Besle, A. Fort & M.-H. Giard (in press) Interest and validity of the additive model in electrophysiological studies of multisensory interactions. Cognitive Processing.
G. A. Calvert (2001) Crossmodal processing in the human brain: Insights from functional neuroimaging studies. Cereb. Cortex, 11, 1110-1123.
G. A. Calvert, M. J. Brammer, E. T. Bullmore, R. Campbell, S. D. Iversen & A. S. David (1999) Response amplification in sensory-specific cortices during crossmodal binding.
Neuroreport, 10, 2619-2623.
G. A. Calvert & R. Campbell (2003) Reading speech from still and moving faces: The neural substrates of visible speech. J. Cogn. Neurosci., 15, 57-70.
C. Colin, M. Radeau, A. Soquet, D. Demolin, F. Colin & P. Deltenre (2002) Mismatch negativity evoked by the McGurk-MacDonald effect: A phonetic representation within short-term memory. Clin. Neurophysiol., 113, 495-506.
A. Falchier, S. Clavagnier, P. Barone & H. Kennedy (2002) Anatomical evidence of multimodal integration in primate striate cortex. J. Neurosci., 22, 5749-5759.
D. Fernandez-Duque & M. I. Posner (1997) Relating the mechanisms of orienting and alerting. Neuropsychologia, 35, 477-486.
A. Fort, C. Delpuech, J. Pernier & M. H. Giard (2002a) Dynamics of cortico-subcorical crossmodal operations involved in audio-visual object detection in humans. Cereb. Cortex,
12, 1031-1039.
A. Fort, C. Delpuech, J. Pernier & M. H. Giard (2002b) Early auditory-visual interactions in human cortex during nonredundant target identification. Brain Res. Cogn. Brain Res., 14, 20-30.
A. Fort & M.-H. Giard (2004) Multiple electrophysiological mechanisms of audio-visual integration in human perception. In Calvert, G., Spence, C. & Stein, B. (eds). MIT Press.
J. J. Foxe, I. A. Morocz, M. M. Murray, B. A. Higgins, D. C. Javitt & C. E. Schroeder (2000) Multisensory auditory-somatosensory interactions in early cortical processing revealed by high-density electrical mapping. Brain Res. Cogn. Brain Res., 10, 77-83.
M.-H. Giard, A. Fort, Y. Mouchetant-Rostaing & J. Pernier (2000) Neurophysiological mechanisms of auditory selective attention in humans. Frontiers in Bioscience, 5, 84-94.
M. H. Giard & F. Peronnet (1999) Auditory-visual integration during multimodal object recognition in humans : A behavioral and electrophysiological study. J. Cogn. Neurosci., 11, 473-490.
M. H. Giard, F. Perrin, J. F. Echallier, M. Thevenet, J. C. Froment & J. Pernier (1994) Dissociation of temporal and frontal components in the human auditory N1 wave: A scalp current density and dipole model analysis. Electroencephalogr. Clin. Neuro., 92, 238-252.
K. W. Grant & P. F. Seitz (2000) The use of visible speech cues for improving auditory detection of spoken sentences. J. Acoust. Soc. Am., 108, 1197-1208.
D. Guthrie & J. S. Buchwald (1991) Significance testing of difference potentials.
Psychophysiology, 28, 240-244.
M. Hershenson (1962) Reaction time as a measure of intersensory facilitation. J. Exp.
Psychol., 63, 289-293.
S. A. Hillyard, W. A. Teder-Salejarvi & T. F. Munte (1998) Temporal dynamics of early perceptual processing. Curr. Opin. Neurobiol., 8, 202-210.
P. J. Holcomb & J. E. Anderson (1993) Cross-modal semantic priming - a time-course analysis using event-related brain potentials. Language and Cognitive Processes, 8, 379-411.
P. J. Holcomb & H. J. Neville (1990) Auditory and visual semantic priming in lexical decision: A comparison using event-related brain potentials. Language and Cognitive
Processes, 5, 281-312.
R. Kawashima, B. T. O'Sullivan & P. E. Roland (1995) Positron-emission tomography studies of cross-modality inhibition in selective attentional tasks: Closing the "mind's eye". Proc.
Natl. Acad. Sci. U S A., 92, 5969-5972.
P. J. Laurienti, J. H. Burdette, M. T. Wallace, Y. F. Yen, A. S. Field & B. E. Stein (2002) Deactivation of sensory-specific cortex by cross-modal stimuli. J. Cogn. Neurosci., 14, 420-429.
R. Lebib, D. Papo, S. de Bode & P. M. Baudonnière (2003) Evidence of a visual-to-auditory cross-modal sensory gating phenomenon as reflected by the human P50 event-related brain potential modulation. Neurosci. Lett., 341, 185-188.
J. W. Lewis, M. S. Beauchamp & E. A. DeYoe (2000) A comparison of visual and auditory motion processing in human cerebral cortex. Cereb. Cortex, 10, 873-888.
E. Macaluso, C. Frith & J. Driver (2000) Modulation of human visual cortex by crossmodal spatial attention. Science, 289, 1206-1208.
G. R. Mangun (1995) Neural mechanisms of visual selective attention. Psychophysiology, 32, 4-18.
D. W. Massaro (1993) Perceiving asynchronous bimodal speech in consonant-vowel and vowel syllables. Speech Communication, 13, 127-134.
D. W. Massaro & M. M. Cohen (2000) Tests of auditory-visual integration efficiency within the framework of the fuzzy logical model of perception. J. Acoust. Soc. Am., 108, 784-789.
H. McGurk & J. McDonald (1976) Hearing lips and seeing voices. Nature, 264, 746-748.
K. Miki, S. Watanabe & R. Kakigi (2004) Interaction between auditory and visual stimulus relating to the vowel sounds in the auditory cortex in humans: A magnetoencephalographic study. Neurosci. Lett., 357, 199-202.
J. O. Miller (1982) Divided attention: Evidence for coactivation with redundant signals.
Cognit. Psychol., 14, 247-279.
J. O. Miller (1986) Time course of coactivation in bimodal divided attention. Percept.
Psychophys., 40, 331-343.
C. Miniussi, M. Girelli & C. A. Marzi (1998) Neural site of the redundant target effect: Electrophysiological evidence. J. Cogn. Neurosci., 10, 216-230.
S. Molholm, W. Ritter, M. M. Murray, D. C. Javitt, C. E. Schroeder & J. J. Foxe (2002) Multisensory auditory-visual interactions during early sensory processing in humans: A high-density electrical mapping study. Brain Res. Cogn. Brain Res., 14, 115-128.
R. Möttönen, C. M. Krause, K. Tiippana & M. Sams (2002) Processing of changes in visual speech in the human auditory cortex. Brain Res. Cogn. Brain Res., 13, 417-425.
R. Näätänen (2001) The perception of speech sounds by the human brain as reflected by the mismatch negativity (MMN) and its magnetic equivalent (MMNm). Psychophysiology, 38, 1-21.
R. Näätänen & T. W. Picton (1987) The N1 wave of the human electric and magnetic response to sound: A review and an analysis of the component structure. Psychophysiology,
24, 375-425.
R. Näätänen & I. Winkler (1999) The concept of auditory stimulus representation in cognitive neuroscience. Psychol. Bull., 125, 826-859.
R. S. Nickerson (1973) Intersensory facilitation of reaction time: Energy summation or preparation enhancement? Psychol. Rev., 80, 489-509.
I. R. Olson, J. C. Gatenby & J. C. Gore (2002) A comparison of bound and unbound audio-visual information processing in the human cerebral cortex. Brain Res. Cogn. Brain Res., 14, 129-138.
D. N. Pandya, M. Hallett & S. K. Kmukherjee (1969) Intra- and interhemispheric connections of the neocortical auditory system in the rhesus monkey. Brain. Res., 14, 49-65.
J. Pernier, F. Perrin & O. Bertrand (1988) Scalp current density fields: Concept and properties. Electroencephalogr. Clin. Neuro., 69, 385-389.
F. Perrin, J. Pernier, O. Bertrand & J. F. Echallier (1989) Spherical splines for scalp potential and current density mapping. Electroencephalogr. Clin. Neuro., 72, 184-187.
F. Perrin, J. Pernier, O. Bertrand & M. H. Giard (1987) Mapping of scalp potentials by surface spline interpolation. Electroencephalogr. Clin. Neuro., 66, 75-81.
M. I. Posner, M. J. Nissen & R. M. Klein (1976) Visual dominance: An information-processing account of its origins and significance. Psychol. Rev., 83, 157-171.
D. H. Raab (1962) Statistical facilitation of simple reaction times. Trans. N. Y. Acad. Sci., 24, 574-590.
T. Raij, K. Uutela & R. Hari (2000) Audiovisual integration of letters in the human brain.
Neuron, 28, 617-625.
R. Ratcliff (1979) Group reaction time distributions and an analysis of distribution statistics.
Psychol. Bull., 86, 446-461.
D. Reisberg, J. McLean & A. Goldfield (1987) Easy to hear but hard to understand : A lipreading advantage with intact auditory stimuli. In Dodd, B. & Campbell, R. (eds) Hearing
by eye : The psychology of lipreading. Lawrence Erlbaum Associates, pp. 93-113.
M. Sams, R. Aulanko, H. Hamalainen, R. Hari, O. V. Lounasmaa, S. T. Lu & J. Simola (1991) Seeing speech: Visual information from lip movements modifies activity in the human auditory cortex. Neurosci. Lett., 127, 141-145.
M. Scherg (1990) Fundamentals of dipole source potential analysis. In Grandori, F., Hoke, M. & Romani, G. L. (eds) Auditory evoked magnetic fields and electric potentials. Advances in
audiology, Vol.5. Karger, pp. 40-69.
M. Scherg & D. Von Cramon (1985) A new interpretation of the generators of BAEP waves I-V: Results of a spatio-temporal dipole model. Electroencephalogr. Clin. Neuro., 62, 290-299.
M. Scherg & D. Von Cramon (1986) Evoked dipole source potentials of the human auditory cortex. Electroencephalogr. Clin. Neuro., 65, 344-360.
C. Schroeder, S. Molholm, P. Lakatos, W. Ritter & J. J. Foxe (in press) Human-simian correspondence in the early cortical processing of multisensory cues. Cognitive Processing. C. E. Schroeder & J. J. Foxe (2002) The timing and laminar profile of converging inputs to multisensory areas of the macaque neocortex. Brain Res. Cogn. Brain Res., 14, 187-198.
C. E. Schroeder, R. W. Lindsley, C. Specht, A. Marcovici, J. F. Smiley & D. C. Javitt (2001) Somatosensory input to auditory association cortex in the macaque monkey. J. Neurophysiol.,
85, 1322-1327.
B. Seltzer & D. N. Pandya (1978) Afferent cortical connections and architectonics of the superior temporal sulcus and surrounding cortex in the rhesus monkey. Brain. Res., 149, 1-24.
W. H. Sumby & I. Pollack (1954) Visual contribution to speech intelligibility in noise. J.
Acoust. Soc. Am., 26, 212-215.
Q. Summerfield (1987) Some preliminaries to a comprehensive account of audio-visual speech perception. In Dodd, B. & Campbell, R. (eds) Hearing by eye : The psychology of
lipreading. Lawrence Erlbaum Associates, pp. 3-52.
C. M. Thiel, K. Zilles & G. R. Fink (2004) Cerebral correlates of alerting, orienting and reorienting of visuospatial attention: An event-related fMRI study. Neuroimage, 21, 318-328.
H. G. Vaughan & W. Ritter (1970) The sources of auditory evoked responses recorded from the human scalp. Electroencephalogr. Clin. Neuro., 28, 360-367.
E. K. Vogel & S. J. Luck (2000) The visual N1 component as an index of a discrimination process. Psychophysiology, 37, 190-203.
Figure Legends
Figure 1: Time-Course of an Auditory-Visual non-Target Trial
Each trial began with the presentation of a blank screen for 500 ms. Then a still image of a closed mouth was displayed during a random period of 340-840 ms. The mouth began to move 240 ms (6 frames) before opening (time zero). Then, the corresponding sound was played. The lip movement ended 280 ms after time zero with an image of the closed mouth that remained for a random time of 500-700 ms for non-target trials, and until the key press for target trials (or for 1500 ms if the subject did not respond). In the visual-only condition, the time course was similar except that the sound was not played. In the auditory-only condition, the mouth remained closed all along the trial. (VOT = Voice Onset Time)
Figure 2: Violation of the Race Model Inequality in the Behavioural-only Experiment
A: Mean reaction times for the auditory, visual and audiovisual trials. B: Cumulative probability density functions (CDFs) of the reaction times in the three (A, V, AV) conditions of presentation, pooled across subjects. The stimuli and procedure were similar to those used in the main experiment, except that subjects responded to the targets in the 3 conditions. For shorter reaction times, the CDF for AV responses (thick line) is above the sum of the A and V CDFs (thin dotted line). The hatched area between these two curves illustrates the fractiles for which the violation of the race model inequality [P(RTAV < t) ≤ P(RTA < t) + P(RTV < t)] is
statistically significant (p<0.001).
Figure 3: Unimodal and Bimodal Responses
Grand-average ERPs at 5 illustrative electrodes in each of the 3 conditions of presentation (A, V, AV) from 150 ms before time zero to 300 ms after. The unimodal auditory N1 wave peaks at 136 ms post-stimulus around Cz with small polarity reversals at mastoid sites (Ma1 and Ma2). The visual “N1” wave is maximum around occipito-parietal electrodes (PO3 and PO4) at about 40 ms after time zero (this short latency is due to the fact that lip movements began before time zero). Insert: Grand-average SCDs at Cz are presented to illustrate the difficulty of interpreting interaction effects locally (see Footnote 1).
Figure 4: Bimodal vs Sum of Unimodal Responses
Comparison of the response to bimodal AV stimuli (dotted lines) with the sum (A+V) of the unimodal responses (thin lines) at 5 illustrative electrodes, from -150 to 300 ms. The AV response closely follows the A+V trace, except at central sites (illustrated here at Cz) where the two traces significantly differ from about 120 to 190 ms after time zero (see Figure 5). Insert: For homogeneity with Figure 3, grand-average SCDs are also presented at this electrode.
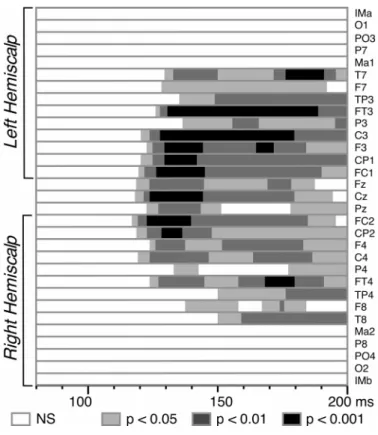
Figure 5: Statistical Significance of the Auditory-Visual Interactions
Results of the Student’s t-tests (N=15 subjects) comparing the [AV - (A+V)] amplitudes to zero at each latency from 80 to 200 ms after time zero. Electrodes at the centre of the figure correspond to frontal and central sites and those at the extrema (top and bottom) to more lateral sites. Significant interactions start around 120 ms over fronto-central areas with stronger effects (P < 0.001) on the left hemiscalp.
Figure 6: Comparison of the AV Interactions with the Auditory N1 Wave
Scalp potential (SP) and current density (SCD) topographies over the left and right hemiscalps, at the latency of the unimodal auditory N1 wave (136 ms). Each row displays: left part, the distributions of the auditory (A), visual (V), bimodal (AV) responses and the sum of auditory and visual (A+V) responses; right part, the distributions of the [AV - (A+V)] interaction pattern with the associated Student's t-map estimated on potential values at the same latency (136 ms). The grey colours in t-maps indicate the scalp areas where [AV - (A+V)] significantly differs from zero. In potential and SCD maps, half the range of the scale (in µV or mA/m3) is given below each map. The topography of the crossmodal interaction pattern is similar to that of the unimodal auditory N1 wave, but with opposite polarities. This interaction could therefore reflect a decrease of the unimodal N1 response in auditory cortex.