HAL Id: hal-00295793
https://hal.archives-ouvertes.fr/hal-00295793
Submitted on 24 Nov 2005
HAL is a multi-disciplinary open access
archive for the deposit and dissemination of
sci-entific research documents, whether they are
pub-lished or not. The documents may come from
teaching and research institutions in France or
abroad, or from public or private research centers.
L’archive ouverte pluridisciplinaire HAL, est
destinée au dépôt et à la diffusion de documents
scientifiques de niveau recherche, publiés ou non,
émanant des établissements d’enseignement et de
recherche français ou étrangers, des laboratoires
publics ou privés.
Low temperature mid-infrared cross-sections for
peroxyacetyl nitrate (PAN) vapour
G. Allen, J. J. Remedios, K. M. Smith
To cite this version:
G. Allen, J. J. Remedios, K. M. Smith. Low temperature mid-infrared cross-sections for peroxyacetyl
nitrate (PAN) vapour. Atmospheric Chemistry and Physics, European Geosciences Union, 2005, 5
(11), pp.3153-3158. �hal-00295793�
www.atmos-chem-phys.org/acp/5/3153/ SRef-ID: 1680-7324/acp/2005-5-3153 European Geosciences Union
Chemistry
and Physics
Low temperature mid-infrared cross-sections for peroxyacetyl
nitrate (PAN) vapour
G. Allen1, J. J. Remedios1, and K. M. Smith2
1EOS, Space Research Centre, Department of Physics and Astronomy, University of Leicester, Leicester, LE1 7RH, UK 2Space Science and Technology Department, Rutherford Appleton Laboratory, Didcot, Oxon, OX11 0QX, UK
Received: 7 June 2005 – Published in Atmos. Chem. Phys. Discuss.: 8 August 2005 Revised: 19 October 2005 – Accepted: 24 October 2005 – Published: 24 November 2005
Abstract. Laboratory absorption spectra of peroxyacetyl
ni-trate (PAN, CH3C(O)OONO2) vapour have been measured
in the mid-infrared range 550 cm−1 to 1400 cm−1 (18.2 to 7.14 µm) at both 250 K and 273 K, using a Fourier trans-form infrared spectrometer at a nominal spectral resolution of 0.25 cm−1 (unapodised). In addition, the 1600 cm−1 to 2200 cm−1(6.25 to 4.54 µm) spectral region has been mea-sured at 250 K. Cross-sectional data at each temperature, as well as integrated band intensities and peak infrared ab-sorptivities for nine absorption bands of PAN in this spec-tral range, have been derived from a total of twelve sepa-rately measured PAN transmission spectra. A general in-crease in the peak absorption cross-section for all bands is noted with decreasing temperature, with cross-sectional in-creases in the range 6% (for the 1842 cm−1band) and 30%
(for the 991 cm−1band) at 250 K, relative to those previously
reported at 295 K. Differences in integrated band intensities range from −22% to +16% for the 1741 cm−1and 991 cm−1 bands respectively over the same temperature range. These new absorption cross-sections for PAN are the first to be re-ported at temperatures below 295 K, allowing the possibility of improved retrievals of the atmospherically important PAN species from remotely sensed infrared spectra of the cold up-per troposphere. These new cross-sectional data accompany this paper as an electronic supplement.
1 Introduction
PAN is one of the most important odd-nitrogen (NOy)
com-pounds in the atmosphere, both through its direct influence on the oxidising power of the atmosphere and also through its indirect role as a reservoir species for active nitrogen (Singh and Hanst, 1981; Singh, 1987). Furthermore, PAN has
of-Correspondence to: G. Allen
ten been noted to be the most abundant NOy species in the middle and upper troposphere in pollution events (Roberts, 1990; Roberts et al., 2004).
PAN is formed in the atmosphere by organic photochem-istry in the presence of NO2 with an atmospheric lifetime
dominated by thermolysis in the lower troposphere (<7 km) and photolysis in the upper troposphere (Talukdar et al., 1995). It is the relatively long lifetime (of the order of months) of PAN in the cold upper troposphere that makes this species an important global transport vehicle for NO2.
PAN concentrations as high as 650 pptv (at 10 km altitude) have been observed in pollution plumes such as those mea-sured by Roberts et al. (2004) in Asian pollution outflow.
Current measurements of PAN are limited to in situ sam-pling during specialised campaigns such as those described by Emmons et al. (2000), with uncertainties of the order 30% at typical upper troposphere (UT) concentrations (Tan-imoto et al., 1999). New satellite missions such as the in-frared solar occulation Atmospheric Chemistry Experiment (ACE), launched in August 2003 (see Bernath et al. (2005) for further details), and the infrared limb-sounding Michel-son Interferometer for Passive Atmospheric Sounding (MI-PAS) described by Fischer and Oelhaf (1996) and launched onboard Envisat in March 2002, could provide an alternative means to remotely detect trace organic species such as PAN by virtue of their characteristic infrared signature; and to de-termine global concentrations. The potential retrieval of PAN concentration data from satellite-derived spectra requires ac-curate laboratory cross-sections for PAN as well as for all other compounds exhibiting influence in the spectral window over which such retrieval is performed. Furthermore, this ref-erence spectral data must be measured at temperatures and pressures appropriate to the atmospheric profile.
In this paper, we report the first data for the infrared absorption cross-sections of PAN vapour recorded at tem-peratures below 291 K, complementing a room temperature dataset reported previously by Allen et al. (2005). These new
3154 G. Allen et al.: Low temperature PAN cross-sections
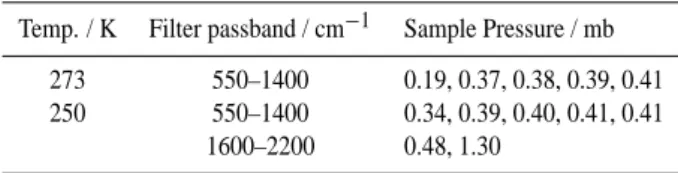
Table 1. Sample and measurement parameters for recorded spectra
employed in the calculation of infrared data for PAN. Temp. / K Filter passband / cm−1 Sample Pressure / mb
273 550–1400 0.19, 0.37, 0.38, 0.39, 0.41 250 550–1400 0.34, 0.39, 0.40, 0.41, 0.41
1600–2200 0.48, 1.30
spectral data for PAN will allow greater confidence in the identification and potentially the retrieval of PAN concentra-tion informaconcentra-tion for the colder temperatures of the free and upper troposphere. Atmospheric detection limits for PAN by this method are yet to be ascribed due to the variabilityin the performance of different infrared instruments (e.g. instru-ment noise and atmospheric pathlength). These laboratory measurements will allow such instrument-specific studies to be undertaken in the future.
2 Experimental method
PAN is a relatively heavy (141 amu) asymmetric top molecule with twenty-seven fundamental vibration modes, of which fifteen are expected to influence the 550 to 2200 cm−1 spectral region. Nominal band centres for PAN absorption bands used in this work are based on band assign-ments made by Bruckmann and Willner (1983). The strong 794 and 1163 cm−1 PAN bands are expected to be of key interest for remote-sensing applications given their strong spectral influence in these atmospheric window regions.
Spectra presented here were recorded using a Bruker IFS 120HR Fourier transform infrared (FTIR) spectrometer at the Molecular Spectroscopy Facility, Rutherford Appleton Lab-oratory, UK. A Fourier transform spectrometer is employed here for its ability to simultaneously measure the wide spec-tral range required for the broad absorption bands of PAN (typically greater than 40 cm−1). An evacuated 26.1 cm path length glass absorption cell equipped with wedged potassium bromide windows was interfaced with a customised gas han-dling vacuum line. Further details of the experimental proce-dure and sample generation are given by Allen et al. (2005). A short description is provided here, highlighting aspects of relevance to these experiments.
A liquid nitrogen-cooled MCT detector (MCT-D360) was used, giving an excellent signal-to-noise ratio over the re-gion of interest (typically better than 500:1 after co-addition at 1740.5 cm−1and 450:1 at worst for the 794.0 cm−1PAN band). Three overlapping spectral regions in the mid-infrared were measured using a 1 mm stop-aperture and appropriate optical and electronic filters. The use of optical and elec-tronic filters covering a narrow spectral range improved the signal-to-noise ratio in the measured spectra. Together with
a small stop aperture, these filters effectively removed the ef-fects of detector non-linearity, noted to be a problem with MCT detectors (Richardson et al., 1998). Using this method, no evidence of such non-linearity was observed in any of the measurements reported in this work.
PAN samples were prepared by the nitration of peracetic acid in a synthesis based on that described by Gaffney et al. (1984) and were tested for purity (found to be greater than 99%) by gas chromatography. At the cold temperatures of these experiments, no spectral evidence of contamination was observed in any measurement, as expected from vapour pressure and sample stability considerations. A summary of the sample and measurement parameters is given in Table 1, with each measurement (50 co-added scans) requiring ap-proximately six minutes. This time was sufficiently small so as to neglect thermal decomposition of the PAN sample (esti-mated to be less than 0.5% of sample). Sample emission was not expected at the cold temperatures of these experiments as confirmed by spectral measurement of PAN samples with the infrared source switched off. All spectra were recorded at an instrument spectral resolution of 0.25 cm−1 (where resolu-tion is defined here as 0.9/maximum optical path difference) and apodised with the Norton-Beer strong function (Norton and Beer, 1976, 1977). Five PAN samples were measured over a pressure range of 0.19 to 0.41 mb at both 273 K and 250 K across the spectral range 550 to 1400 cm−1, which is noted to be of major importance for remote-sensing applica-tions. In addition, two PAN samples were measured in the 1600 to 2200 cm−1 spectral region at 250 K to observe the interesting PAN bands centred at 1741 cm−1and 1842 cm−1. The upper limit on the potential sample pressure at 250 K was due to the small saturation vapour pressure of PAN at this temperature (approximately 1.4 mb) expected from the relationship reported by Bruckmann and Willner (1983).
In order to investigate the potential effects of pressure broadening on PAN spectral bands, a dry nitrogen gas source was used. A dry nitrogen source was chosen to minimize the potential presence of water in the sample cell and consequent unwanted spectral lines. For such measurements, dry nitro-gen gas was added to a known cell pressure of pure PAN up to a total cell pressure of 500 mb prior to spectral measurement, again at a spectral resolution of 0.25 cm−1with 50 co-added scans and over the same spectral range.
Transmission spectra were calculated by ratioing PAN sample spectra with the average of background spectra recorded immediately before and after each sample measure-ment. The limited pressure range studied has the advantage that PAN bands do not approach saturation (>40% transmis-sion for the strong 1741 cm−1 at 1.3 mb) at the pathlength used here, and measurements are not therefore expected to be subject to possible non-linearities in the Beer-Lambert law such as described by Chu et al. (1999) at high optical densi-ties.
Resolution of rotational fine structure was not observed in any measurement made in this work. An initial comparison
Table 2. Peak infrared absorptivities (10−1µmol−1m−1, log to base 10) and integrated intensities (atm−1cm−2) for PAN vapour at 250, 273 and 295 K. Units refer to 1013.25 mb at the nominal temperature.∗295 K data taken from work by Allen et al. (2005).
Band centre/ 250 K 273 K 295 K∗
cm−1
Peak Abs. Band Int. Peak Abs. Band Int. Peak Abs. Band Int. 606 1.89±0.36 39.0±3.0 1.81±0.33 35.9±2.6 1.55±0.12 34.2±1.4 794 13.44±0.86 272±11.0 13.20±0.80 252±9.0 11.40±1.0 241±6.0 930 1.80±0.17 36.2±2.9 1.72±0.26 34.1±2.5 1.46±0.12 32.2±1.2 991 1.34±0.12 23.4±2.1 1.24±0.21 21.5±1.6 1.03±0.08 20.1±0.8 1055 0.78±0.17 18.4±1.4 0.70±0.14 16.9±1.0 0.62±0.06 16.0±0.8 1163 16.77±1.02 401±20.0 15.90±0.96 370±17.0 14.60±1.0 356±8.0 1302 13.01±0.64 313±16.0 12.64±0.74 315±13 11.40±0.8 281±6.0 1741 33.53±1.64 419±9.0 – – 30.20±3.0 537±10.0 1842 10.11±0.77 242±4.0 – – 9.50±1.2 260±6.0
of measurements recorded at 0.25 cm−1and 0.03 cm−1 spec-tral resolution did not yield any resolution of fine struc-ture or differences in the observed absorption peak inten-sity. Therefore higher resolution measurements (greater than 0.05 cm−1) were not attempted in this study due to concerns over the stability of the sample over longer measurement times (e.g. greater than 1 h at 0.05 cm−1nominal resolution). Sample pressure was monitored by cross-calibrated 10 Torr and 1000 Torr (full-scale) MKS Baratron 390 pres-sure gauges (1 Torr=1.33 mb) after prior calibration with a certified aneroid manometer. To avoid decomposition or det-onation of the thermally unstable purified PAN sample, the Baratron gauges were operated at room temperature rather than at the nominal 313 K thermo-regulated operating tem-perature. The uncertainty in the measured pressure using this method was calculated to be less than 0.7% of full-scale for the 10 Torr gauge.
The cell was equipped with a thermally insulating jacket and cooled using thermo-regulated nitrogen-cooled liquid ethanol, pumped around the outer surfaces of the cell. Cell temperature was monitored by a series of eight platinum re-sistance (PT-100) thermometers, attached in thermal contact with the external walls of the absorption cell, giving a typical mean accuracy of better than 0.1 K.
3 Results
Using an error-weighted linear least squares regression to the measured absorbance as a function of sample pressure for each spectral point (see Allen et al., 2005 for a further de-scription of this method), absolute absorption cross-sections at each temperature were calculated from the Beer-Lambert law:
Iν =I0νe−nσνx, (1)
where n is the target gas molecular number density (calcu-lated assuming ideal gas behaviour), σν is the absorption cross-section per molecule as a function of wavenumber, ν; and x is the absorption cell path length. The Iν/Iν0term
de-fines the transmission spectrum calculated for each measure-ment. Similarly, integrated band intensities and peak infrared absorptivities were also calculated from error-weighted re-gression fits to the nominal PAN band area and peak ab-sorbance as a function of pressure respectively. Such er-ror weighting accounts for the small uncertainty due to the measurement accuracy of sample pressure and temperature as well as radiometric errors such as instrumental noise.
Integrated band intensities and peak infrared absorptivities are given in Table 2 at each temperature. Similar results for PAN at room temperature (295 K) from Allen et al. (2005) are also quoted for comparison. The error quoted refers to a two standard deviation uncertainty (95% confidence level) calculated from fit statistics to the regression as described in more detail by Allen et al. (2005). The addition of dry nitrogen gas to pure PAN samples up to a total cell pres-sure (PAN+N2) of 500 mb resulted in no significant evidence
of broadening of the PAN absorption bands studied in this spectral range and negligible change (<0.1%) in calculated band intensities and peak infrared absorptivities confirming similar findings by Tsalkani and Toupance (1989) at room temperature.
There is an observed increase in both peak absorptivity and integrated band intensity with decreasing temperature for all but the 1741 and 1842 cm−1bands, for which an
in-crease in the peak absorptivity is accompanied by a dein-crease in the integrated band intensity. A maximum 30% and min-imum 6% increase is seen at 250 K for the 991 cm−1 and 1842 cm−1peak absorptivities respectively, relative to those reported at 295 K. Differences in integrated band intensity at 250 K range from +16% and −22% relative to those reported at 295 K for the 991 cm−1and 1741 cm−1bands respectively.
3156 G. Allen et al.: Low temperature PAN cross-sections
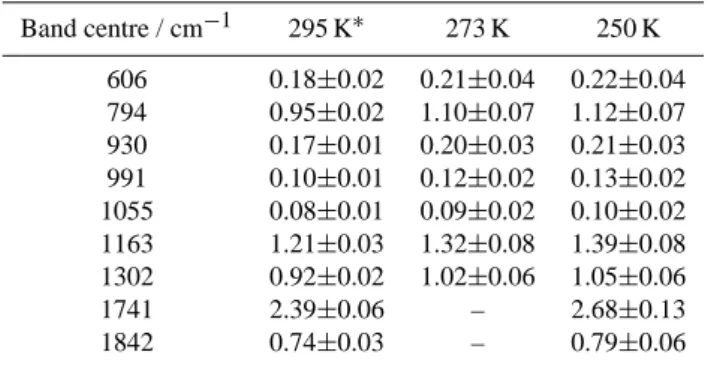
Table 3. Peak infrared absorption cross-section (×10−18cm2molecule−1) at 250, 273 and 295 K for nine PAN absorption bands in the mid-infrared. Errors shown represent the two standard deviation uncertainty calculated from a Beer’s law fit at the nominal band centre. ∗295 K data taken from work by Allen et al. (2005). Band centre / cm−1 295 K∗ 273 K 250 K 606 0.18±0.02 0.21±0.04 0.22±0.04 794 0.95±0.02 1.10±0.07 1.12±0.07 930 0.17±0.01 0.20±0.03 0.21±0.03 991 0.10±0.01 0.12±0.02 0.13±0.02 1055 0.08±0.01 0.09±0.02 0.10±0.02 1163 1.21±0.03 1.32±0.08 1.39±0.08 1302 0.92±0.02 1.02±0.06 1.05±0.06 1741 2.39±0.06 – 2.68±0.13 1842 0.74±0.03 – 0.79±0.06
The relative uncertainty (within the 95% confidence level) of the results reported in Table 2 ranges between 4% at best for the strong 794 cm−1PAN integrated band intensity and 22% at worst for the very weak 1055 cm−1peak absorptivity. The decrease in accuracy for weaker PAN bands is due to the in-creased uncertainty introduced by baseline noise relative to their weak spectral signatures. For the five strongest PAN absorption bands, relative uncertainty is calculated to be less than 5% at all temperatures. However, it is noted that due to the assigned uncertainty for each integrated band inten-sity there is the possibility for overlap at the extremes of the assigned error for intensities calculated at 250 K and 295 K.
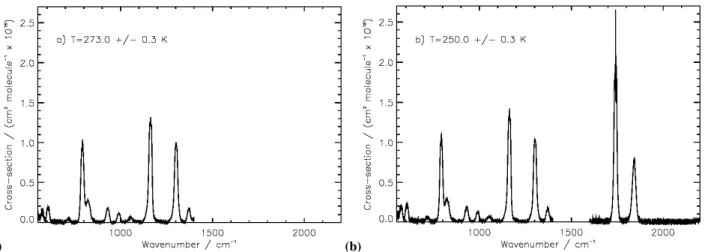
The calculated absorption cross-sections across the spec-tral range covered at each temperature, are plotted in Fig. 1. Differences in the structure of the 794, 1163, 1741 and 1842 cm−1 bands with decreasing temperature are illus-trated in more detail in Fig. 2, with an observed narrow-ing of these bands seen to be most significant for the 1741 and 1842 cm−1 bands. The full-width at half-maximum
(FWHM) of the 1741 cm−1band is reduced from 20 cm−1at
295 K to 16 cm−1at 250 K, whilst for the 1842 cm−1band, this is reduced from 26 cm−1to 23 cm−1. In addition, some difference in the structure of the P, Q and R branching of the 1741 cm−1PAN band is evident with a sharpening of the as-sociated Q branch and a difference in the relative intensities of the P and R branches with decreasing temperature. Fur-thermore, the 1842 cm−1band shows a shift in the point of maximum band intensity to higher wavenumber with the ob-served band centre shifted by 1 cm−1from 1841.5 cm−1, at 295 K, to 1842.5 cm−1at 250 K.
The calculated peak absorption cross-sections are given in Table 3, with a comparison to room temperature data from Allen et al. (2005). Peak cross-sectional increases with decreasing temperature are in the range between 6% (for the 1842 cm−1PAN band) and 30% (for the 991 cm−1
PAN band) for all bands between 295 K and 250 K, reflect-ing the increases in peak infrared absorptivity discussed ear-lier. Again, the relative uncertainty is less than 5% for the five principal absorption bands in this spectral range at all temperatures studied, although there is the possibility for some overlap within this uncertainty between the peak cross-sections calculated at each temperature.
The observed narrowing of PAN absorption bands and the corresponding increase in peak infrared absorptivity with de-creasing temperature for all bands is suggested to be pre-dominantly due to changes in the thermal population distri-bution of rotational energy levels. Explanations of increases in integrated band strength with decreasing temperature for other heavy asymmetric top molecules, similar to those re-ported here for all but the 1741 and 1842 cm−1PAN bands,
include the effects of saturation of narrow lines (McDaniel et al., 1991) and contributions from temperature dependant an-harmonicity terms to the band intensities (Yao and Overend, 1976; Wang et al., 2001). In our measurements, we are con-fident that the experimental conditions ensure that the for-mer cannot occur due to the low optical densities observed, whereas resonance between the high density of ro-vibrational states giving rise to infrared absorption is certainly a possi-bility. The marked decrease (28%) in the 1741 cm−1 inte-grated band intensity between 295 and 250 K, and associated changes in the relative intensities of the P, Q an R branches, is consistent with an expected decrease in the population (at lower temperatures) of possible superimposed hot bands and combination bands.
Such subtleties of structure, together with differences in intensity could be important for accurate remote sensing of PAN in the colder atmosphere from infrared measurements of the atmosphere. Further measurements of PAN at temper-atures between 200 K and 250 K would therefore be desir-able, although challenging, requiring both long sample path-lengths and accurate measurement of PAN at very small sam-ple pressures (due to low saturation vapour pressure).
4 Conclusions
Absorption cross-sections for PAN in the atmospherically important spectral range 550 to 1400 cm−1 at 273 K and 250 K have been calculated for the first time from twelve spectra of independent PAN samples at a spectral resolution of 0.25 cm−1. In addition, the 1600 to 2200 cm−1 spectral region has been surveyed at 250 K.
Peak infrared absorptivities for all PAN bands are seen to increase with decreasing temperature with correspond-ing cross-sectional increases in the range 6% (for the strong 1842 cm−1 PAN band) and 30% (for the weak 991 cm−1 PAN band) at 250 K relative to those calculated at 295 K (using previously reported data by Allen et al. (2005). Fur-thermore, integrated band intensities are observed to increase for all but the 1741 and 1842 cm−1PAN bands. Changes in
(a) (b)
Fig. 1. PAN mid-infrared absorption cross-sections (0.25 cm−1resolution) at sample temperatures of: (a) 273 K±0.3 K (550 to 1400 cm−1); and (b) 250±0.3 K (550–1400 cm−1, 1600–2000 cm−1). Note: measurements at 273 K were not made above 1600 cm−1
(a) (b)
(c) (d)
Fig. 2. A close up of the: (a) 794, (b) 1163, (c) 1741 and (d) 1842 cm−1PAN bands showing temperature dependence at 295 K (solid line) 273 K (dotted line) and 250 K (dashed line). Note: 295 K data taken from Allen et al. (2005).
3158 G. Allen et al.: Low temperature PAN cross-sections
integrated band intensities at 250 K relative to those at 295 K range from −22% (for the 1741 cm−1band) to +16% (for the
991 cm−1band). Relative uncertainty is typically better than
5% for the strong PAN bands. However, it is noted that due to the assigned uncertainty for each integrated band inten-sity there is the possibility of overlap at the extremes of the assigned error for intensities calculated at 250 K and 295 K.
Structural differences in the principal PAN absorption bands are noted, with a marked narrowing of the 1741 and 1842 bands cm−1with decreasing temperature. Also a sharp-ening of the 1742 cm−1PAN band Q branch and a difference in the relative intensity of the P and R branches is also noted for this band. There is also evidence for a shift (+1 cm−1) in the point of peak intensity of the 1842 cm−1 band from 1841.5 cm−1 to 1842.5 cm−1. No significant broadening of PAN bands was observed with the addition of dry nitrogen gas (up to 500 mb total pressure) to pure PAN samples.
In particular, the temperature dependence of the 794 and 1163 cm−1 PAN bands is of great importance in remote-sensing applications due to their varying spectral influences in these atmospheric window regions at the colder tempera-tures of the free and upper troposphere. The measurement of these bands at three temperatures (295 K, 273 K and 250 K) gives greater confidence in their temperature dependence.
These new cross-sections accompany this work as an electronic supplement (http://www.atmos-chem-phys.org/ acp/5/3153/acp-5-3153-sp.zip) and complement PAN cross-sectional data at room temperature (295 K) previously re-ported by Allen et al. (2005), together allowing a more ac-curate investigation of PAN throughout the troposphere.
Acknowledgements. The authors wish to thank the Natural
En-vironment Research Council (NERC) for supporting G. Allen through grant ref: NER/T/S/2000/01087, and for access to the Molecular Spectroscopy Facility at the Rutherford Appleton Lab-oratory (RAL). R. G. Williams is thanked for providing technical support at the Rutherford Appleton Laboratory.
Edited by: A. Hofzumahaus
References
Allen, G., Remedios, J. J., Newnham, D. A., Smith, K. M., and Monks, P. S.: Improved mid-infrared cross-sections for perox-yacetyl nitrate (PAN) vapour, Atmos. Chem. Phys., 5, 47–56, 2005,
SRef-ID: 1680-7324/acp/2005-5-47.
Bernath, P. F., Boone, C., Walker, K., McLeod, S., Nassar, R.: The Atmospheric Chemistry Experiment (ACE): Mission Overview, Geophys. Res. Lett., 32, L15S01, doi:10.1029/2005GL022386, 2005.
Bruckmann, P. W. and Willner, H.: Infrared spectroscopic study of peroxyacetyl nitrate (PAN) and its decomposition products, Environ. Sci. Tech., 17, 352–357, 1983.
Chu, P. M., Grunther, F. R., Rhoderick, G. C., and Lafferty, W. J.: The NIST quantitative infrared database, J. Res. Nat. I, 104(1), 59–81, 1999.
Emmons L. K., Hauglustaine, D. A., Muller, J. F., Carroll, M. A., Brasseur, G. P., Brunner, D., Staehelin, J., Thouret, V., and Marenco, A.: Data composites of airborne observations of tropo-spheric ozone and its precursors, J. Geophys. Res., 105, 20 497– 20 538, 2000.
Fischer, H. and Oelhaf, H.: Remote sensing of vertical profiles of atmospheric trace constituents with MIPAS limb-emission spec-trometers, Appl. Opt., 35, 2787–2796, 1996.
Gaffney, J. S., Fajer, R., and Senum, G. I.: An improved procedure for high purity gaseous peroxyacetyl nitrate production: Use of heavy lipid solvents, Atmos. Environ., 18, 215–218, 1984. McDaniel, A. H., Cantrell, C. A., Davidson, J. A., Shetter, R. E., and
Calvert, J. G.: The temperature-dependent, infrared-absorption cross-sections for the chlorofluorocarbons – CFC-11, CFC-12, CFC-13, CFC-14, CFC-22, CFC-113, CFC-114, and CFC-115, J. Atmos. Chem, 12, 211–227, 1991.
Norton, R. H. and Beer, R.: New apodising functions for Fourier spectrometry, J. Opt. Soc. A., 66, 259–264, 1976.
Norton, R. H. and Beer, R.: New apodising functions for Fourier spectrometry – Erratum, J. Opt. Soc. A., 67, p. 419, 1977. Richardson, R. L., Yang, H., and Griffiths, P. R.: Effects of Detector
Nonlinearity on Spectra Measured on Three Commercial FT-IR Spectrometers, Appl. Spectrosc., 52(4), 572–578, 1998. Roberts, J. M.: The atmospheric chemistry of organic nitrates,
At-mos. Environ., Part A, 24A, 243–287, 1990.
Roberts, J. M., Flocke, F., Chen, G., et al.: Measurement of per-oxycarboxylic nitric anhydrides (PANs) during the ITCT 2K2 aircraft intensive experiment, J. Geophys. Res., 109, D23S21, doi:10.1029/2004/JD004960, 2004.
Singh, H. B.: Reactive nitrogen in the troposphere – chemistry and transport of NOx and PAN, Environ. Sci. Technol., 21, 320–327, 1987.
Singh, H. B. and Hanst, P. L.: Peroxyacetyl nitrate (PAN) in the un-polluted atmosphere: An important reservoir for nitrogen oxides, Geophys. Res. Lett., 8, 941–944, 1981.
Talukdar, R. K., Burkholder, J. B., Schmoltner, A., Roberts, J. M., Wilson, R. R., and Ravishankara, A. R.: Investigation of he loss processes for peroxyacetyl nitrate in the atmosphere: UV pho-tolysis and reaction with OH, J. Geophys. Res-A., 100, 14 163– 14 173, 1995.
Tanimoto, H., Hirokawa, J., Kajii, Y., and Akimoto, H.: A new mea-surement technique at parts per trillion by volume levels: Gas chromatography/negative ion chemical ionization mass spec-trometry, J. Geophys. Res., 104, 21 343–21 354, 1999.
Tsalkani, N. and Toupance, G.: Infrared absorptivities and inte-grated band intensities for gaseous peroxyacetyl nitrate (PAN), Atmos. Environ., 23, 1849–1854, 1989.
Wang, W. F., Stevenson, A., Reuter, D. C., and Sirota, J. M.: Ab-solute band intensities of acetone [(CH3)2CO)] in the infrared
region 830–3200 cm−1at low and room temperatures, Spectr. Acta, 57, 1603–1610, 2001.
Yao, S. J. and Overend, J.: Vibrational intensities: Effect of an-harmonicity on temperature-dependence of integrated intensities, Spectr. Acta, 32(5), 1059–1065, 1976.