Publisher’s version / Version de l'éditeur:
Journal of ASTM International (JAI), 8, 3, pp. 1-14, 2011-03-01
READ THESE TERMS AND CONDITIONS CAREFULLY BEFORE USING THIS WEBSITE. https://nrc-publications.canada.ca/eng/copyright
Vous avez des questions? Nous pouvons vous aider. Pour communiquer directement avec un auteur, consultez la
première page de la revue dans laquelle son article a été publié afin de trouver ses coordonnées. Si vous n’arrivez pas à les repérer, communiquez avec nous à PublicationsArchive-ArchivesPublications@nrc-cnrc.gc.ca.
Questions? Contact the NRC Publications Archive team at
PublicationsArchive-ArchivesPublications@nrc-cnrc.gc.ca. If you wish to email the authors directly, please see the first page of the publication for their contact information.
NRC Publications Archive
Archives des publications du CNRC
This publication could be one of several versions: author’s original, accepted manuscript or the publisher’s version. / La version de cette publication peut être l’une des suivantes : la version prépublication de l’auteur, la version acceptée du manuscrit ou la version de l’éditeur.
For the publisher’s version, please access the DOI link below./ Pour consulter la version de l’éditeur, utilisez le lien DOI ci-dessous.
https://doi.org/10.1520/JAI102924
Access and use of this website and the material on it are subject to the Terms and Conditions set forth at
Correlation between water vapour and air permeability of building materials: experimental observations
Mukhopadhyaya, P.; Batcheller, D.; Kumaran, M. K.; Lackey, J. C.; Van Reenen, D.; Normandin, N.
https://publications-cnrc.canada.ca/fra/droits
L’accès à ce site Web et l’utilisation de son contenu sont assujettis aux conditions présentées dans le site LISEZ CES CONDITIONS ATTENTIVEMENT AVANT D’UTILISER CE SITE WEB.
NRC Publications Record / Notice d'Archives des publications de CNRC:
https://nrc-publications.canada.ca/eng/view/object/?id=e781e530-c054-4b55-8645-c72b3856103a https://publications-cnrc.canada.ca/fra/voir/objet/?id=e781e530-c054-4b55-8645-c72b3856103a
http://www.nrc-cnrc.gc.ca/irc
Corre la t ion be t w e e n w a t e r va pour a nd a ir pe rm e a bilit y of building
m a t e ria ls: e x pe rim e nt a l obse rva t ions
N R C C - 5 4 0 0 5
M u k h o p a d h y a y a , P . ; B a t c h e l l e r , D . ; K u m a r a n , M . K . ; L a c k e y , J . C . ; V a n R e e n e n , D . ; N o r m a n d i n , N .M a r c h 2 0 1 1
A version of this document is published in / Une version de ce document se trouve dans:
ournal of ASTM International (JAI), 8, (3), pp. 1-14, March 01, 2011
The material in this document is covered by the provisions of the Copyright Act, by Canadian laws, policies, regulations and international agreements. Such provisions serve to identify the information source and, in specific instances, to prohibit reproduction of materials without written permission. For more information visit http://laws.justice.gc.ca/en/showtdm/cs/C-42
Les renseignements dans ce document sont protégés par la Loi sur le droit d'auteur, par les lois, les politiques et les règlements du Canada et des accords internationaux. Ces dispositions permettent d'identifier la source de l'information et, dans certains cas, d'interdire la copie de documents sans permission écrite. Pour obtenir de plus amples renseignements : http://lois.justice.gc.ca/fr/showtdm/cs/C-42
Phalguni Mukhopadhyaya1, Devin Batcheller2, Kumar Kumaran3, John Lackey4, David van Reenen4 and Nicole Normandin4
Correlation Between Water Vapour and Air
Permeability of Building Materials: Experimental
Observations
ABSTRACT:
Two fundamental properties of building materials that influence the hygrothermal performance of building envelope systems are water vapor permeability and air permeability. The driving forces for water vapor and air transmission through building materials are, respectively, partial water vapor pressure and total air pressure differentials. The theoretical similarity of the driving forces would suggest the possibility of a relationship between water vapor and air permeability. During past two decades, researchers at the National Research Council of Canada – Institute for Research in Construction (NRC-IRC) have compiled a database of measured air permeability and water vapour permeability properties of building materials commonly used in North America. This material properties database was examined to identify the degree to which air permeability and water vapor permeability of the building materials might be functionally related. The database was segregated into categories for different material types. An approximately linear relationship could, within some categories, be observed between water vapor permeability and air permeability. There were however approximately as many categories within which no relationship between the parameters was apparent as there were categories within which functional relationships between the parameters were apparent. Within categories where functional relationships were apparent, the form of the relationships generally depended on the mean relative humidity (RH) at which water vapor permeability was measured. In most cases, a definitive functional form of the relationship between water vapor permeability and air permeability could not be established
1
Senior Research Officer, Institute for Research in Construction, NRC Canada, Ottawa, Ontario, Canada.
2
Co-op Student, Institute for Research in Construction, NRC Canada, Ottawa, Ontario, Canada.
3
Principal Research Officer, Institute for Research in Construction, NRC Canada, Ottawa, Ontario, Canada.
4
KEYWORDS: water vapour permeability, air permeability, building materials, moisture management
Introduction
Air and vapour pressure differences are natural occurrences across the exterior building envelopes due to the differences between the regulated indoor conditions and the fluctuating external atmospheric environment. In order to carry out moisture and energy performance assessment of exterior building envelopes and ensure long-term serviceability, indoor comfort and sustainability of the built environment, it is necessary to determine the water vapour permeability and air permeability characteristics of the materials used for the building envelope construction. Hence, quite naturally, the National Building Code of Canada (NBC) requires that building assemblies control both air leakage and vapour diffusion between interior and exterior spaces (1). For this purpose the NBC (see 9.25.3; 9.25.4; Table A-9.25.1.2.B) has specific air permeability and vapour permeability requirements for air and vapour barrier systems used in the building envelope construction.
Water vapour is transported from one region to another due to a difference in water vapour pressure between the two regions and air is transported from one region to another due to a similar difference in air pressure. This similarity logically brings up the possibility of a relationship between water vapour permeability and air permeability of building materials. At the same time, the polarity of water molecules may make the transport process of water vapour more complex than that of the non-polar oxygen and nitrogen molecules in air. Furthermore, in the finer pores of the building materials water vapour may condense at vapour pressures that are substantially lower than the saturated vapour pressure of free water and add to the complexity of the transport mechanism. From that point of view there may not be any correlation between water vapour permeability and air permeability of building materials.
If there exists any relationship between water vapour permeability and air permeability it will not only reduce the cost and time associated with the material properties measurements but will also be a useful information for the building design professionals. However, due to the absence of adequate test data, till today no investigation has been carried out to research a possible correlation between water vapour permeability and air permeability.
During past two decades extensive heat-air-moisture transport (i.e. hygrothermal) properties measurements have been carried out on numerous building materials, commonly used in North America, and data have been collected by the researchers at the National Research Council Canada - Institute for Research in Construction (NRC-IRC). This paper presents a critical analysis of the available NRC-IRC test data, and focuses on the possibility and limitations of establishing a relationship between water vapour permeability and air permeability.
Water Vapour Permeability
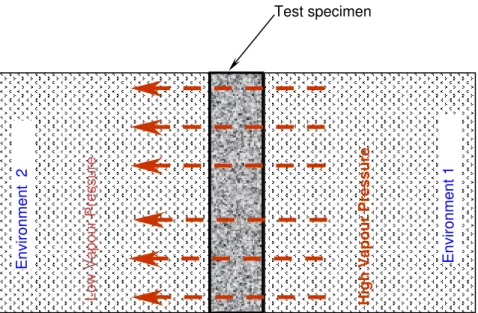
Water vapour transmission occurs due to the movement of water vapour from a region of high vapour pressure to a region of low vapour pressure. In building materials, water vapour migrates through the pore structure of the material. The water vapour permeability of any building material at unit thickness can be defined as the rate of water vapour transmission per unit area per unit of vapour pressure differential under specified test conditions. The vapour diffusion equation is directly used to determine the water vapour permeability of building materials (2). The measurements are usually made under isothermal conditions. A test specimen of known area and thickness separates two environments that differ in relative humidity (RH) and vapour pressure (Figure 1). The rate of vapour flow across the specimen, under steady-state conditions (known RHs as constant boundary conditions), is then gravimetrically determined. From these data the water vapour permeability of the material is calculated as:
δp = Jv⋅t/(A⋅Δpv) [1]
Where: Jv = Water vapour flow rate across an area A
t = Thickness of the specimen
Δpv = Difference in water vapour pressure across specimen surfaces
Often, especially for membranes and composite materials, one calculates the water vapour permeance, δ
t, of a product at a given thickness (t) from the above measurements as:
δl = Jv/(A⋅Δp) [2]
ASTM Standard E 96/E 96M - 05, Standard Test Methods for Water Vapour Transmission of Materials, prescribes two specific cases of this procedure - a dry cup method that gives the permeance or permeability at a mean relative humidity of 25 % and a wet cup method that gives the permeance or permeability at a mean relative humidity of 75 % (3). A number of technical papers that deal with various technical aspects, limitations and analyses of the experimental data
of these procedures have appeared in the literature (4,5,6). These papers have extended the standard test method to give water vapour permeability as a function of relative humidity. This is the case for many hygroscopic materials, such as wood and wood products. It is to be noted that the water vapour permeability values at different relative humidity levels are derived from a series of dry cup tests with desiccant method at three chamber relative humidity levels, viz. 50%, 70% and 90%, and wet cup measurements with water method at two chamber relative humidity levels, viz. 70% and 90% (5).
Test specimen Low Vap ou r Pressu re Environme n t 1 Environme n t 2 High Vapour Pressure
Figure 1 – Schematic of water vapour transmission across a specimen
Air Permeability
Similar to vapour transmission, air moves through a material from areas of high pressure to areas of low pressure. The air permeability of any building material at unit thickness can be defined as the rate of air movement per unit area per unit of air pressure differential under specified test conditions. The air permeability, ka, is calculated as:
ka = (Ja · t) / (A · Δp) [3]
Where: Ja = Air flow rate across an area A
t = Thickness of the specimen
The air permeability values of building materials have been measured at the National Research Council Canada - Institute for Research in Construction (NRC-IRC) in accordance with a method published by Bomberg and Kumaran (7), which is based on the same principle as outlined in the ASTM Standard C 522, Standard Test Method for Airflow Resistance of Acoustical Materials (8).
Analysis Method
During the past twenty years, researchers at the NRC-IRC have determined the hygrothermal properties of numerous building materials (9,10, 11) that are used for real building envelope constructions in various parts of North America. The air and water vapour permeability properties examined in this paper were taken from these sources.
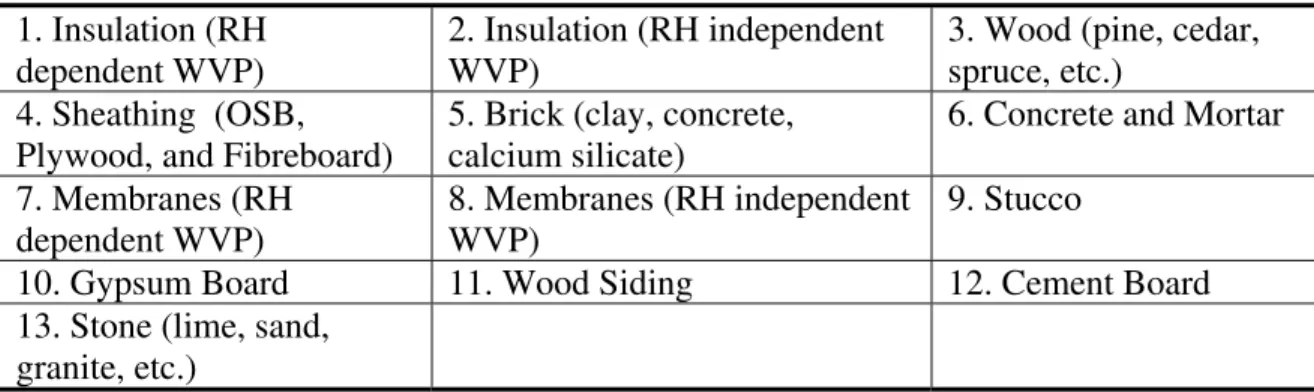
The materials were divided into the following categories in order to take into account the wide variation in material properties (density, pore size, etc.) as much as possible.
Table 1 – Material Categories 1. Insulation (RH
dependent WVP)
2. Insulation (RH independent WVP)
3. Wood (pine, cedar, spruce, etc.)
4. Sheathing (OSB, Plywood, and Fibreboard)
5. Brick (clay, concrete, calcium silicate)
6. Concrete and Mortar 7. Membranes (RH
dependent WVP)
8. Membranes (RH independent WVP)
9. Stucco
10. Gypsum Board 11. Wood Siding 12. Cement Board 13. Stone (lime, sand,
granite, etc.)
As shown in Table 1, the membrane and insulation groups were separated into groups of samples in which water vapour permeability was dependant on relative humidity, and groups of samples (primarily polymeric) in which water vapour permeability was independent of relative humidity. The relationship between air and water vapour permeability was examined for these materials. There were three steps taken in the analysis of the data:
Step I - An examination of the magnitude of the air and water vapour permeability values (for all materials in aggregate) was undertaken. The purpose of this was to identify if there was a general correlation between the transport properties across all material categories.
Step II - Graphs of water vapour permeability vs. air permeability for each category were prepared at relative humidity levels in increments of 10 from 10 to 100 percent.
Step III - The final step was to see if a functional relationship between air permeability and water vapour permeability could be derived for each of the material categories.
Results and Observations
The value of air permeability of the building materials studied ranged from impermeable or immeasurable to 2.9×10⁻⁴
kg.m-1.Pa-1.s-1, while water vapour permeability ranged from 9.5×10⁻¹⁶ to 1.9×10⁻¹⁰
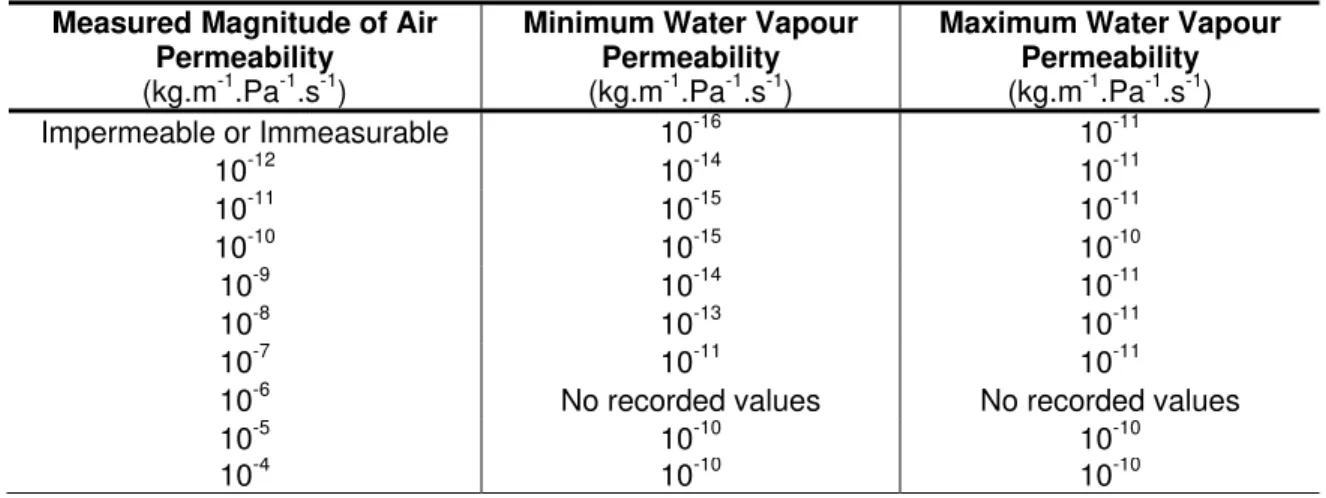
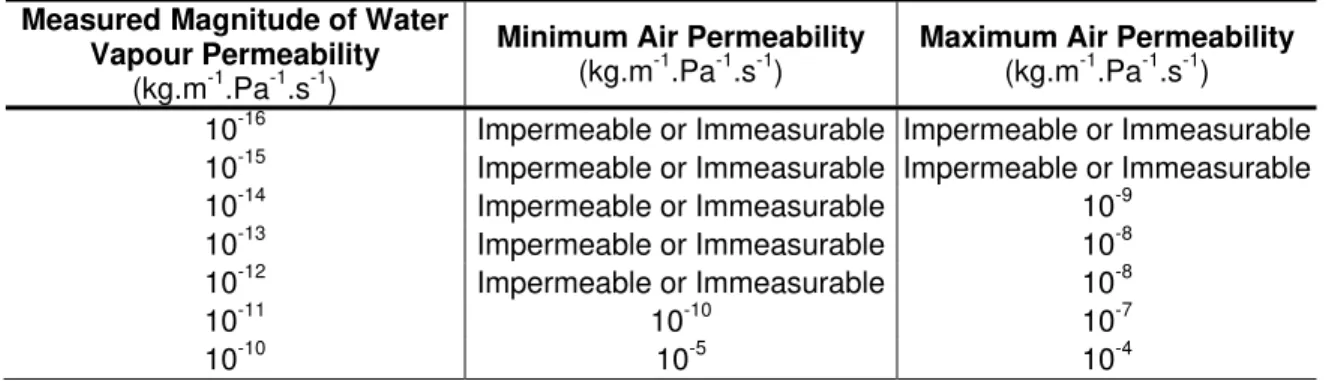
kg.m-1.Pa-1.s-1. Tables 2 and 3 show the general magnitude ranges for both air and water vapour permeability. While reviewing Table 2, it is important to remember that in most cases water vapour permeability increases with relative humidity, and the maximum values given are for 100% relative humidity and the minimums are for 10% relative humidity. Table 3 shows air permeability values corresponding to water vapour permeability values measured at 25% mean relative humidity (i.e. standard dry cup value according to the ASTM Standard E 96/E 96M – 05).
In general, these data show increase in one property leads to an increase in magnitude of the other. That is, an increase in air permeability leads to increasing ranges of water vapour permeability and vice versa. In the next section the authors examine more closely the relationships between water vapour permeability and air permeability properties.
Table 2 – Water vapour permeability values for given air permeability
MeasuredMagnitude of Air Permeability
(kg.m-1.Pa-1.s-1)
Minimum Water Vapour Permeability
(kg.m-1.Pa-1.s-1)
Maximum Water Vapour Permeability (kg.m-1.Pa-1.s-1) Impermeable or Immeasurable 10-16 10-11 10-12 10-14 10-11 10-11 10-15 10-11 10-10 10-15 10-10 10-9 10-14 10-11 10-8 10-13 10-11 10-7 10-11 10-11
10-6 No recorded values No recorded values
10-5 10-10 10-10
Table 3 – Air permeability values for given water vapour permeability at 25% mean relative humidity
MeasuredMagnitude of Water Vapour Permeability
(kg.m-1.Pa-1.s-1)
Minimum Air Permeability
(kg.m-1.Pa-1.s-1)
Maximum Air Permeability
(kg.m-1.Pa-1.s-1) 10-16 Impermeable or Immeasurable Impermeable or Immeasurable 10-15 Impermeable or Immeasurable Impermeable or Immeasurable 10-14 Impermeable or Immeasurable 10-9
10-13 Impermeable or Immeasurable 10-8 10-12 Impermeable or Immeasurable 10-8
10-11 10-10 10-7
10-10 10-5 10-4
Relationship between air and water vapour permeability
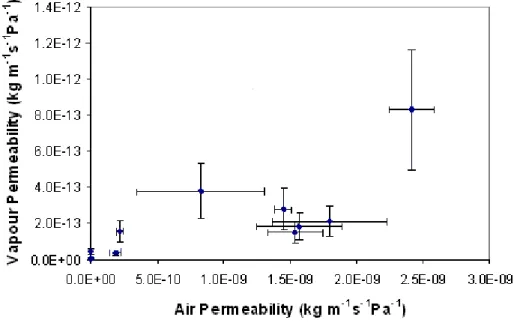
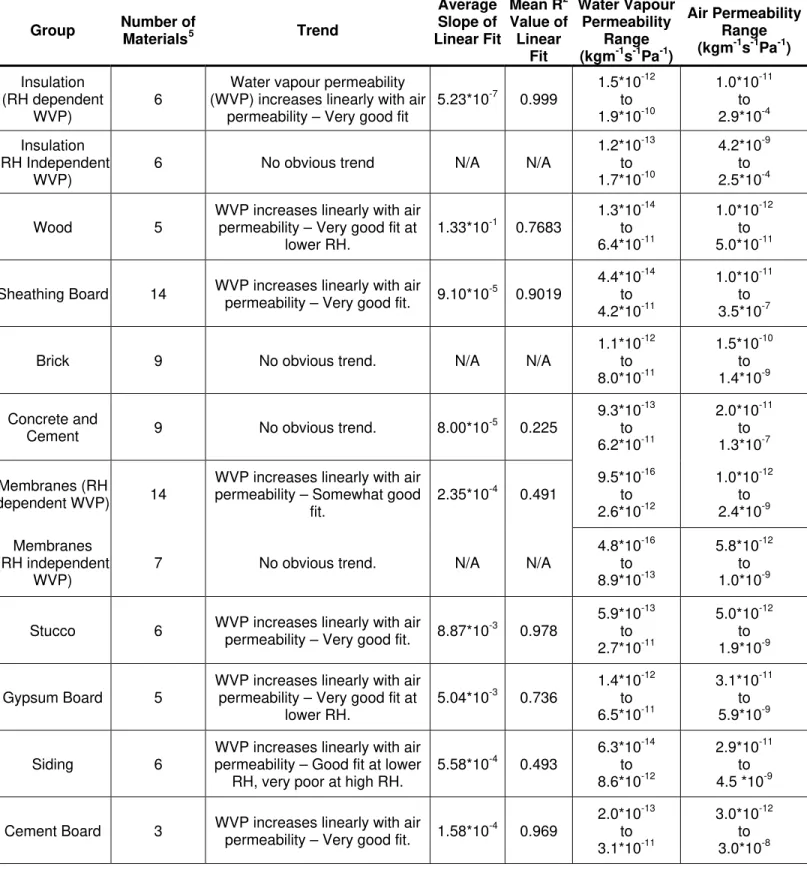
It should be noted that measured permeability values (both vapor and air permeability) for any given material have large variability, although variability generally did not extend across an order of magnitude. The considerable variability in measured values is due, in part, to imperfect repeatability of individual measurements, and in part to variation in property values between specimens of the same material. Figure 2 shows variability in measured water vapor permeability and in measured air permeability for nine membrane materials (each in category 7 in Table 1). The vapor permeability data shown in Figure 2 were for measurements made at 50% mean relative humidity. For each material category, mean values of water vapor permeability were plotted against mean values of air permeability. Figure 3 shows such a plot, specifically a plot for sheathing materials (category 4 in Table 1), with water vapor permeability data points at 30% and 80% relative humidity. The Figure shows calculated regression lines between the two parameters, one for 30% and one for 80% RH. The plotted regressions are linear. It is worth noting that for the data points shown in Figure 3, linear regression fits do not appear ideal, but nonetheless serve as reasonable (and convenient) approximations to the underlying relationships. Linear regressions, like those shown in Figure 3, were calculated for each category of material, at a series of conditions; specifically the regressions were calculated between air permeability and water vapor permeability (WVP) using WVP data at a series of relative humidity levels. Figure 4 shows calculated slopes of the regression equations, over the series of relative humidity levels, for five different material categories. Calculated R2 values for the regression equations, over the series of relative humidity levels, are shown (for eleven material categories) in the two graphs
included in Figure 5. Table 4 summarizes relationships between the two permeability parameters for the 13 material categories listed in Table 1.
Figure 2 – Typical Measurement Uncertainty of Water Vapour Permeability and Air Permeability in Membranes at 50% Relative Humidity
Figure 3 – Linear Fit of Sheathing Water Vapour Permeability and Air Permeability for 30 % and 80 % Relative Humidity
y = 9.39E-05x + 3.79E-13 R2 = 0.9074 y = 9.24E-05x + 3.66E-12 R2 = 0.9047 0.0E+00 5.0E-12 1.0E-11 1.5E-11 2.0E-11 2.5E-11 3.0E-11 3.5E-11 4.0E-11 4.5E-11
0.0E+00 1.0E-07 2.0E-07 3.0E-07 4.0E-07
Air Permeability (kg m-1s-1Pa-1) V a p o u r P e rm e a b ili ty (k g m -1 s -1 Pa -1 ) 30 % 80 %
Figure 4 – Typical Slopes of Linear Fit 1.E-05 1.E-04 1.E-03 1.E-02 1.E-01 1.E+00 10 30 50 70 90 Relative Humidity (%) S lope of Li near F it
Wood Sheathing WRB Membranes
Gypsum Siding
Membranes (RH dependent WVP)
Figure 5 – R2 Values of Linear Fits 0.0 0.1 0.2 0.3 0.4 0.5 0.6 0.7 0.8 0.9 1.0 10 40 70 100 Relative Humidity (%) R 2
Insulation Brick Concrete
Stucco Cement Board Stone
0.0 0.1 0.2 0.3 0.4 0.5 0.6 0.7 0.8 0.9 1.0 10 40 70 100 Relative Humidity (%) R 2
Wood Sheathing WRB Membranes
Gypsum Siding
Membranes (RH dependent WVP)
Table 4 - Summary of Results Group Number of Materials5 Trend Average Slope of Linear Fit Mean R2 Value of Linear Fit Water Vapour Permeability Range (kgm-1s-1Pa-1) Air Permeability Range (kgm-1s-1Pa-1) Insulation (RH dependent WVP) 6
Water vapour permeability (WVP) increases linearly with air
permeability – Very good fit
5.23*10-7 0.999 1.5*10-12 to 1.9*10-10 1.0*10-11 to 2.9*10-4 Insulation (RH Independent WVP)
6 No obvious trend N/A N/A
1.2*10-13 to 1.7*10-10 4.2*10-9 to 2.5*10-4 Wood 5
WVP increases linearly with air permeability – Very good fit at
lower RH. 1.33*10-1 0.7683 1.3*10-14 to 6.4*10-11 1.0*10-12 to 5.0*10-11
Sheathing Board 14 WVP increases linearly with air
permeability – Very good fit. 9.10*10
-5 0.9019 4.4*10-14 to 4.2*10-11 1.0*10-11 to 3.5*10-7
Brick 9 No obvious trend. N/A N/A
1.1*10-12 to 8.0*10-11 1.5*10-10 to 1.4*10-9 Concrete and
Cement 9 No obvious trend. 8.00*10
-5 0.225 9.3*10-13 to 6.2*10-11 2.0*10-11 to 1.3*10-7 Membranes (RH dependent WVP) 14
WVP increases linearly with air permeability – Somewhat good
fit. 2.35*10-4 0.491 9.5*10-16 to 2.6*10-12 1.0*10-12 to 2.4*10-9 Membranes (RH independent WVP)
7 No obvious trend. N/A N/A
4.8*10-16 to 8.9*10-13 5.8*10-12 to 1.0*10-9
Stucco 6 WVP increases linearly with air
permeability – Very good fit. 8.87*10
-3 0.978 5.9*10-13 to 2.7*10-11 5.0*10-12 to 1.9*10-9 Gypsum Board 5
WVP increases linearly with air permeability – Very good fit at
lower RH. 5.04*10-3 0.736 1.4*10-12 to 6.5*10-11 3.1*10-11 to 5.9*10-9 Siding 6
WVP increases linearly with air permeability – Good fit at lower
RH, very poor at high RH.
5.58*10-4 0.493 6.3*10-14 to 8.6*10-12 2.9*10-11 to 4.5 *10-9
Cement Board 3 WVP increases linearly with air
permeability – Very good fit. 1.58*10
-4 0.969 2.0*10-13 to 3.1*10-11 3.0*10-12 to 3.0*10-8 5
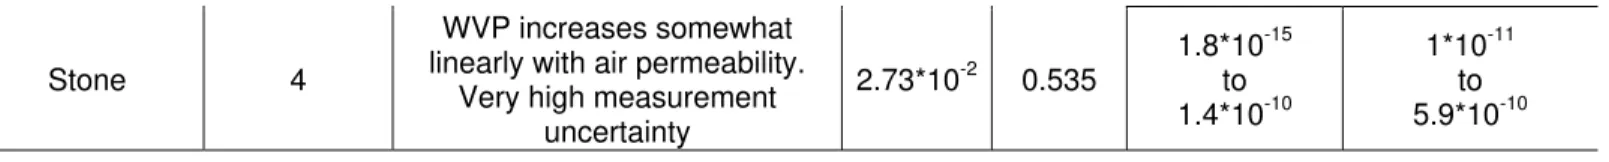
Stone 4
WVP increases somewhat linearly with air permeability.
Very high measurement uncertainty 2.73*10-2 0.535 1.8*10-15 to 1.4*10-10 1*10-11 to 5.9*10-10
Discussion
Figure 4 indicates that although slope values of the regression equations for different material categories are all of positive sign (no indication an inverse relationship between the two permeability properties for any of the materials), the slope values differ for different material categories. This clearly indicates that there is not a functional relationship between water vapor permeability and air permeability that is universally applicable to all building materials. Figure 5 indicates that a functional relationship between water vapor and air permeability exists for materials in some material categories, but that for many material categories, the relationship is weak. Figure 5 moreover indicates that within most material categories the degree to which a relationship between the two permeability measurements holds is not constant across varying levels of relative humidity, but that the relationship typically becomes less well-defined as relative humidity levels increase. As stated previously, Table 4 summarizes relationships between the two permeability parameters for the 13 material categories.
Conclusions and Recommendations
The conclusions of this study were as follows:
1. When materials were segregated into 13 different categories, an approximately linear relationship between water vapor permeability and air permeability was observed within some of the categories. For an approximately equal number of categories however there was no apparent relationship between the two parameters.
2. Within the categories where a relationship between the parameters was apparent, the functional relationship tended to be relatively well-defined at lower relative humidity levels and not as well defined at higher relative humidity levels.
3. Material categories within which there was no apparent relationship between the parameters generally contained materials whose vapor permeability was independent of relative humidity level.
4. There was no universal functional relationship between water vapor permeability and air permeability for building materials commonly used in North America.
References
1. National Building Code of Canada, Issued by the Canadian Commission on Building and Fire Codes, National Research Council of Canada, 2005, Ottawa.
2. Joy F. A. and Wilson, A. G., “Standardization of the Dish Method for Measuring Water Vapor Transmission,” Proceedings of the International Symposium on Humidity and Moisture, Washington, D. C., Vol. 4, Chapter 31, 1963, pp 259-270.
3. ASTM E 96/E 96M, Standard Test Methods for Water Vapour Transmission of Materials, 2005, ASTM International, 100 Barr Harbor Drive, PO Box C700, West Conshohocken, PA, 19428-2959 USA.
4. Hansen, K. K. and Lund, H. B., “Cup Method for Determination of Water Vapor Transmission Properties of Building Materials. Sources of Uncertainty in the Method,” Proceedings of the 2nd Symposium, Building Physics in the Nordic Countries, Trondheim, 1990, pp. 291-298.
5. Lackey, J. C., Marchand, R. G., and Kumaran, M. K., “A Logical Extension of the ASTM Standard E96 to Determine the Dependence of Water Vapor Transmission on Relative Humidity,” Insulation Materials: Testing And Applications: Third Volume, ASTM STP 1320, R. S. Graves and R. R. Zarr, Eds, American Society for Testing and Materials, West Conshohocken, PA, 1997, pp. 456-470.
6. Kumaran, M. K., “An Alternative Procedure for the Analysis of Data from the Cup Method Measurements for Determination of Water Vapour Transmission Properties”, ASTM Journal of Testing and Evaluation, Vol. 26, 1998, pp. 575-581.
7. Bomberg, M.T. and Kumaran, M.K. , ‘A Test Method to Determine Air Flow Resistance of Exterior Membranes and Sheathings’, National Research Council Canada, Building Research Note, Volume: 227, Pages 14, 1985, Report #: BRN-227,
8. ASTM C 522, Standard Test Method for Airflow Resistance of Acoustical Materials, 2003, ASTM International, 100 Barr Harbor Drive, PO Box C700, West Conshohocken, PA, 19428-2959 USA.
9. Kumaran, M.K., Lackey, J., Normandin, N., van Reenen, D., and Tariku, F., ‘A Thermal Moisture and Transport Property Database for Common Building and Insulating Materials’, Final Report from ASHRAE Research Project 1018-RP, Institute for Research in Construction, National Research Council, Ottawa, Canada, February 2004
10. Kumaran, M.K., Lackey, J., Normandin, N., van Reenen, D., and Tariku, F., ‘Summary Report from Task 3 of MEWS Project’, Institute for Research in Construction, National Research Council, Ottawa, Canada, (NRCC-45369), pp. 1-68, March 2002.
11. Mukhopadhyaya, P., Lackey, J., Normandin, N., van Reenen, D., and Tariku, F., A Thermal and Moisture Transport Property Database, Institute for Research in Construction, National Research Council, Ottawa, Canada, July 2004.