Publisher’s version / Version de l'éditeur:
Journal of Neuroscience Methods, 190, 1, pp. 20-27, 2010-06-30
READ THESE TERMS AND CONDITIONS CAREFULLY BEFORE USING THIS WEBSITE. https://nrc-publications.canada.ca/eng/copyright
Vous avez des questions? Nous pouvons vous aider. Pour communiquer directement avec un auteur, consultez la première page de la revue dans laquelle son article a été publié afin de trouver ses coordonnées. Si vous n’arrivez pas à les repérer, communiquez avec nous à PublicationsArchive-ArchivesPublications@nrc-cnrc.gc.ca.
Questions? Contact the NRC Publications Archive team at
PublicationsArchive-ArchivesPublications@nrc-cnrc.gc.ca. If you wish to email the authors directly, please see the first page of the publication for their contact information.
NRC Publications Archive
Archives des publications du CNRC
This publication could be one of several versions: author’s original, accepted manuscript or the publisher’s version. / La version de cette publication peut être l’une des suivantes : la version prépublication de l’auteur, la version acceptée du manuscrit ou la version de l’éditeur.
For the publisher’s version, please access the DOI link below./ Pour consulter la version de l’éditeur, utilisez le lien DOI ci-dessous.
https://doi.org/10.1016/j.jneumeth.2010.04.017
Access and use of this website and the material on it are subject to the Terms and Conditions set forth at
A novel method for inducing focal ischemia in vitro
Richard, Marc J.P.; Saleh, Tarek M.; El Bahh, Bouchaib; Zidichouski, Jeffrey
A.
https://publications-cnrc.canada.ca/fra/droits
L’accès à ce site Web et l’utilisation de son contenu sont assujettis aux conditions présentées dans le site LISEZ CES CONDITIONS ATTENTIVEMENT AVANT D’UTILISER CE SITE WEB.
NRC Publications Record / Notice d'Archives des publications de CNRC:
https://nrc-publications.canada.ca/eng/view/object/?id=15033957-de07-40e4-9d7e-285d426ce10b
https://publications-cnrc.canada.ca/fra/voir/objet/?id=15033957-de07-40e4-9d7e-285d426ce10b
Contents lists available atScienceDirect
Journal of Neuroscience Methods
j o u r n a l h o m e p a g e :w w w . e l s e v i e r . c o m / l o c a t e / j n e u m e t hA novel method for inducing focal ischemia in vitro
Marc J.P. Richard
a, Tarek M. Saleh
a,∗, Bouchaib El Bahh
b, Jeffrey A. Zidichouski
a,b aDepartment of Biomedical Science, Atlantic Veterinary College, University of Prince Edward Island, Charlottetown, PE, Canada, C1A 4P3 bInstitute for Nutrisciences and Health, National Research Council of Canada, Charlottetown, PE, Canada, C1A 4P3a r t i c l e
i n f o
Article history:
Received 16 February 2010
Received in revised form 15 April 2010 Accepted 15 April 2010 Keywords: Stroke Penumbra Anoxic depolarization Electrophysiology
a b s t r a c t
Current in vitro models of stroke involve applying oxygen-glucose deprived (OGD) media over an entire brain slice or plate of cultured neurons. Thus, these models fail to mimic the focal nature of stroke as observed clinically and with in vivo rodent models of stroke. Our aim was to develop a novel in vitro brain slice model of stroke that would mimic focal ischemia and thus allow for the investigation of events occurring in the penumbra. This was accomplished by focally applying OGD medium to a small portion of a brain slice while bathing the remainder of the slice with normal oxygenated media. This technique produced a focal infarct on the brain slice that increased as a function of time. Electrophysiological record-ings made within the flow of the OGD solution (“core”) revealed that neurons rapidly depolarized (anoxic depolarization; AD) in a manner similar to that observed in other stroke models. Edaravone, a known neuroprotectant, significantly delayed this onset of AD. Electrophysiological recordings made outside the flow of the OGD solution (“penumbra”) revealed that neurons within this region progressively depolar-ized throughout the 75 min of OGD application. Edaravone attenuated this depolarization and doubled neuronal survival. Finally, synaptic transmission in the penumbra was abolished within 50 min of focal OGD application. These results suggest that this in vitro model mimics events that occur during focal ischemia in vivo and can be used to determine the efficacy of therapeutics that target neuronal survival in the core and/or penumbra.
© 2010 Elsevier B.V. All rights reserved.
1. Introduction
During an occlusive stroke, blood flow and critically impor-tant supplies of oxygen, glucose, and key nutrients to an area of the brain is blocked. In the context of this ischemic event, neu-rons receiving blood supply from this vessel begins to die due to processes mediated by the ischemic cascade (Lipton, 1999; Brouns and De Deyn, 2009). This initial area of neuronal death is focal in nature and is termed the “core” region and recovery of affected cells in this region is negligible and thought to be non-existent (Beilharz et al., 1995). As neurons within the core region die primarily via necrosis, they release their intracellular contents which diffuse into the surrounding extracellular space. This disrup-tion in ionic equilibrium, combined with the continued hypoxia and hypoglycemia, leads to a secondary stage of neuronal dam-age that progressively spreads to neurons located adjacent to, and well outside of, the core region (Lipton, 1999; Zheng et al., 2003; Brouns and De Deyn, 2009). This region is called the “penumbra” and is characterized by metabolic arrest, cellular stress and even-tual death of neurons primarily via apoptosis (Astrup et al., 1981; Hossmann, 1994; Lipton, 1999). Together, the core and penumbra
∗ Corresponding author. Tel.: +1 902 566 0819; fax: +1 902 566 0832.
E-mail address:tsaleh@upei.ca(T.M. Saleh).
continue to grow in volume as long as the ischemia is main-tained.
There is great interest in using stroke models to study and search for compounds capable of reducing the rate at which dam-age spreads subsequent to a focal ischemic insult (Durukan and Tatlisumak, 2007). However, in order to efficiently characterize such compounds, it is desirable to have a model that allows researchers to rapidly determine efficacy as well as to determine mechanism of action of the compounds. The most common mod-els currently used in stroke research include: in vivo focal ischemia models (Weng and Kriz, 2007; Saleh et al., 2009), in vitro dissociated cell models (Larsen et al., 2005; Ye et al., 2009) and in vitro brain slice models (Garcia de Arriba et al., 1999; Jarvis et al., 2001). In vivo focal ischemia models (whole animal models) are used extensively to study stroke and involve invasive surgery to expose and occlude a cerebral artery (Saleh et al., 2009). Although these in vivo models are the most physiologically accurate, they have a very low throughput, are technically demanding, and require the use of large numbers of animals, all of which results in a very high cost per data point (Graham et al., 2004). As well, using this type of model, it is difficult to determine the mechanism of action of therapeutic interventions. The use of in vitro models where oxygen-glucose deprivation (OGD) is used to mimic stroke (Jarvis et al., 2001; Wise-Faberowski et al., 2009; Ye et al., 2009) overcomes many of these problems. Of the in
vitro models, the dissociated cell models are popular for screening
0165-0270/$ – see front matter © 2010 Elsevier B.V. All rights reserved. doi:10.1016/j.jneumeth.2010.04.017
due to their high throughput, low cost and ease of use. Unfor-tunately, these models are also the least physiologically accurate because the cells are dissociated through enzymatic and mechan-ical treatments and hence are not at all similar to being in their normal environment. Consequently, neurons in culture lack nor-mal synaptic contacts and interactions with other neurons as well as with other cerebral cell types (i.e. glial cells;Lossi et al., 2009). The in vitro brain slice model may be lower throughput than the cell culture model, however, it is far more physiologically accurate. Within each slice, cytoarchitecture is maintained and thus many of the cell-to-cell interactions and neuronal networks remain intact (Gahwiler et al., 1997; Noraberg et al., 2005; Lossi et al., 2009). Hence, this model is well suited for physiological experiments to assess mechanism of action of drugs as well as to study neurophys-iological changes that occur with stroke.
One limitation of current in vitro slice models of stroke is that OGD media is applied to the entire brain slice and thus all of the cells in the slice are subject to the same ischemic condition (Jarvis et al., 2001; Wise-Faberowski et al., 2009). This is referred to as global ischemia and thus the entire slice is representative of the “core”. Although these models are used to characterize ischemia-induced neuronal death (Martínez-Sánchez et al., 2004) and have utility in identifying compounds that are neuroprotective (Lipski et al., 2007) or toxic (Bonde et al., 2003), they do not mimic the focal nature of stroke or the ability to study the events that occur within the penumbra. Consequently, using the existing global models, it is difficult to properly characterize the processes involved in the spread of cell death from the core to adjacent healthy tissue. Since, clinically speaking, the majority of strokes are focal in nature, there remains a need for a reliable in vitro focal ischemic model. Thus, our aim was to develop a novel in vitro brain slice model of stroke that would mimic focal ischemia and thus allow us to study events occurring within the penumbra.
2. Materials and methods
All experiments were carried out in accordance with the guide-lines of the Canadian Council on Animal Care and under an approved protocol by the University of Prince Edward Island Animal Care Committee.
2.1. Brain slice preparation
In vitro focal ischemia studies were performed on freshly
pre-pared rat brain slices. Methods for preparing the brain slices were similar to those previously published (Saleh et al., 1997). Briefly, male Sprague-Dawley rats (100–125 g; Charles River, Montreal, PQ, Canada) were anaesthetized with isoflurane vapour (IsofloTM;
Abbott Laboratories, Saint-Laurent, PQ) and then decapitated. Brains were rapidly removed and immersed in ice-cold (2–3◦C)
artificial cerebrospinal fluid (aCSF) of the following composition (in mM): 145 NaCl, 2.5 KCl, 10 d-glucose, 26 NaHCO3, 1.2 NaH2PO4,
1.3 MgCl2, 2.5 CaCl2(pH 7.4, osmolarity of 295–305 mOsmol/L,
con-tinuously bubbled with 95% O2 and 5% CO2). The brain was then
mounted in a vibratome (VT 1000S, Leica) and cut coronally into 400 m thick slices while submersed in ice-cold aCSF. Prior to the initiation of experiments, slices were incubated for at least 1 h in aCSF at room temperature.
2.2. Brain slice experimental conditions
For experimentation, an individual slice was transferred to an experimental chamber and viewed under low magnification using an upright microscope (BX51WI, Olympus Canada Inc., Markham, ON, Canada). aCSF was superfused at 3 mL/min and the bath tem-perature was continuously monitored and maintained at 34 ± 1◦C
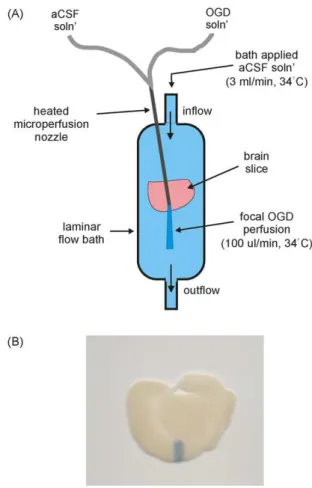
Fig. 1. Experimental design of the in vitro focal ischemia model. (A) Representative drawing of the experimental setup. (B) Chicago sky blue tissue stain was focally applied to the cortex of a brain slice. The dark band on the slice represents the area of focal solution application. (For interpretation of the references to color in this figure legend, the reader is referred to the web version of the article.)
using a temperature control unit (TC-344B, Warner Instruments, Hamden, CT, USA). Bath level was controlled and perfusate was removed via a suction tube located at the opposite end to the inflow of the chamber. The slice was suspended on a mesh insert placed within the bath and was secured in place by a slice anchor hold-down apparatus (thin wire loop with fine thread spaced approximately 1 mm apart). Subsequent to a 30 min equilibration period, drugs were added to the bath solution to allow for pre-treatment. Drugs were also added to the bath and focal perfusion solutions throughout the experiment.
2.3. Focal OGD application
In order to mimic in vivo focal ischemia in the present in vitro system, OGD medium was focally applied to a small area (0.5–1 mm wide) of the cortex within a prefrontal brain slice. The composition of this OGD medium was the same as that of the aCSF solution except for the following two variables: (1) glucose was excluded and replaced with 10 mM d-mannitol and (2) oxygen was displaced (verified using an O2sensing electrode) from this media by bubbling
continuously with 95% N2and 5% CO2. The experimental setup used
to achieve focal perfusion is illustrated inFig. 1A. A microperfu-sion system driven by syringe infumicroperfu-sion pumps (Physio 22 pump, Harvard Apparatus, Holliston, MA, USA) was used to deliver aCSF or OGD solution. The nozzle of the microperfusion system was made from a 23 gauge stainless steel tube and was mounted to a micromanipulator in order to ensure accurate placement. Using the micromanipulator, the nozzle was lowered until it was just above the surface of the slice (at an angle of approximately 30◦). A heating
Fig. 2. Tissue death caused by focal application of OGD solution (A–C). Representative digital scans of coronal brain sections illustrating the effects of focal perfusion of different solutions. Slices are TTC stained in order to assess slice viability. (A) Oxygenated aCSF solution was focally applied to the slice for 2 h in order to ensure that focal solution application was not damaging the tissue. (B) 1 h focal application of OGD solution. The white band on the cortex indicates the region of cell death caused by focal ischemia. (C) 2 h focal OGD application. (D) Graphic representation of infarct area caused by focal application of aCSF for 2 h (n = 3), OGD solution for 2 h (n = 3) and OGD solution for 2 h (n = 3). Each data point represents mean ± SEM and (*) indicates significant difference (p < 0.05) from the aCSF group. (**) indicates significant difference (p < 0.05) from the 1 h OGD perfusion group.
element connected to a heat controller (TC-344B, Warner Instru-ments, Hamden, CT, USA) was attached near the end of the nozzle in order to warm the focally applied media to 34 ± 1◦C. This
temper-ature has been determined to be optimal for stability of recording in whole cell configuration (Saleh et al., 1997). The optimal rate of focal solution application that did not disrupt the laminar flow of the bath was determined to be 100 L/min.
In order to minimize mixing of the OGD media with the sur-rounding aCSF media, the flow of solution within the bath had to be laminar. Laminar flow was confirmed by microperfusing a stain, Chicago sky blue, into the bath. Microperfusion of Chicago sky blue onto the brain slice was also used to determine the area of the focal solution application (dark area inFig. 1B).
Following focal solution application, slices were incubated in a 2% solution of 2,3,5-triphenol tetrazolium chloride (TTC; Sigma–Aldrich; St. Louis; MO, USA) for 10 min at 37◦C. TTC is a
mitochondrial oxidative enzyme stain and thus healthy tissue will stain and appear red (dark areas inFig. 2A–C) while dead tissue will appear white (light areas inFig. 2B and C;Vivaldi et al., 1985). Immediately following staining, the slices were placed in 10% for-malin in order to arrest the staining and preserve the slice for scanning and digital imaging.
2.4. Electrophysiological experiments
‘Blind” whole-cell patch-clamp recordings (Blanton et al., 1989) were performed on cortical neurons using a MultiClamp 700B amplifier with CV-7B head stage (Axon Instruments, Union City, CA, USA). Patch pipettes (5–8 M; KG-33; Garner Glass Co., Clare-mont, CA, USA) were pulled with a Flaming–Brown micropipette puller (Model P-87; Sutter Instruments Co., Novato, CA, USA). Patch
pipette filling solution consisted of the following (in mM): 130 K-gluconate, 6 NaCl, 10 HEPES, 2.5 Na-ATP, 0.1 Na-GTP; pH 7.3 with KOH, osmolarity of 285–295 mOsmol/L. Before breaking into the cell with suction, fast electrode capacitance was compensated. Electrophysiological criteria for a neuron to be used in an exper-iment were based on their excitability, having a starting resting membrane potential (RMP) more negative than −60 mV, and an access resistance ranging between 15 and 35 M. Data acquisition and analysis were performed using Clampex and Clampfit 9.2 soft-ware, respectively (Axon Instruments, Union City, CA, USA). All data were acquired at a sampling rate of 10 kHz.
In experiments where changes to membrane potential were measured, neurons were current clamped (I = 0) and continuous recordings were made using Pclamp’s gap-free mode. In other experiments to investigate the effect of OGD on neurotransmission, excitatory post-synaptic currents (EPSCs) were recorded as inward currents from voltage clamped neurons (Vh= −65 mV). EPSCs were
evoked using an ISO-Flex stimulus isolator (A.M.P.I., Jerusalem, Israel) connected to a matrix tungsten electrode (FHC Inc., Bow-doin, ME, USA) placed in layer 2 of the cortex. Recordings were made from neurons in layer 5 of the cortex adjacent to the stimu-lating electrode. All cells had a graded evoked response to increased stimulus intensity, and an intensity giving a 70–80% of the maxi-mum evoked synaptic response was used to evoke test responses. Each stored trace was an average of 4 successive synaptic responses elicited at 30 s intervals, yielding one averaged response per 2 min.
2.5. Data analysis and statistics
Brain slices were digitally imaged using a flatbed scanner (Canon, CanoScan 4400F) with a resolution of 1900 dpi and
quantification of infarct area was accomplished using a computer-assisted imaging system (ImageJTM, National Institutes of Health).
Membrane potential was measured every 2 min and was taken as an average over 10 s. EPSC amplitudes (at Vhof −65 mV) were
mea-sured from baseline to peak. Percentage changes in EPSC amplitude were calculated by dividing the amplitude of each response by the averaged baseline response multiplied by 100 then subtracting 100. All data are presented as mean ± standard error of the mean (SEM). Unless stated otherwise, differences between treatment groups at identical time points were determined using two-way ANOVA followed by a Student–Newman–Keul’s post hoc test. Dif-ferences in latency of anoxic depolarization between treatment groups were determined using an unpaired Student’s t-test. Statis-tics were performed using SigmaStat software (Systat Software Inc., San Jose, CA, USA). In all cases, differences were considered signifi-cant if p ≤ 0.05 and (n) represents the number of recorded cells that were included in the study. Only one cell was recorded from within each slice.
2.6. Drugs and solutions
All laboratory salts were purchased from Fisher Scientific Canada (Ottawa, ON, Canada). Edaravone, TTC and Chicago blue were purchased from Sigma–Aldrich Canada Ltd (Oakville, ON, Canada). Stock solution of edaravone was made up in dimethylsul-foxide (DMSO) and aliquots of this stock were added to the bath and microperfusion solutions to the final concentrations indicated. Sol-vent controls were performed when necessary. TTC was dissolved in phosphate buffered saline solution and made fresh daily. Chicago blue was dissolved in aCSF.
3. Results
3.1. Tissue death caused by focal application of OGD solution
Our first objective was to determine if focal application of OGD solution to a small area of the cortex would result in a focal area of cell death that increased in size as a function of time. The results of this experiment are presented inFig. 2. First, in order to ensure that focal solution application did not mechanically damaging the tissue; slices were focally perfused with oxygenated aCSF solution for 2 h. This did not produce any measurable damage to the tissue (n = 3;Fig. 2and D). In separate experiments, OGD solution was focally applied to the slice for 1 (Fig. 2B) or 2 h (Fig. 2C). Following the 1 h OGD microperfusion, the area of tissue damage (determined by the area of the white band on the TTC stained slice) was signif-icantly larger than that of the aCSF treated group (1.3 ± 0.5 mm2,
n = 3, p < 0.05; Fig. 2B and D). Following a 2 h OGD microperfu-sion, the area of tissue damage was significantly larger than that of both the aCSF treated group and the 1 h OGD perfusion group (3.1 ± 0.5 mm2, n = 3, p < 0.05;Fig. 2C and D), indicating growth of
the infarct over time.
3.2. Effect of focal OGD application on neuronal membrane potential in the core region
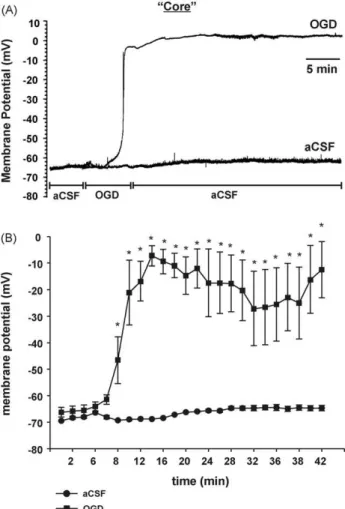
Previous studies have examined the electrophysiological changes that occur within the core region of a focal ischemic insult or within tissue exposed to global ischemia (Tanaka et al., 1997; Niiyama et al., 2005). These studies consistently demonstrate that within a few minutes after the onset of ischemia, neurons undergo a rapid depolarization (anoxic depolarization, AD). To determine if these results could be mimicked using our model, electrophysio-logical recordings were taken from within the region of focal OGD application (“core”;Fig. 3). Cells were recorded in current clamp
Fig. 3. This model mimics the “core” region of focal ischemia. Following baseline recordings in aCSF, OGD solution was focally perfused until the neuron depolarized. Then, the solution was switched back to aCSF for the remainder of the experiment. For control experiments aCSF solution was applied during the entire experiment. (A) Representative intracellular recordings of membrane potential obtained from corti-cal neurons within the region of the focorti-cal perfusion. (B) Graphicorti-cal representation of changes in membrane potential over time when recorded within the region of focal application of OGD (n = 7) or aCSF (n = 3). Each data point represents mean ± SEM and (*) indicates significant difference (p < 0.05) between the treatment groups at the same time points.
mode and their RMP was continuously monitored. At the begin-ning of the experiment, the average RMP for all cells recorded was −69 ± 9 mV (n = 10). Following a 5 min baseline recording of RMP in aCSF, focal perfusion of OGD solution caused a large and significant increase (depolarization) in RMP of neurons to −6 ± 7 mV, n = 7;
p < 0.05,Fig. 3B when compared to RMP of neurons maintained in aCSF for the duration of the experiment (n = 3). This depolarization was characteristic of AD. The latency (time to onset) of this AD was 5.8 ± 1.5 min (n = 7,Fig. 4C). Switching of the focal perfusate back to aCSF immediately following AD did not cause any significant recovery of RMP within 30 min.
Next, we wanted to determine if electrophysiological responses recorded from the core region could be modified pharmacologi-cally. To test this, slices were preincubated, and then perfused with different concentrations of the antioxidant edaravone, which has known neuroprotective properties (Yoshida et al., 2006; Lee et al., 2010). As before, cells were recorded in current clamp mode and their RMP was monitored. Although edaravone (100 M) did not prevent AD caused by focal OGD application, it did significantly enhance the repolarization (recovery) following AD when com-pared to the OGD (no drug) group (to −59 ± 9 mV, p < 0.05, n = 6,
Fig. 4. The effect of OGD within the core can be modulated by neuroprotectants. (A) Representative intracellular recordings of membrane potential obtained from cortical neurons within the region of focal perfusion of OGD solution, aCSF solu-tion, or OGD solution + 100 M edaravone. The protocol was the same as that in
Fig. 2. (B) Graphical representation of changes in membrane potential over time when recorded within the region of focal application of OGD solution (n = 7), aCSF (n = 3), OGD solution + 30 M edaravone (n = 5) or OGD solution + 100 M edaravone (n = 6). Each data point represents mean ± SEM and (*) indicates significant differ-ence (p < 0.05) from the OGD group. (C) Graphical representation of changes in latency (time to onset) of AD when recordings were made within the region of focal application of OGD, OGD + 30 M edaravone or OGD + 100 M edaravone. Each data point represents mean ± SEM and (*) indicates significant difference (p < 0.05) from the OGD group.
Fig. 4A and B). 100 M edaravone also significantly increased the latency of the AD (time to onset and time to peak depolarization) when compared to the OGD (no drug) group (8.6 ± 0.9 min, p < 0.05,
n = 6,Fig. 4A and C). The effect of edaravone was dose-dependent as lower concentrations of edaravone (30 M) did not significantly decrease the OGD-induced change in RMP (to −48 ± 12 mV, n = 5,
Fig. 4B) or latency (6.9 ± 1.2 min, n = 5,Fig. 4C) following AD (com-pared to the OGD (no drug) group). These data suggest that this model can mimic the physiological changes that occur in the core region of focal ischemia and can be used to evaluate compounds targeted at modulating these changes.
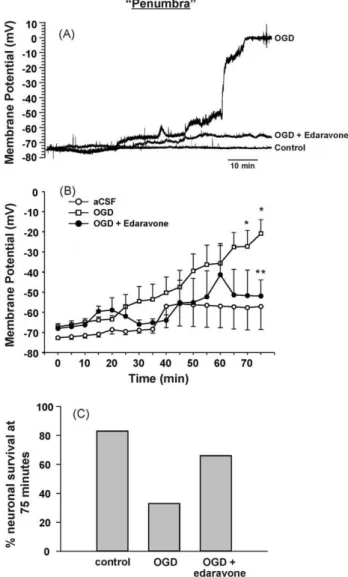
Fig. 5. This model also mimics the “penumbra” region of focal ischemia. Intra-cellular recordings of membrane potential were obtained from cortical neurons adjacent to the region of focal OGD perfusion (approximately 0.9 mm from focal per-fusion). (A) Representative recordings demonstrating the effects of focally applied aCSF, OGD solution or OGD solution + 100 M edaravone on the membrane poten-tial of neurons outside the region of focal perfusion. (B) Graphical representation of the changes in membrane potential over time when recorded outside the region of focal perfusion of aCSF (n = 6), OGD solution (n = 12) or OGD solution + 100 M edaravone (n = 6). Each data point represents mean ± SEM. (*) indicates significant difference from the aCSF group (p < 0.05) and (**) indicates significant difference from the OGD group (p < 0.05). (C) Percentage of neurons recorded from within the penumbra that was still viable at the end of the 75 min experiment for the different groups. Neurons were considered non-viable if they became irreversibly depolarized to approximately 0 mV.
3.3. Effect of focal OGD application on membrane potential and neuronal function in the penumbra region
The next series of experiments were designed to determine if this model could be used to elicit measurable physiological changes in areas of the brain slice outside the focal flow of OGD. If so, this would suggest that neuronal damage initiated within the region exposed to focal OGD flow (“core”) could spread to healthier sur-rounding tissue (“penumbra”) similar to that observed in vivo. In these experiments, electrophysiological recordings were taken from the region adjacent to the location of the focal OGD perfu-sion (approximately 0.9 mm away;Fig. 5). Cells were recorded in current clamp mode and their RMP was monitored. At the end of a 5 min baseline period where aCSF was focally perfused, the
average RMP for all cells recorded was −70 ± 5 mV (n = 23). When aCSF solution was focally applied for the remaining 70 min of the experiment, RMP did not change significantly (−60 ± 12 mV; n = 6;
Fig. 5B). However, when OGD solution was focally applied, RMP in the penumbra progressively increased (marked depolarization) over time, and by 75 min had become significantly different com-pared to the aCSF group (−21 ± 12 mV; n = 12; p < 0.05). Next, in order to determine if this electrophysiological response within the penumbra could be modulated by a neuroprotectant, slices were perfused with 100 M edaravone. In the presence of edaravone, focal OGD application increased RMP of cells in the penumbra to only −56 ± 15 mV by the end of the experiment (n = 6), which was not significantly different than that of the aCSF group, but was sig-nificantly lower than that of the non-treated OGD group (p < 0.05).
Fig. 5C shows the percentage of neurons recorded from within the penumbra that were still viable (able to elicit an action potential) at the end of the 75 min time point for the different groups. Neurons were considered non-viable if they became irreversibly depolarized to approximately 0 mV. When aCSF was applied throughout the experiment, 80% of the neurons recorded from remained viable (4 of 5 cells). In comparison, when OGD was focally applied, only 33% of neurons recorded from within the penumbra remained viable (4 of 12 cells). The addition 100 M edaravone doubled neuronal survival in the penumbra following focal OGD application (66%, 4 of 6 cells). These data suggest that this technique can be used to record neuronal changes in the region adjacent to the core and is thus a real-time in vitro model of an ischemic penumbra. Further, this model can be used to test compounds targeted at reducing the rate of progression of cell death or stress in the penumbra region.
3.4. Effect of OGD application on synaptic function in the core or penumbra
In order to determine the effect of focal OGD application on the synaptic function of neurons within the core or penumbra (approximately 0.9 mm away from the microperfuser), EPSCs were recorded. When aCSF was perfused for the duration of the exper-iment, EPSC amplitude in either the core or penumbra did not significantly change over the duration of the experiment, increas-ing 8 ± 8% after 50 min post-baseline (n = 3;Fig. 6A and D). When OGD solution was focally applied, the amplitude of EPSCs recorded outside the microperfusion flow (penumbra) gradually decreased throughout the experiment (Fig. 6B and D). By 24 min, EPSC ampli-tude was decreased by 42 ± 11% and by 50 min the EPSC ampliampli-tude was decreased by 70 ± 8% of the control EPSC amplitude. Again temporal aspects of the OGD microperfusion were monitored and we found the reduction of EPSC amplitude to become significantly different from control after 26 min post-baseline (55 ± 10%; n = 5;
p < 0.05). In comparison, EPSCs recorded directly within the flow
of OGD solution (core) decreased in amplitude much more rapidly (Fig. 6C and D) within a few minutes of initiation of OGD application. Under these conditions, the EPSC amplitude became significantly attenuated compared to baseline after 6 min (70 ± 5%, n = 3, p < 0.05) and by 24 min EPSC amplitude was already decreased by 85 ± 5%.
4. Discussion
In this study we present a novel in vitro brain slice model of stroke that mimics focal ischemia by focally applying OGD solution to a small portion of the brain slice, thus modeling the occlusion of a cerebral blood vessel and initiation of a focal stroke. Using this novel technique, we were successful in producing a focal infarct within the brain slice and a subsequent region of neuronal death that increased as a function of time.
Fig. 6. Focal OGD application affects function of neurons outside the flow. EPSCs were evoked and recorded either from the region adjacent to the focal perfusion (approximately 0.9 mm away) or from the region within the focal perfusion. (A) Representative recordings at 0, 24, and 50 min following baseline of EPSCs recorded outside the region of focal perfusion of aCSF (penumbra (aCSF); (B) outside the region of focal perfusion of OGD solution (penumbra (OGD); (C) inside the region of focal perfusion of OGD solution. (D) Graphical representation of changes in EPSC ampli-tudes over time when recorded outside the region of focal perfusion of aCSF (n = 3), outside the region of focal perfusion of OGD solution (n = 5) and inside the region of focal perfusion of OGD solution (n = 3). Each data point represents mean ± SEM and (*) indicates significant difference (p < 0.05) from baseline amplitude. Statistics were performed using a one-way ANOVA.
The major disadvantage of current in vitro ischemic models is that OGD solution is applied to the entire tissue (slice or cultured neurons) thus mimicking a global, rather than a focal ischemic event (Garcia de Arriba et al., 1999; Jarvis et al., 2001; Lipski et al., 2007). It can be argued that these models mimic the events that occur within the core region of a stroke but not the events that occur in the penumbra that still has a supply of both oxygen and glucose as compared to the core region. To our knowledge, there are currently no other in vitro models that reproduce focal ischemia, however, there are in vitro models that are designed to repre-sent only the penumbra. Recently,Datta et al. (2010)presented an in vitro model of ischemic penumbra in which they used the rat B104 neuroblastoma cell line. Briefly, these researchers exposed the entire neuronal preparation (cultured neurons) to global OGD for varying durations and showed that a time point of 4 h resulted in cells that were stressed but not irreversibly damaged. As discussed previously, because OGD was applied globally for extended periods of time, this model may more accurately reflect the early cellu-lar events occurring within the core rather than in the penumbra. Other penumbra models are based around the popular hypoth-esis that neuronal damage within the penumbra is propagated by inflammatory responses (microglia activation) initiated from within the ischemic core (Wood, 1995; Schilling et al., 2003). Hence, there are several models which mimic these responses by stimulat-ing microglia, co-cultured with neurons, with exogenously applied chemical activators (Xie et al., 2002; Fordyce et al., 2005).
Criti-cisms of these models are, first, that the chemical activators that are used are normally not present during stroke (e.g. lipopolysac-charide, which is a bacterial endotoxin), and second, it is unlikely that damaged neurons within the core produce only a single acti-vating molecule, but rather a complex mixture of molecules capable of activating microglia (Kaushal and Schlichter, 2008). In order to improve on these models,Kaushal and Schlichter (2008)designed a penumbra model which involves activation of cultured microglia by OGD-stressed cultured neurons. These activated microglial cells are then co-cultured with healthy neurons to determine the detri-mental impact on these neurons. An advantage of this model is that microglia are activated by one or more molecules actually released during ischemia-induced neuronal death, making this model more relevant to the ischemic penumbra. Despite these improvements, a limitation to this model is that it uses cultured neurons and microglia. Hence, this preparation is far removed from how neu-rons and glial cells are anatomically organized, interconnected, and function in their normal environment. As well, in this model, microglia are never exposed to the ischemic conditions as would be the case in vivo.
Using a slice of brain tissue, as in the model proposed here, overcomes the disadvantages described above and has the added advantage of being used in conjunction with electrophysiologi-cal techniques (Gahwiler et al., 1997; Lossi et al., 2009). In this way, we were able to measure, in real-time, changes in membrane potential (i.e. spreading depression and/or anoxic depolarization) and changes in synaptic transmission within the ischemic core or penumbra at different distances from the ischemic core. Using this focal ischemic slice model, we demonstrated that within the region of focal OGD application, neurons underwent anoxic depolarization within 10 min of the onset of ischemia. As well, we demonstrated that synaptic transmission within this region was rapidly abolished within a few minutes of OGD treatment. This latency to AD is con-sistent with what has been observed in vivo (Hansen, 1978) as well as with observations from in vitro studies where OGD was applied globally (Niiyama et al., 2005). Hence, our findings suggest that the focal infarct achieved with our model accurately reflects the core region of a stroke.
When electrophysiological recordings were made from the region surrounding the core, we observed that the latency to AD greatly increased compared to when recordings were made from neurons within the core region. Additionally, synaptic transmis-sion was maintained for a greater length of time in the penumbra (25–30 min) compared to the rapid decline observed in the core (within 5–6 min of ODG). These findings confirm that neuronal damage originating within the core spreads with time to the sur-rounding healthier tissue, characteristic of the pathophysiology of focal ischemia in vivo.
The present results also demonstrate that neurons located slightly less than 1 mm away from the core region took approxi-mately 1 h to depolarize. This rate is much slower than the onset of AD in other studies using in vitro slice models (Jarvis et al., 2001; Joshi and Andrew, 2001) reported at 2 mm/min. A possible expla-nation for this is that in those studies the entire slice was exposed to OGD solution for the duration of the experiment. Thus, although the spreading depolarizations (AD) originated from focal points, they spread through tissue that was already compromised by ischemic conditions. In comparison, in our model, depolarizations initiated within the core had to spread through otherwise healthy surround-ing tissue which may account for their slower rate. On the other hand, in vivo, AD propagation has also been shown to be around 1–2 mm/min (Somjen, 2001; Chuquet et al., 2007), which is much quicker than with our in vitro model. In vivo the region surrounding the core of a stroke continues to be perfused with blood; however, this perfusion is limited, thus stressing the tissue. In comparison, in our model, the region outside the focal OGD application is
per-fused with normal, oxygenated aCSF solution. Consequently, the neurons outside our focal OGD flow may be less stressed than neu-rons located adjacent to the core in vivo, which may explain the slower propagation of depolarization in our model.
Edaravone is a strong free radical scavenger which clinically has been shown to significantly decrease infarct volume and pro-duce sustained benefits in functional outcomes (Tsujita et al., 2004; Yoshida et al., 2006). Due to this proven effectiveness, we used edar-avone as a positive control to validate our method by attempting to modulate the spread of AD. In our electrophysiological experi-ments in both the core and the penumbra regions, we demonstrated that edaravone significantly delayed the onset and decreased the amplitude of depolarization caused by the focal OGD application in a concentration dependent manner. Therefore, these data vali-date our model and confirm that the model is sensitive enough to screen for potential therapeutic compounds. Furthermore, because this model supports electrophysiological studies, it may be used to help screen and determine the mechanism of action of potential therapeutic compounds.
There are other applications for the current model. Following a stroke, initial treatment is aimed at restoring blood flow to the ischemic region. Unfortunately, reperfusion in itself can be very damaging to tissue, especially neuronal tissue (Shi and Liu, 2007). This process is referred to as reperfusion injury and it is not com-pletely understood. Using our model, OGD solution can be focally applied to mimic a focal stroke, then, simply by shutting off the flow of OGD medium the ischemic tissue can be reperfused with oxygenated medium. It is also possible to culture the OGD treated tissue slices and thus be able to study the long term (24 h to 7 days) effects of re-oxygenation following focal stroke. Thus, the present model can be very useful in studying reperfusion injury and in test-ing compounds aimed at reductest-ing this type of ischemic injury as well. Further, this model may be used to test and pharmacologically evaluate compounds for their neuroprotective or neurotoxic poten-tial in slices from other organs such as heart (study myocardial infarction, reperfusion injury) and liver (safety and liver function). Thus, this opens a multitude of other research areas in which our model may be used in the future.
In conclusion, these results demonstrate that this novel in vitro focal ischemic model can be used to mimic the core of a stroke, but more importantly, we have developed a methodology to also investigate the propagation and progression of hypoxia-induced events in the surrounding (penumbra) region. Thus, the ability of our model to allow for the study of the progression, cascade of events and mechanism(s) of action involved in secondary cell death occurring in the penumbra, and the mitigation thereof is of high clinical relevance.
References
Astrup J, Siesjö BK, Symon L. Thresholds in cerebral ischemia – the ischemic penum-bra. Stroke 1981;12(November–December (6)):723–5.
Beilharz EJ, Williams CE, Dragunow M, Sirimanne ES, Gluckman PD. Mechanisms of delayed cell death following hypoxic-ischemic injury in the immature rat: evidence for apoptosis during selective neuronal loss. Brain Res Mol Brain Res 1995;29(1):1–14.
Blanton MG, Lo Turco JJ, Kriegstein AR. Whole cell recording from neurons in slices of reptilian and mammalian cerebral cortex. J Neurosci Methods 1989;30(3):203–10.
Bonde C, Sarup A, Schousboe A, Gegelashvili G, Zimmer J, Noraberg J. Neurotoxic and neuroprotective effects of the glutamate transporter inhibitor dl-threo-beta-benzyloxyaspartate (dl-TBOA) during physiological and ischemia-like conditions. Neurochem Int 2003;43(4–5):371–80.
Brouns R, De Deyn PP. The complexity of neurobiological processes in acute ischemic stroke. Clin Neurol Neurosurg 2009;111(6):483–95 [Review].
Chuquet J, Hollender L, Nimchinsky EA. High-resolution in vivo imaging of the neu-rovascular unit during spreading depression. J Neurosci 2007;27(15):4036–44. Datta A, Park JE, Li X, Zhang H, Ho ZS, Heese K, et al. Phenotyping of an in vitro model of ischemic penumbra by iTRAQ-based shotgun quantitative proteomics. J Proteome Res 2010;9(1):472–84.
Durukan A, Tatlisumak T. Acute ischemic stroke: overview of major experimen-tal rodent models, pathophysiology, and therapy of focal cerebral ischemia. Pharmacol Biochem Behav 2007;87(1):179–97.
Fordyce CB, Jagasia R, Zhu X, Schlichter LC. Microglia Kv1.3 channels contribute to their ability to kill neurons. J Neurosci 2005;25(31):7139–49.
Gahwiler BH, Capogna M, Debanne D, McKinney RA, Thompson SM. Organotypic slice cultures: a technique has come of age. Trends Neurosci 1997;20:471–7. Garcia de Arriba S, Franke H, Pissarek M, Nieber K, Illes P. Neuroprotection by
ATP-dependent potassium channels in rat neocortical brain slices during hypoxia. Neurosci Lett 1999;273(1):13–6.
Graham SM, McCullough LD, Murphy SJ. Animal models of ischemic stroke: balancing experimental aims and animal care. Comp Med 2004;54(5):486– 96.
Hansen AJ. The extracellular potassium concentration in brain cortex following ischemia in hypo- and hyperglycemic rats. Acta Physiol Scand 1978;102:324–9. Hossmann KA. Viability thresholds and the penumbra of focal ischemia. Ann Neurol
1994;36(4):557–65.
Jarvis CR, Anderson TR, Andrew RD. Anoxic depolarization mediates acute dam-age independent of glutamate in neocortical brain slices. Cereb Cortex 2001;11(3):249–59.
Joshi I, Andrew RD. Imaging anoxic depolarization during ischemia-like conditions in the mouse hemi-brain slice. J Neurophysiol 2001;85(1):414–24.
Kaushal V, Schlichter LC. Mechanisms of microglia-mediated neurotoxicity in a new model of the stroke penumbra. J Neurosci 2008;28(9):2221–30.
Larsen GA, Skjellegrind HK, Moe MC, Vinje ML, Berg-Johnsen J. Endoplasmic reticu-lum dysfunction and Ca2+ deregulation in isolated CA1 neurons during oxygen and glucose deprivation. Neurochem Res 2005;30(5):651–9.
Lee BJ, Egi Y, van Leyen K, Lo EH, Arai K. Edaravone, a free radical scavenger, protects components of the neurovascular unit against oxidative stress in vitro. Brain Res 2010;1307:22–7.
Lipski J, Wan CK, Bai JZ, Pi R, Li D, Donnelly D. Neuroprotective potential of ceftriax-one in in vitro models of stroke. Neuroscience 2007;146(2):617–29. Lipton P. Ischemic cell death in brain neurons. Physiol Rev 1999;79(4):1431–568
[Review].
Lossi L, Alasia S, Salio C, Merighi A. Cell death and proliferation in acute slices and organotypic cultures of mammalian CNS. Prog Neurobiol 2009;88(4):221– 45.
Martínez-Sánchez M, Striggow F, Schröder UH, Kahlert S, Reymann KG, Reiser G. Na(+) and Ca(2+) homeostasis pathways, cell death and protection after oxygen-glucose-deprivation in organotypic hippocampal slice cultures. Neuroscience 2004;128(4):729–40.
Niiyama S, Tanaka E, Tsuji S, Murai Y, Satani M, Sakamoto H, et al. Neuroprotective mechanisms of lidocaine against in vitro ischemic insult of the rat hippocampal CA1 pyramidal neurons. Neurosci Res 2005;53(3):271–8.
Noraberg J, Poulsen FR, Blaabjerg M, Kristensen BW, Bonde C, Montero M, et al. Organotypic hippocampal slice cultures for studies of brain damage, neuropro-tection and neurorepair. Curr Drug Targets CNS Neurol Disord 2005;4(4):435–52 [Review].
Saleh TM, Kombian SB, Zidichouski JA, Pittman QJ. Cholecystokinin and neurotensin inversely modulate excitatory synaptic transmission in the parabrachial nucleus in vitro. Neuroscience 1997;77(1):23–35.
Saleh MC, Connell BJ, Saleh TM. Estrogen may contribute to ischemic toler-ance through modulation of cellular stress-related proteins. Neurosci Res 2009;63(4):273–9.
Schilling M, Besselmann M, Leonhard C, Mueller M, Ringelstein EB, Kiefer R. Microglial activation precedes and predominates over macrophage infiltration in transient focal cerebral ischemia: a study in green fluorescent protein trans-genic bone marrow chimeric mice. Exp Neurol 2003;183(1):25–33.
Shi H, Liu KJ. Cerebral tissue oxygenation and oxidative brain injury during ischemia and reperfusion. Front Biosci 2007;12:1318–28 [Review].
Somjen GG. Mechanisms of spreading depression and hypoxic spreading depression-like depolarization. Physiol Rev 2001;81(3):1065–96.
Tanaka E, Yamamoto S, Kudo Y, Mihara S, Higashi H. Mechanisms underlying the rapid depolarization produced by deprivation of oxygen and glucose in rat hip-pocampal CA1 neurons in vitro. J Neurophysiol 1997;78(2):891–902. Tsujita K, Shimomura H, Kawano H, Hokamaki J, Fukuda M, Yamashita T, et al. Effects
of edaravone on reperfusion injury in patients with acute myocardial infarction. Am J Cardiol 2004;94(4):481–4.
Vivaldi MT, Kloner RA, Schoen FJ. Triphenyltetrazolium staining of irreversible ischemic injury following coronary artery occlusion in rats. Am J Pathol 1985;121(3):522–30.
Weng YC, Kriz J. Differential neuroprotective effects of a minocycline-based drug cocktail in transient and permanent focal cerebral ischemia. Exp Neurol 2007;204(1):433–42.
Wise-Faberowski L, Robinson PN, Rich S, Warner DS. Oxygen and glucose depri-vation in an organotypic hippocampal slice model of the developing rat brain: the effects on N-methyl-d-aspartate subunit composition. Anesth Analg 2009;109(1):205–10.
Wood PL. Microglia as a unique cellular target in the treatment of stroke: potential neurotoxic mediators produced by activated microglia. Neurol Res 1995;17(4):242–8 [Review].
Xie Z, Wei M, Morgan TE, Fabrizio P, Han D, Finch CE, et al. Peroxynitrite mediates neurotoxicity of amyloid beta-peptide1-42- and lipopolysaccharide-activated microglia. J Neurosci 2002;22(9):3484–92.
Ye R, Li N, Han J, Kong X, Cao R, Rao Z, et al. Neuroprotective effects of ginsenoside Rd against oxygen-glucose deprivation in cultured hippocampal neurons. Neurosci Res 2009;64(3):306–10.
Yoshida H, Yanai H, Namiki Y, Fukatsu-Sasaki K, Furutani N, Tada N. Neuroprotective effects of edaravone: a novel free radical scavenger in cerebrovascular injury. CNS Drug Rev 2006;12(1):9–20.
Zheng Z, Zhao H, Steinberg GK, Yenari MA. Cellular and molecular events underlying ischemia-induced neuronal apoptosis. Drug News Perspect 2003;16(8):497–503.