Publisher’s version / Version de l'éditeur:
Canadian Geotechnical Journal, 19, pp. 421-432, 1982
READ THESE TERMS AND CONDITIONS CAREFULLY BEFORE USING THIS WEBSITE. https://nrc-publications.canada.ca/eng/copyright
Vous avez des questions? Nous pouvons vous aider. Pour communiquer directement avec un auteur, consultez la première page de la revue dans laquelle son article a été publié afin de trouver ses coordonnées. Si vous n’arrivez pas à les repérer, communiquez avec nous à PublicationsArchive-ArchivesPublications@nrc-cnrc.gc.ca.
Questions? Contact the NRC Publications Archive team at
PublicationsArchive-ArchivesPublications@nrc-cnrc.gc.ca. If you wish to email the authors directly, please see the first page of the publication for their contact information.
NRC Publications Archive
Archives des publications du CNRC
This publication could be one of several versions: author’s original, accepted manuscript or the publisher’s version. / La version de cette publication peut être l’une des suivantes : la version prépublication de l’auteur, la version acceptée du manuscrit ou la version de l’éditeur.
Access and use of this website and the material on it are subject to the Terms and Conditions set forth at
The influence of snow cover on the ground thermal regime
Goodrich, L. E.
https://publications-cnrc.canada.ca/fra/droits
L’accès à ce site Web et l’utilisation de son contenu sont assujettis aux conditions présentées dans le site LISEZ CES CONDITIONS ATTENTIVEMENT AVANT D’UTILISER CE SITE WEB.
NRC Publications Record / Notice d'Archives des publications de CNRC:
https://nrc-publications.canada.ca/eng/view/object/?id=5e204d8c-1340-465b-a432-fc46e9bd8430 https://publications-cnrc.canada.ca/fra/voir/objet/?id=5e204d8c-1340-465b-a432-fc46e9bd8430~Obld
Ser
T H l National Research Conseil national
N21d Council Canada de recherches Canada
350
I
---
THE INFLUENCE OF SNOW COVER ON THE GROUND
THERMAL REGIME
I
I by L. E. Goodrich
RMALYZEP
I
Reprinted from
Canadian Geotechnical Journal
Fz-
01-
1
e
Vol. 19, 1982 pp. 421-432
1
!
: : - * - ---
.
.
- , L . I . .-.- I-
3
I DBR Paper No. 1050Division of Building Research I
Price $1.25 OTTAWA
NRCC
20588The influence of snow cover on the ground thermal regime
L. E. GOODRICHGeotechnical Section, Division of Building Research, National Research Council of Canada, Ottawa, Ont., Canada KIA OR6
Received May 1, 198 1 Accepted June 10, 1982
This a r resents the results of a numerical study of the effects of snow cover on long-term, periodic, steady-state equilibrinm
-
ground emperatures. It is shown that mean annual ground temperatures decrease with depth when the soil thermal conductivity is greater in the frozen than in the unfrozen phase. For permafrost conditions the increase in mean annual ground temperatures due to seasonal snow cover is augmented significantly when soil latent heat is present. In seasonal frost cases the calculated depth of frost penetration is extremely sensitive to details of the snow cover buildup. In permafrost cases calcu- lated mean annual temperatures are extremely sensitive to the assumptions made in treating the snow cover. In either case, because it is difficult to model snow cover accurately, the reliability of ground thermal regime computations is adversely affected.Keywords: ground thermal regime, ground temperatures, soil temperatures, numerical model, finite difference, snow cover.
Cet article prksente les rksultats d'une ktude numkrique sur les effets d'un couvert de neige sur les temperatures du sol en rkgime permanent, pkriodique, B long terme. On montre que les temgratures moyennes annuelles dkcroissent avec laprofondeur lorsque la conductivitk thermique du sol est plus grande en phase gelee qu'en phase non gelke. En conditions de permafrost, l'augmentation des temgratures annuelles moyennes due h une couverture de neige saisonnikre est accrue de f a ~ o n importante si la chaleur latente de sol est prksente. Dans les cas de gel saisonnier la profondeur de @netration du gel calculke est trks sensible aux details de la formation du couvert de neige. Dans le cas de permafrost, les temgratures annuelles moyennes calculkes sont trks sensibles aux hypothkses faites dans le traitement du couvert de neige. Dans les deux cas, la difficult6 de modeliser prkcisement le couvert de neige nuit B la fiabilitk des calculs de regime thermique du sol.
Mots-clks: rkgime thermique du sol, tempkrature du sol, modkle numkrique, diffkrences finies, couvert de neige.
Can. Geotech. J., 19, 421-432 (1982)
Introduction description of Lachenbruch to include a sinusoidal time The influence of seasonal snow cover on the annual dependence for the thermal properties of the surface. In ground thermal regime has long been recognized. Snow addition, a simplified numerical model was used to
cover is an insulator by c o m p ~ s o n with most natural examine the effects of introducing soil latent heat.
ground surface materials and, since it is present only The Parameter sensitivity study presented here was
during the cold part of the annual temperature cycle, the made with a somewhat more elaborate numerical model, net effect over a year is to raise mean annual ground which has been described in detail elsewhere (Goodrich
temperatures, often by several degrees. 1974,1978). A brief description is given in Appendix B.
hi^ paper describes a numerical study of snow- Conclusions similar to those of Gilpin and Wong (1976)
ground thermal interactions and presents a series of are reached regarding the effects of soil latent heat. A
graphical results that illustrate the effect on the long- number of aspects the snOw-ground
term ground thermal regime of variations in snow and thermal interaction are discussed- soil properties. These calculations originally formed a
part of the author's Ph.D. thesis (Goodrich 1976), work Model assumptions
done in the early 1970s. Although a number of field Model calculations were made for periodic steady-
studies had been reported at that time (Gold 1963, 1964, state conditions assuming a sinusoidal dependence of 19671, theoretical computations of the effects of snow surface temperature with a period of 1 year, applied to cover on ground temperatures had not progressed the snow surface when snow cover was present and to beyond the simplified analysis presented by Lachen- the bare ground surface during the remainder of the year. bruch (1959). This analysis neglected soil latent heat as The boundary condition at depth was represented by a well as changes of thermal properties associated with constant heat flux whose value, 0.063 w/m2, corre- freezing and thawing of the ground. In addition, the sponded to the geothermal heat flux. The lower calcula- snow cover was represented as a simple constant thermal tion boundary was located at 15 m; calculations showed resistance that was switched on and off according to the that even in the worst case this depth was adequate to
season. ensure no significant effect on temperatures (errors
Gilpin and Wong (1976) extended the analytical <O.Ol°C) in the first 5 m below the surface. The snow
0008-3674/82/040421-12$01 .OO/O
42 2 CAN. GEOTECH. J. VOL. 19, 1982
TABLE 1. Material properties assumed in the calculations
kf Cf kt ct W
Frozen Frozen Thawed Thawed Water
thermal volumetric thermal volumetric P content Volumetric LY
conductivity heat capacity conductivity heat capacity Bulk density (mass basis) latent heat Material (W/(m.K)) ( M J / ( ~ ~ . K ) ) (W/(m.K)) ( M J / ( ~ ~ . K ) ) (t/m3) (%I (MJ/m3)
Snow k = 2.9p2 2 . 0 9 ~ -
-
0.25-
-
or variable
Fine-grained soil 2.21 1.92 1.13 2.87 1.3 35 152.0
Coarse-grained soil 3.01 1.86 2.19 2.40 1.75 15 87 .,7
Organic surface layer 1.20 2.30 0.40 3.89 0.17 500 283.9
cover mass was assumed to build up linearly to a maximum value, remaining constant thereafter until melting in the spring. In most of the calculations snow density was assumed constant but in others provision was made to simulate snow cover densification using a numerical solution of the viscous compaction formula- tion of Kojima (1966). Thermal properties were related to snow density using Abel's empirical formula (Bader and Kuroiwa 1962). Snow melting was accommodated using a degree-day approach. Further information on the snow cover model assumptions is given in Appendix A.
In most cases the soil was represented as a single homogeneous layer with distinct frozen and thawed thermal properties. Values chosen approximated the empirical results of Kersten (1949). No attempt was made to account for variations in soil thermal properties accompanying seasonal changes in moisture content at shallow depths. Latent heat release or absorption accom- panying soil freezing and thawing was included, assum- ing that the phase change took place completely at the freezing point. No attempt was made to accommodate either frost heaving or thaw settlement.
These assumptions constitute a considerable idealiza- tion when compared with real snow covers and soil conditions. Inclusion of soil freezing over a temperature range and/or of moisture redistribution and geometric changes accompanying frost heaving or thaw settlement would evidently lead to different numerical values of certain computed results such as frost or thaw depths and to curvature of the mean annual ground temperature profiles. More realistic models for the snow cover would have an even greater effect on these quantities. The calculations presented here are primarily intended to illustrate the major features of snow-ground thermal interactions in general. The conclusions reached are essentially qualitative, and it is believed that the model is appropriate for this purpose.
Material properties used in the calculations are listed in Table 1. The results of calculations made for a total of 11 seasonal frost cases and 12 permafrost cases are summarized graphically in Figs. 1-10. In addition
Tables 2 and 3 give some numerical results. In the figures the sections labelled (a) show the ground surface temperature as a function of time (Julian calendar). During snow-free periods this is identical to the assumed sinusoidal surface temperature. With snow cover the curve represents the computed snow-ground interface temperature. Sections (b) show the depth of freezing or thawing computed directly by the model. Sections (c) indicate the assumed or computed snow depth and density history. Finally, Sections (d) show the com- puted mean annual ground temperature as functions of depth and also indicate the maximum-minimum tem- perature envelopes.
Seasonal frost cases
Two standard cases were computed, assuming a homogeneous fine-grained soil with properties as listed in Table 1. The sinusoidal surface temperature had an annual mean of 5°C with am~litude 15°C. For run 1 the ground surface remained b&e throughout the year. For run 2 a snow cover of constant density (0.25 t/m3) was assumed to begin building up on day 300, 5 days after the onset of freezing, and continuing for 95 days until a maximum 0.5-m depth was achieved. Spring melt was computed using a melt factor of 5 kg.m-2.day-1.~-1. The remaining nine cases consider variations of snow cover parameters, surface temperature amplitude, snow melt rate, and soil properties.
Results for run 1 are indicated by the solid curves in Fig. 1. The curvature of the mean annual temperature profile within the active zone corresponding to the maximum depth of seasonal frost should be noted. This thermal rectification effect is a consequence of the difference in frozen and thawed soil conductivities. Such effects have received little attention in the ground thermal regime literature. In the remainder of this paper the term thermal offset is used to indicate the difference between the mean annual ground temperature at the bottom of the active zone and that at the ground surface. The sign of the thermal offset is negative whenever the frozen soil conductivity value exceeds the thawed value.
DAY NUMBER 423 DAY NUMBER 2 o o o
i2:ol
6,;<
U u, -. =;
5 --A = --- u L l o ) SURFACE TEMPERATURE- - -
= -- --- J . l o a J - 1 0 l o ) SURFACE IEMPERATURE---
-
0
l b l FREEZING - - _ _ _ _ - - 4 - r + a I b ) FREEZING ", 0."
1 5 0 75 1.5 f " - UJ I I I 1 I I :<---\, - l c ) SNOW COVER - < *-z 0 , I , 1 I I I <- L 0. 75 I I I I I 1 E * x 0-
-
- ( c ) SNOW COVER--
-
I 0 I I I I TEMPERATURE 'C (I t o 0 10 20 TEMPERATURE. 'C . t o 0 I D 20 0 l d ) ENVELOPE B MEAN 5-
-
E 5 = I-
a .d 0 $ 10 - u m 1-
RUN 1 I lo I --- RUN 2 I ! L l% I t I I 5FIG. 1. Seasonal frost: standard snow cover compared with
bare surface. FIG. 2. Seasonal frost: shallow snow cover-slow com-
pared with rapid snow buildup.
The magnitude of the offset is determined, for given ground surface temperature conditions, by the ratio of
frozen to thawed conductivity and by the depth of the of 0.25 m are shown by the dashed curves in Fig. 2. The
active zone. maximum frost depth achieved is more than twice that
The effectiveness of the standard snow cover in obtained with the 0.5-m snow cover and occurs some-
inhibiting frost penetration may be seen in Fig. 1 b, run what later in the season. The mean annual ground sur-
2. Note that nearly half the total frost depth is achieved face temperature is, however, decreased by only 0.3"C in the brief freezing period just prior to the inception of from the value obtained in run 2.
the snow cover buildup. In Fig. I d it may be seen that The solid curves in Fig. 2 show the result (run 4) of
the presence of the snow cover has displaced the mean reducing the assumed snow cover buildup period to 30 annual ground surface temperature by 2.3"C while, days. The maximum predicted frost penetration is less because of the reduction in thermal offset, temperatures than half that found in run 3. More than half of the at depth have been increased by an additional 2.2"C. increase in mean annual ground temperatures over those Figure I d also indicates that, while snow cover reduces of run 3 is attributable to the decrease in thermal offset. the amplitude of annual temperature variations at the At the ground surface, however, the mean annual surface, at depth the amplitude may be increased rela- temperature is nearly the same in both cases.
tive to that for bare surface conditions. This is a conse- As pointed out by Lachenbruch (1959) the effect of
quence of the liberation of soil latent heat during the seasonal snow cover in warming the ground is increased winter. With latent heat release, wintertime cooling if the surface temperature amplitude is increased. This within the soil (viz., the magnitude of temperature de- arises because, due to the presence of the insulating crease below the mean) is diminished. Owing to the snowpack, summertime increases in ground surface greater intensity of freezing, this effect is greatest for temperatures are not compensated for by identical
bare surface conditions. decreases in the winter. Calculations were made for
Reducing the maximum thickness of snow cover can conditions similar to those of run 2, except that the be expected to reduce mean annual ground temperatures surface temperature amplitude was increased from 15 to while increasing the predicted frost depths. The results 17°C. The results, summarized in Table 2, show the obtained (run 3) using a maximum snow cover thickness mean annual temperature to be 0.5"C warmer than in run
I
I d ) ENVELOPE & MEAN
-
-
-
- RUN 4---
RUN 3 I I I I-
I I ITABLE 2. Summary of calculated results for seasonal frost cases Mean
Minimum annual Total profile Ground Ground Maximum Maximum ground ground displacement surface surface snow frost surface surface Thermal from bare freezing thawing Run Soil height depth temp. temp. offset surface case index index No. type (m) Comments (m) ("c) ("c) ("c) ("c) ("Ceday) ("C-day) Q
%
1 Fine 0 1.40 -10.0 +5.0 -2.3 0 93 1 2761
2 Fine 0.5 Standard snow cover 0.18 - 1.12 7.35 -0.1 4.6 48
i
3 Fine 0.25 Shallow snow cover 0.43 - 1.53 7.08 -0.4 4.1 153(0'08*) (- * 7.38 --0.1 x
4 Fine 0.25 Rapid snow cover buildup
0.18
-
0.44 4.7 44-
5 Fine 0.5 Increased surface temp. amplitude 0.27 - 1.94 7.83 --0.3 5.0 92 6 Fine -0.5 Compacting snow cover -0 (0.07*)
-
I . l 2 7.46 -0 4.8 4 7 Fine 0.5 Melt factor reduced0
Coarse 0.5 ~tanc~ard snow cover 9
Organic 0
11 0. Standard snow cover
fine
GOODRICH D A Y N U M B E R 425 D A Y N U M B E R ", a ( 0 1 S U R F A C E T L M P f R A T U R E 5 - 1 0 I I I I I
d
,-----
l c l S N O W C O V E R I , ( c ) S N O W C O V E R-
/ I I I I ! I I I I_.--
T E M P E R A T U R E . " C T E M P E R A I U R E . OC 0 10 ( d l E N V E L O P E & M E A N --
- - - - R U N 9 111 I I IFIG. 3. Seasonal frost: compacting snow cover compared FIG. 4. Seasonal frost: coarse-grained soil with and without
with standard snow cover. snow cover.
2 and this is the greatest difference from standard for all the conditions examined.
Figure 3 (solid curves) shows results obtained assum- ing a snow cover that densifies as the season progresses (Appendix A). A constant accumulation rate lasting for
the first 95 days of the snow season was assumed.
During this period, snow at the surface remains at nearly the initial density (0.1 t/m3). Within the snowpack the density increases with depth and with time. The dotted lines in Fig. 3 c indicate layers of equal snow mass. They also represent the layer boundaries used for both the temperature and snow compaction computations. The calculations indicate that, following the onset of snow cover, the frost line rises and the ground surface remains essentially at the freezing point throughout the snow season. Figure 3d shows that the mean annual surface temperature is nearly identical to that of run 2 (dashed curves), whereas the difference at depth arises because of differences in thermal offset.
To test the sensitivity of the thermal regime to
differences in the rate of spring melt, in run 7 the melt
factor was reduced to one half the standard value, yielding a snow melt period of 20 days compared with 14 days in run 2. This resulted in an insignificant
(<O.
1°C) lowering of mean annual ground temperatures,whereas other aspects of the thermal regime remained
unchanged from the standard snow cover case (see Table 2).
Runs 8 and 9 were made assuming the ground to be a coarse-grained material with properties as indicated in Table 1. Comparison of Fig. 4b with Fig. 1 b shows that, although the frost penetration for bare surface conditions is nearly 2 m in the coarse-grained soil, the thaw rate also is correspondingly rapid, with the result that the ground is fully thawed a month earlier than in the fine-grained soil case. Figure 4d shows a thermal offset
of only
-
1°C for bare surface conditions, which isconsistent with the smaller ratio of frozen to thawed conductivity. At the same time, because of the higher conductivity values and lower moisture contents, the amplitude of seasonal temperature fluctuations at depth is much greater than for the fine-grained soil. The dashed curves in Fig. 4 show the results obtained under standard snow cover conditions. Although the frozen conductivity is considerably greater and the volumetric latent heat much less than for the fine-grained soil, and ground surface freezing indices are similar, the maxi- mum frost penetration is only slightly greater than that obtained in run 2. The tendency for the frost line to rise in midwinter is also more marked in coarse-grained soil. Both effects can be attributed to the increased role of ground heat storage.
CAN. GEOTECH. J . VOL. 19, 1982 D A Y N U M B E R D A Y N U M B E R ." 20
-
= = -- 2 5 1 0 1 S U R F A C E T E M P E R A T U R E I - - - - 5 - 1 0 C P. ( b l F R E E Z I N G r 1 b ) ~ H A W I H G 1 . 2 1 . 5 1 I I I I I L 0 . 7 5 I I I I I I E 0 7 5 I I I I I I ----
C_--
-- - -
-- - -
--
-
C / r \ ( c l S N O W C O V E R T ! ( c l S N O W C O V E R " * - - - 0 -__--
_---
I-
u-
< I , , I I I - - = 0 I I ' I I_---
I L 1 = o T E M P E R A T U R E . 'C T E M P E R A T U R E . " C LO 2 0 ( a ) E N V E L O P E & M E A N I-
E r u-
I0-
1 --
R U N 1 0 I I---
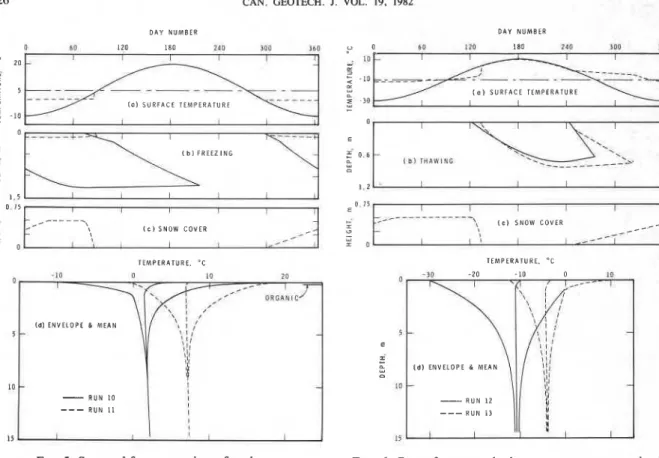
R U N 1 1 t I I 15 I I I I IFIG. 5. Seasonal frost: organic surface layer.
Figure 5b shows the effectiveness of an organic surface layer in reducing frost and thaw penetration rates. The very large thermal offset associated with the
high ratio of frozen to thawed conductivity (kflkt = 3) of
the organic material may be seen in Fig. 5d. Of a total thermal offset of -3S°C, -2.25"C occurs across the 0.2-m thick organic layer. As a result, deep ground temperatures are 1.7"C cooler than in the standard case (run 1).
Results with snow cover are shown by the dashed curves in Fig. 5. Although the mean annual surface temperature is essentially identical to that of run 2, the total increase in mean temperature at depth brought about by the addition of snow cover is 5.4"C. More than half of this increase is associated with the reduction in thermal offset. It may also be seen in Fig. 5 d that, at depth, the amplitude of seasonal temperature variations is again greater with snow cover than without it.
Permafrost cases
Calculations were made for soil and snow cover conditions similar (except as noted) to those assumed in the seasonal frost cases. The snow cover was assumed to begin building up on day 250, five days after the start of freezing conditions, and to continue at a constant rate until day 30, when a maximum depth of 0.5m was
FIG. 6. Permafrost: standard snow cover compared with
.
bare surface.
reached. The surface temperature was assumed to have a
mean value of
-
10°C with an amplitude of 20°C.1
The thermal regime for bare surface conditions, run ,
12, is shown by the solid lines in Fig. 6. The thermal ,
offset obtained is about half that found in the seasonal
frost case. The maximum thaw depth in this case is also I
about half the frost depth obtained in run 1. I
The dashed curves in Fig. 6 show results obtained for the standard snow cover conditions, run 13. The
behaviour of the snow-ground interface temperature is j
noteworthy. During the autumn the ground surface ,
temperature cannot descend much below freezing until
1
the active layer has completely refrozen. This effect
results from the combination of soil latent heat and the
{
presence of the insulating snow cover. Once freezeback
I
is complete, temperatures in the active layer drop
rapidly and, in contrast with seasonal frost cases where
1
latent-heat is released throughout the winter, relatively cool temperatures may eventually be obtained. As Fig.
6d shows, the addition of snow cover results in a
i
substantial increase in the mean annual surface tem~er-
I
ature without significantly changing the thermal offset. At the same time, the width of the maximum-minimum temperature envelope is reduced sharply.
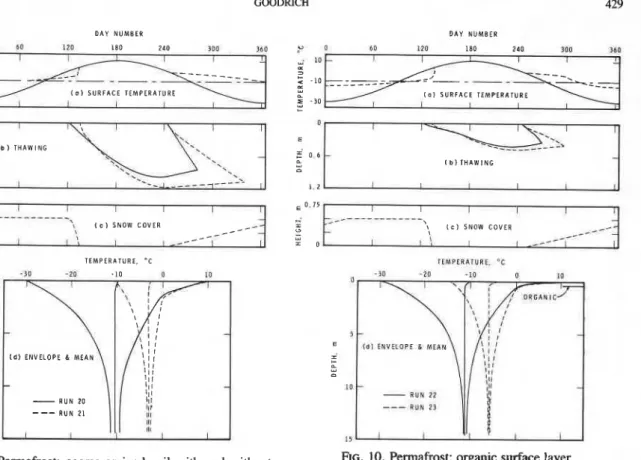
GOODRICH 427 thickness reduced to 0.25 m are shown as run 14 in Fig.
7. Compared with run 13 there is a reduction of about 30 days in the time required to refreeze the active layer completely in the autumn and, taken together with the reduced insulation associated with the thinner snow cover, this permits colder ground surface temperatures to be maintained for a longer period. In consequence, the mean annual ground surface temperature is 3.6"C colder than that obtained in run 13. Corresponding to the lower mean annual temperatures, the width of the maximum-minimum temperature envelope is also con- siderably greater.
Reducing the assumed snow cover buildup period to 30 days makes a large change in the mean annual temperature. The results, shown as run 15 in Fig. 7, indicate an increase in the mean annual ground temper- ature of nearly 4°C by comparison with run 14.
The consequences of a small change in assumed surface temperature amplitude (increased from 20 to 22°C) are summarized in Table 3, run 16. In spite of the colder winter snow surface temperatures the minimum ground surface temperature is more than 1 "C warmer than that calculated in run 13. The mean annual ground surface temperature is -2"C, which is nearly 1.5"C warmer than for the standard case.
Figure 8 (solid curves) shows the thermal regime
predicted assuming a snow cover that densifies during the season (run 17). The snow cover model and parameter assumptions used were similar to those of run 6. Compared with the standard case (dashed curves) the thermal resistance of the compacting snow cover is much higher during the critical autumn period. The effect on mean annual temperatures is sufficiently great that the permafrost is predicted to melt entirely.
Results obtained with the melt factor taken as one half of the value used in the standard case showed that, as in the seasonal frost case, the snow melt rate has only a slight effect on the thermal regime. The maximum thaw depth was diminished by 3% and mean annual surface temperatures were reduced by 0.3"C (Table 3).
Using the standard 0.5-m snow cover but, assuming a buildup period reduced to 30 days, the mean annual
ground temperature is raised to
+
1°C (Table 3), and thepermafrost is predicted to disappear entirely. This result underlines the significance of autumn snow conditions in determining mean annual ground temperatures in permafrost.
Calculations for coarse-grained soil with (run 20) and without (run 21) seasonal snow cover are shown in Fig. 9. By comparison with the fine-grained soil (Fig. 6b), there is both a deeper maximum thaw penetration and a more marked tendency for the thaw plane to rise in late
D A Y N U M B E R D A Y N U M B E R ( 0 ) S U R F A C E T E M P E R A T U R E z "L , ( 0 1 S U R F A C E T E M P E R A T U R E 5 - 3 0 I I I I I P. f 0.6 ( b l T H A W I N G .*-
_
L --> 0 6 ", - _ _ _ _ - - - - > 0 1 . 2 I. 2 0 7 5 0 75- + .. I I c, L,-
u I- 0 = 0 T E M P E R A T U R E . 'C T E M P E R A T U R E . "C I I I I I 1, --
I C l S N O W C O V E R -.-- I IFIG. 7 . Permafrost: rapid snow cover buildup, shallow snow FIG. 8. Permafrost: compacting snow cover compared with
TABLE 3. Summary of calculated results for permafrost cases
Mean
Minimum annual Total profile Ground Ground
Maximum Maximum ground ground displacement surface surface
snow thaw or surface surface Thermal from bare freezing thawing
Run Soil height frost depth temp. temp. offset surface case index index 0
No. type (m) Comments (m) ("c) ("c) ("c) ("c) ("Caday) ("Ceday)
$
12 Fine 0 0.74 -30.0 -10.0 -1.1 0 4458 798
13 Fine 0.5 Standard snow cover 0.84 -12.25 - 3 . 4 2 -1.1 6.6 2027
Q
8
14 Fine 0.25 Shallow snow cover 0.76 -19.68 - 7.04 -1.0 3.0 3362 0
15 Fine 0.25 Rapid snow cover buildup 0.85 -14.54 - 3 . 1 4 -1.0 6.9 1933
+
16 Fine 0.5 Increased surface temp. amplitude 0.98 -11.03 - 2.01 -1.3 7.8 171317 Fine -0.5 Compacting snow cover 0.77 (frost) - 2.43
+
1.39 -0.7 11.8 2625
r
18 Fine 0.5 Melt factor reduced 0.81 -12.59 - 3.78 --1.05 6.3 2128 -51
19 Fine 0.5 Rapid snow cover buildup 0.95 (frost)
-
2.81+
1.09 -0.9 11.3 374-
w0 1.32 -30.00 -10.0 -0.56 0 4458 N
00
}
coarse 0.5 Standard snow cover1.57 -10.22 - 2.61 -0.54 7.4 1728 Organic
0
Standard snow cover 0.42 -30.00 -10.0 -1.37 0 4458 798 23
1
0.5 0.49 -14.47 - 4.78 -1.33 5.3 2522 772D A Y N U M B E R 429 D A Y N U M B E R l b ) T H A W I N G
'.
0 I I 11 E 0 6 --
L I b ) T H A W I N G ,., 0--- ---
- -
----- -
- - - -
( c ) S N O W C O V E R--
$---
\ L C ) S N O W C O V E R +.--- _<-- I 1 6 I I r \ I I__--
I T E M P E R A T U R E , O C I E M P L R A I V R F . 'C n 10-
R U N 20- --
R U N 2 1 11 t 111 111 11, 15 I I IFIG. 9. Permafrost: coarse-grained soil with and without snow cover.
summer prior to freezeback. Even though the volumetric latent heat assumed for the coarse-grained soil is much less than that assumed for the fine-grained soil a longer time is required for complete refreezing of the active layer. With the standard snow cover, the predicted maximum thaw depth increases by nearly 20% over that for the bare surface. This is nearly twice the increase obtained for the fine-grained soil. Figure 9d shows only a slight curvature of the mean annual temperature profile and a thermal offset of only
-
-0.5"C is predicted. The mean annual ground surface temperature with snow cover is nearly 1°C warmer than that calculated for the fine-grained soil.Figure 10 shows results (runs 22 and 23) obtained when a 0.2-m organic layer was added to the surface, while all other parameters remained as in the standard cases. Thaw retardation caused by the organic layer is evident in Fig. lob, and total thaw depths achieved both with and without snow cover are about one half of those calculated for the standard cases (Fig. 6b). The time required for freezeback is also shorter even though the organic layer causes a large reduction in the freezing and thawing rates. The mean annual profile exhibits a thermal offset of -1.4"C, almost all of which is associated with the organic layer. With seasonal snow
FIG. 10. Permafrost: organic surface layer. cover the overall effect of the insulating but wet organic layer is to lower mean annual ground surface tempera- tures. The value obtained in run 23 is approximately
1.4"C colder than in the standard case (m 13). For bare surface conditions, the amplitude of the maximum- minimum temperature envelope is slightly reduced over that of the standard case (run 12). With snow cover, however, the situation reverses and the amplitude is greater when the organic layer is present (Fig. lOd), than without it (Fig. 6d).
Discussion and conclusions
Mean annual ground temperatures may be increased by several degrees in the presence of snow cover. In seasonal frost cases, for given surface temperature conditions, the increase is controlled primarily by the duration of the snow cover and is insensitive to parameters governing the snow cover buildup. In permafrost cases, on the other hand, mean annual ground temperatures are strongly dependent on snow cover parameters. The maximum snow depth as well as snow conditions in the early winter are particularly critical to the mean annual ground temperature in permafrost regions.
For ground materials with temperature-dependent thermal conductivities the mean annual temperature
430 CAN. GEOTECH. J. VOL. 19. 1982 profile at equilibrium may show a thermal offset of up to
3 or 4°C for typical seasonal frost and permafrost
conditions. The thermal offset is negative if kf
>
kt, as iscommonly the case, and increases in value with increas- ing ratio kflkt. The thermal offset will also increase with active layer depth. In seasonal frost cases the decrease in ground temperatures that would result from the elimina- tion of the snow cover is accompanied by an additional decrease associated with the thermal offset. In the cases considered this effect accounted for from -25-65% of the total profile displacement. In permafrost cases, by contrast, the value of the thermal offset is practically not affected by the existence of seasonal snow cover.
In seasonal frost conditions both the insulating snow cover and the soil latent heat combine to maintain the snow-ground interface temperature at values near freez- ing during the entire winter. The mean annual ground surface temperature is not, however, greatly affected by the amount of soil latent heat available. The snow cover alone is sufficient to maintain winter ground surface temperatures near freezing and thus ensure that the annual mean value is essentially determined by the summer regime.
In permafrost conditions the effect of latent heat release combined with an insulating snow cover during freezeback of the active layer results in an additional increase in mean ground temperatures over and above that due directly to the snow cover. In contrast with the seasonal frost case, mean annual ground temperatures in permafrost with snow cover may be several degrees warmer than in the absence of latent heat. The sensitivity of mean temperatures to other parameters is also increased by the presence of latent heat.
In seasonal frost cases, although the frost penetration depth is controlled by the usual combination of soil properties and surface temperatures, with seasonal snow cover the frost penetration is very strongly conditioned by the thermal resistance of the snow pack. Autumn penetration may represent a large fraction of the total frost depth achieved, and details of the autumn period are critical to determining subsequent frost penetration. In addition, frost penetration is strongly retarded by ground heat storage when snow cover is present.
In permafrost cases the effect of snow cover on summer thaw depths, although small, is not entirely negligible. Compared with bare surface conditions, increases of up to 13% were calculated for fine-grained soil and 19% for coarse-grained soil. In most of the permafrost cases the maximum thaw depth is reached some time prior to the onset of refreezing. This tendency is most noticeable in those cases having the coldest mean ground temperatures.
The width of the maximum-minimum temperature envelope is narrower the closer the mean annual temperature profile is to the freezing point. This is most
evident in the permafrost results. In most of these cases the effect is partly due to the presence of snow cover, but even with bare surfaces the envelope width at depth narrows as the mean temperature approaches the freez- ing point for otherwise similar conditions. The reason is that latent heat effects dominate for a proportionately greater fraction of the annual cycle.
In contrast with permafrost conditions where the amplitude of annual temperature fluctuations at depth decreases when snow cover is present, in seasonal frost conditions the inclusion of snow cover can actually increase the amplitude of ground temperature fluctua- tions. The calculations also suggest that, contrary to some statements (cf Brown 1970), the spring snow melt rate has only a very minor effect on mean annual ground temperatures.
Implications for numerical model calculations In seasonal frost problems with latent heat and seasonal snow cover, the mean annual ground surface temperature is insensitive to details of the snow cover treatment. In addition, ground thermal properties includ- ing latent heat have almost no effect on mean ground surface temperatures (assuming the summer regime is unaffected). The quality of numerical predictions of mean ground surface temperatures will depend princi- pally on the ability of the model to treat the summer regime.
The accuracy of prediction of mean ground tempera- tures at depth will, however, depend also on the correct- ness of the predicted thermal offset. The thermal offset is strongly determined by the temperature dependence of the soil thermal conductivity and depends as well on the actual freezing depth and duration. When modeling the effects of removing snow covers, the uncertainties associated with predicting the thermal offset may, in seasonal frost problems, significantly affect the reliabil- ity of the prediction of ground temperatures at depth.
The depth of frost under snow cover is, on the other hand, highly sensitive to the assumptions made in treating the snow cover and depends critically on the treatment of the autumn period. Unfortunately, it is during this period that the snow cover is most difficult to model. As a result, prediction of frost depths under snow covers may be very unreliable even in the simplest case where the problem is not further complicated by moisture redistribution and frost heaving.
In permafrost problems the snow cover thermal resistance cannot easily be modeled with accuracy and yet mean annual ground temperatures are critically dependent on this factor. In addition, soil latent heat not only increases mean annual ground temperatures, but also increases the sensitivity to other factors such as snow cover, soil thermal conductivity, and surface temperature amplitude. Mean annual temperatures in
GOODRICH 43 1
permafrost are much more sensitive to all these factors runs. The model assumes that vertical compaction of a I
than is the case for seasonal frost conditions and it is snow layer is controlled by the weight of the overlying
~
doubtful that reliable calculations can be made. Summer snow layers.
thaw depths, on the other hand, are only slightly affected The stress acting at depth Z below the snow surface is
by snow cover and the reliability of prediction depends Z ( t . to)
primarily on the treatment of the summer regime. [A.l] u = l p(Z, T, to) dZ = A(t) dt
0
I:
- uAcknowledgement
where Z(t, to) =,depth below the surface (at time t) of
This paper is a contribution from the Division of Snow deposited at time to, p(Z,r,$) = snow density,
Building Research, National Research Council of Cana- and A(t) = accumulation rate.
da, and is published with the approval of the Director Assuming constant mass for a snow layer, the vertical
of the Division. strain rate is given by
BADER, H., and KUROIWA, D. 1962. The physics and
mechanics of snow as a material. Cold Regions Science and Engineering Series, 11-B, U.S. Army, Cold Regions Re- search and Engineering Laboratory, Hanover, NH.
BROWN, R. J. E. 1970. Permafrost in Canada: Its influence on
northern development. University of Toronto Press, To- ronto, Ont., 234 p.
GILPIN, R. R., and WONG, B. K. 1976. "Heat value" effects in
the ground thermal regime. Journal of Heat Transfer, Transactions of the American Society of Mechanical Engi-
neers, 98, Series C, pp. 537-542.
GOLD, L. W. 1963. Influence of the snow cover on the average
annual ground temperature at Ottawa, Canada. International Association of Scientific Hydrology Publication No. 61, Gentbrugge, Belgium, pp. 82-91.
1964. Analysis of annual variations in ground temper- ature at an Ottawa site. Canadian Journal of Earth Sciences, 1, pp. 146-157.
1967. Influence of surface conditions on ground temperature. Canadian Journal of Earth Sciences, 4, pp. 199-208.
GOODRICH, L. E. 1974. A one-dimensional numerical model
for geothermal problems. Division of Building Research Technical Paper No. 421, National Research Council of Canada, Ottawa, Ont., 22 p.
1976. A numerical model for assessing the influence of snow cover on the ground thermal regime. Ph.D. thesis, McGill University, Montreal, Qu6.
1978. Efficient numerical technique for one-dimen- sional thermal problems with phase change. International Journal of Heat and Mass Transfer, 21, pp. 615-621.
KERSTEN, M. S. 1949. The thermal properties of soils.
Bulletin 28, Engineering Experimental Station, University of Minnesota, Minneapolis, MN.
KOJIMA, K. 1966. Densification of seasonal snow cover.
Proceedings, Physics of Snow and Ice, International Con- ference on Low Temperature Science, Sapporo, Vol. 1, pp. 929-952.
LACHENBRUCH, A. H. 1959. Periodic heat flow in a stratified
medim with applications to permafrost problems. U. S. Geological Survey Bulletin 1083-A, Washington, DC.
Appendix A-Snow cover evolution
A simplified model of snow cover densification based on the work of Kojima (1966) was used in two of the
According to Kojima (1966) a linear stress-strain rate relationship is appropriate for seasonal snow cover
[A.3] E = u / q
where q is an empirically defined compactive viscosity factor related to snow density and temperature by
[A.4] q = qo eqP eAIRT
In this equation q o and q are empirical coefficients whose value is dependent on snow type, A is the activa- tion energy for snow, R is the universal gas constant,
and T the absolute temperature.
Equations [A.2]-[A.4] can be approximated by the central difference expression
&(pjm+'
+
p j m ) u m + j x exp ( q h ( p j m + ' + pjm1)
where pjm is the density of layer j at time mAt.
Solving [AS] by iteration and using
to calculate the thickness of each layer, the snow density profile can be determined for successive time steps. Further details have been given by Goodrich (1976).
Appendix B-Numerical model for conduction heat transfer with phase change
The Fourier heat conduction equation in one dimen- sion,
is approximated by the centred time finite difference equation for layered systems
432 CAN. GEOTECH. 1. VOL. 19, 1982
where i and m are space and time indices, Axi =
xi+' - xi = width of ith element, ci = volumetric heat
capacity of ith element, ki = thermal conductivity of ith
element, and
Tim
= temperature of node i at time mAt.Freezing and thawing are treated by a front tracking method which is capable of good accuracy for problems with phase change at a fixed temperature. The boundary conditions at the moving phase boundary are
and
where a and b refer to the two phases (frozen or un-
frozen), L, is the latent heat per unit volume of soil,
and
Z
is the position of the phase interface. Equation[B.4] is approximated by the finite difference equation.
In [BS] the subscript p designates the element within
which the phase plane is located, Zm and
z"+'
are thepositions of the phase plane at times mAt and (m
+
1)btrespectively, and
The simultaneous solution of [B.2] and [B.5] is achieved by using both upper and lower triangulation.
This makes it possible to eliminate both
T,"+'
andTp+
I"'+'
so that [B.5] contains only one unknown andcan be solved easily for
Zm+'.
Oncezm+'
has beenfound the forward and backward substitution equations can be used to evaluate the nodal temperatures at time
level m
+
1. This procedure yields considerably moreaccurate results than can be achieved by the more usual apparent heat capacity methods of treating phase change. At the same time the only additional calculation required over that normally needed to solve [B.4] by Gaussian elimination is that involved in the solution of [B .5]. As a result, the method is highly efficient. Equation [BS] requires modification to allow the phase plane to move
across the element boundaries
Xp
andXP+'.
Furthermodification of the method is required in order to treat cases involving more than one phase plane. In the calcu- lations presented here this was done by noting that at a phase interface the heat flux from within the region bounded by two phase planes diminishes rapidly since the temperatures in this zone quickly approach the freez- ing point. Thus the corresponding heat flux term on the right-hand side of [ B S ] can be ignored without serious loss of accuracy and the progress of the two phase planes can be treated independently. Further details of this method and the modifications required may be found in the paper by Goodrich (1978).