HAL Id: hal-01089605
https://hal.archives-ouvertes.fr/hal-01089605
Submitted on 2 Dec 2014
HAL is a multi-disciplinary open access
archive for the deposit and dissemination of
sci-entific research documents, whether they are
pub-lished or not. The documents may come from
teaching and research institutions in France or
abroad, or from public or private research centers.
L’archive ouverte pluridisciplinaire HAL, est
destinée au dépôt et à la diffusion de documents
scientifiques de niveau recherche, publiés ou non,
émanant des établissements d’enseignement et de
recherche français ou étrangers, des laboratoires
publics ou privés.
altitudinal limit of trees
Guillaume Charrier, Hervé Cochard, Thierry Ameglio
To cite this version:
Guillaume Charrier, Hervé Cochard, Thierry Ameglio. Evaluation of the impact of frost resistances
on potential altitudinal limit of trees. Tree Physiology, Oxford University Press (OUP): Policy B
-Oxford Open Option B, 2013, 33, pp.891 - 902. �10.1093/treephys/tpt062�. �hal-01089605�
© The Author 2013. Published by Oxford University Press. All rights reserved. For Permissions, please email: journals.permissions@oup.com Tree Physiology 33, 891–902
doi:10.1093/treephys/tpt062
Evaluation of the impact of frost resistances on potential
altitudinal limit of trees
Guillaume Charrier
1,2,3, Hervé Cochard
1,2and Thierry Améglio
1,2,41INRA, UMR547 PIAF, F-63100 Clermont-Ferrand, France; 2 Clermont Université, Université Blaise Pascal, UMR547 PIAF, F-63100 Clermont-Ferrand, France; 3Present address:
Department of Botany, University of Innsbruck, Sternwartestr. 15, A-6020 Innsbruck, Austria; 4Corresponding author UMR PIAF (INRA—Univ. Blaise Pascal), Site INRA de
Crouël, 5, chemin de Beaulieu, F-63039 Clermont-Ferrand, Cedex 2, France (Thierry.Ameglio@clermont.inra.fr)
Received March 11, 2013; accepted July 19, 2013; published online September 19, 2013; handling Editor Roberto Tognetti
Winter physiology of woody plants is a key issue in temperate biomes. Here, we investigated different frost resistance mecha-nisms on 1-year-old branches of 11 European tree species from November until budburst: (i) frost hardiness of living cells (by electrolyte leakage method), (ii) winter embolism sensitivity (by percentage loss of conductivity: PLC) and (iii) phenologi-cal variation of budburst (by thermal time to budburst). These ecophysiologiphenologi-cal traits were analyzed according to the poten-tial altitudinal limit, which is highly related to frost exposure. Seasonal frost hardiness and PLC changes are relatively
different across species. Maximal PLC observed in winter (PLCMax) was the factor most closely related to potential altitudinal
limit. Moreover, PLCMax was related to the mean hydraulic diameter of vessels (indicating embolism sensitivity) and to osmotic
compounds (indicating ability of living cells to reill xylem conducting elements). Winter embolism formation seems to be counterbalanced by active reilling from living cells. These results enabled us to model potential altitudinal limit according to three of the physiological/anatomical parameters studied. Monitoring different frost resistance strategies brings new insights to our understanding of the altitudinal limits of trees.
Keywords: budburst, frost hardiness, living cell, tree ecophysiology, winter embolism.
Introduction
Tolerance to wintertime freezing is a key factor limiting plant
survival and distribution in many ecosystems (Sakai and Larcher
1987, Pockman and Sperry 1997, Ewers et al. 2003). The abil-ity of plants to survive freezing hinges on the resistance of
liv-ing tissues and the non-livliv-ing water transport system (Pratt
et al. 2005). During winter, perennial plants are able to increase the tolerance of perennial parts and avoid frost exposure of sensitive parts (e.g., leaves). Freezing avoidance in buds is often considered a crucial parameter to escape late freezing
events in spring (Leinonen and Hänninen 2002), when high
hydration makes them especially sensitive (Rodrigo 2000).
On the one hand, plants can suffer damage (lethal in extreme cases) when intracellular water freezes or extracellular freezing
of sap dehydrates cells to dangerous levels (Sakai and Larcher
1987, Améglio et al. 2001a). Perennial plants from temperate
regions have thus developed the ability to dramatically modulate their resistance to freezing temperatures. Cold hardening starts late in the growing season as day length shortens and
tempera-ture decreases (Huner et al. 1998, Li et al. 2003). These
envi-ronmental cues trigger a series of physiological and biochemical
changes that induce higher resistance in the plant (Levitt 1980).
Carbohydrate dynamics (especially inter-conversion of starch to soluble sugars) have been extensively investigated in terms of
their relationship to frost resistance (Siminovitch et al. 1953,
Sakai 1966, Morin et al. 2007, Poirier et al. 2010). Many studies also proved that water content decreases when plants harden (Chen and Li 1976, Ögren 1999, Gusta et al. 2004).
Research paper
at INRA Avignon on November 4, 2013
http://treephys.oxfordjournals.org/
Downloaded from
at INRA Avignon on November 4, 2013
http://treephys.oxfordjournals.org/
Downloaded from
at INRA Avignon on November 4, 2013
http://treephys.oxfordjournals.org/
Downloaded from
at INRA Avignon on November 4, 2013
http://treephys.oxfordjournals.org/
Downloaded from
at INRA Avignon on November 4, 2013
http://treephys.oxfordjournals.org/
Downloaded from
at INRA Avignon on November 4, 2013
http://treephys.oxfordjournals.org/
Downloaded from
at INRA Avignon on November 4, 2013
http://treephys.oxfordjournals.org/
Downloaded from
at INRA Avignon on November 4, 2013
http://treephys.oxfordjournals.org/
Downloaded from
at INRA Avignon on November 4, 2013
http://treephys.oxfordjournals.org/
Downloaded from
at INRA Avignon on November 4, 2013
http://treephys.oxfordjournals.org/
Downloaded from
at INRA Avignon on November 4, 2013
http://treephys.oxfordjournals.org/
Downloaded from
at INRA Avignon on November 4, 2013
http://treephys.oxfordjournals.org/
On the other hand, geographical distribution of plants is
related to frost-induced embolism (Langan et al. 1997,
Pock man and Sperry 1997). Winter embolism is a consequence
of consecutive freeze–thaw cycles (Zimmermann 1983, Tyree
and Cochard 1996, Pockman and Sperry 1997). When sap freezes, dissolved gases escape due to their very low solubility
in ice (Sperry and Sullivan 1992), and these bubbles can either
dissolve back into the xylem sap or expand into the xylem
con-duit (Yang and Tyree 1992). Mean conduit diameter is often
related to winter embolism sensitivity (Davis et al. 1999,
Sperry and Robson 2001, Pittermann and Sperry 2003, 2006). For coniferous species with narrow xylem conducting ele-ments, freezing events generally cause little damage to xylem (Sperry and Sullivan 1992), but Mayr et al. (2007) observed that low water potential and numerous freeze–thaw events are critical. In ring-porous species with wide xylem conducing
ele-ments, such as Quercus (Cochard and Tyree 1990) or Fraxinus
(Cochard et al. 1997), a single freeze–thaw event can embo-lize most xylem conduits. In diffuse-porous species (intermedi-ate diameters), the loss of hydraulic conductivity generally
increases progressively during winter, as in Acer (Sperry and
Sullivan 1992) or Fagus (Borghetti et al. 1993, Cochard et al. 2001).
Different sap circulation restoring mechanisms have been
characterized to date (Cochard et al. 2001, Cruiziat et al.
2002), including the development of new functional vessels
and/or active reilling (Ewers et al. 2001). Several authors
(Sperry et al. 1987, 1988, Hacke and Sauter 1996, Améglio et al. 2004) have investigated vessel reilling through positive pressures in xylem. Some species (i.e., Juglans or Acer) exhibit positive pressures in xylem sap during winter related to high
sugar contents and osmolarity (Améglio and Cruiziat 1992,
Améglio et al. 1995, 2001b). Positive pressures in xylem sap
related to mineral nutrition and soil temperature are also
observable in autumn or spring (Ewers et al. 2001), whereas in
several species (mainly ring-porous and conifer species), posi-tive pressure has never been observed.
Most studies performed on frost damages have been limited to a narrow focus: either living-cell frost resistance, hydraulic resistance to winter embolism or avoidance of spring frosts depending on timing of budburst. However, xylem embolism sensitivity, for instance, is not an exclusively physical process; as freezing-induced damages to aboveground parts may limit
xylem reilling by stem-pressure mechanism (Améglio et al.
2001b) but not root-pressure mechanism (except in some
harsh conditions; Zhu et al. 2002). Here, we monitored
differ-ent types of frost resistance (vessels, living cells and timing of budburst) in several common European tree species. These species were chosen according to their differences in distribu-tion (e.g., maximal altitudinal limit as recorded in France;
Rameau et al. 1989, 1993), which we hypothesized would be closely related to frost sensitivities. We expect that these
different species exposed to similar frost pressure (growing in the same local area) would present a signiicant enough inter-speciic variability in physiology to provide clues to under-standing their potential altitudinal limits:
(i) hydraulic resistance is expected to be related to anatomi-cal parameters,
(ii) living-cell resistance is expected to be related to osmotic compounds,
(iii) osmotic compounds are also expected to be involved in embolism reilling ability.
According to these relations, we expect to highlight the general mechanisms driving the altitudinal limit of trees.
Materials and methods
Plant materials
The trees were growing in two sites near Clermont-Ferrand (central France): (i) Fontfreyde (45°41′58″N, 2°59′55″E, 875 m a.s.l.) and (ii) Crouël (45°46′27″N, 3°8′36″E, altitude 338 m a.s.l.). Minimal temperatures were relatively similar between the two sample sites: with an average difference of 2.1 °C from November to April. In Fontfreyde, we sampled birch (Betula
pendula Roth), beech (Fagus sylvatica L.), Scots pine (Pinus sylvestris L.), common oak (Quercus robur L.), hazelnut (Corylus avellana L.) and hybrid walnut (Juglans regia L. × Juglans nigra L.).
In Crouël, we sampled sycamore (Acer pseudoplatanus L.), alder (Alnus cordata (Loisel.) Duby), hornbeam (Carpinus betulus L.), plum (Prunus cerasifera Ehrh.) and black locust (Robinia
pseudo-acacia L.) (Table 1). We sampled 1-year-old branches on three different trees from each species at four dates: (i) in autumn (8
November), (ii, iii) twice in mid-winter (16 January and 13
February) and (iv) at speciic budburst date for each species.
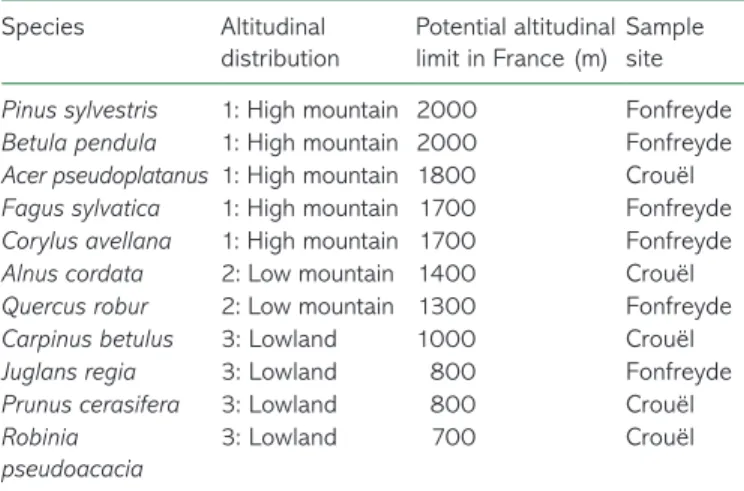
Table 1. Studied tree species, altitudinal distribution, potential altitudi-nal limit in France (cf. Rameau et al. 1989, 1993) and sampling site: Fonfreyde (875 m a.s.l.) and Crouël (338 m a.s.l.).
Species Altitudinal distribution Potential altitudinal limit in France (m) Sample site
Pinus sylvestris 1: High mountain 2000 Fonfreyde Betula pendula 1: High mountain 2000 Fonfreyde Acer pseudoplatanus 1: High mountain 1800 Crouël Fagus sylvatica 1: High mountain 1700 Fonfreyde Corylus avellana 1: High mountain 1700 Fonfreyde Alnus cordata 2: Low mountain 1400 Crouël Quercus robur 2: Low mountain 1300 Fonfreyde Carpinus betulus 3: Lowland 1000 Crouël Juglans regia 3: Lowland 800 Fonfreyde Prunus cerasifera 3: Lowland 800 Crouël Robinia
pseudoacacia
Tree Physiology Online at http://www.treephys.oxfordjournals.org
Electrolyte leakage test
We performed frost hardiness tests on 1-year-old branches at
every date on each tree (Zhang and Willison 1987, Sutinen
et al. 1992, Charrier and Améglio 2011). We cut the samples into six 5-cm-long pieces without buds. Different pieces were cooled down to one of four sub-zero temperatures or used for two controls (unfrozen and frozen at −75 °C). In temperature-controlled boxes, cooling and warming cycles were computer-controlled by a circulator bath (Ministat Huber, Offenburg, Germany) with an external Pt100 probe in the chamber.
Freezing was applied at a steady rate of −5 K h−1 down to −10,
−20, −30 °C and either −5 °C in November and spring or −40 °C in winter. Air temperature was then held at a minimal
temperature for 1 h, followed by thawing at a rate of 5 K h−1
back to 5 °C. Temperatures were recorded on a datalogger (Campbell, Logan, UT, USA) as 1-min averages. In addition, an unfrozen control was stored at +5 °C (control) and another control was stored in a freezer at −80 °C with freezing rate ca.
−7 K h−1.
After freezing treatment, we cut the samples into 5-mm-long sections and put them into glass vials with 15 ml of distilled-deionized water. The vials were shaken for 24 h at +5 °C (to limit bacterial development) on a horizontal gravity shaker (ST5, CAT, Staufen, Germany). We measured electrolytic conductivity
of the solution (C1) at room temperature with a conductimeter
(Held Meter LF340, TetraCon® 325, Weilheim, Germany).
After autoclaving at +120 °C for 30 min and cooling down to
room temperature, we measured conductivity again (C2).
Relative electrolytic leakage (REL) was calculated as C1/C2 as
described in Zhang and Willison (1987). We assumed the
fol-lowing relationship between REL and the percentage of cellular lyses (L) for each sample:
REL e = +
(
(− ))
+ a d b c 1 θ (1)where θ is the test temperature, parameters a and d deine asymptotes of the function and b is the slope at inlection point c. Frost hardiness level was estimated as the temperature of the inlection point (c) of the adjusted logistic sigmoid function
(Eq. (1)) (Repo and Lappi 1989). Parameter estimation was
per-formed by non-linear regression using ExcelStat ver. 7.5.2.
Hydraulic conductivity of the non-living water transport system
We immediately immersed the bottom of the 1-m-long branches under water until we measured hydraulic conductance using the Xyl’em device (Bronkhort, Montigny-les-Cormeilles, France,
licenced INRA; see Cochard et al. 2000 for details). We cut
7-cm-long samples on 1-year-old segments (n = 3/species) immersed under water to prevent air entry into vessels. The extremities were cut again with a scalpel to form a sharp end.
We irst measured initial conductance (ki) using a solution of
KCl 0.1 mol l−1 at low pressure (0.350 kPa). After perfusion of
the same solution at high pressure (140 kPa) for embolism resorption, we measured the conductance several times until
maximal conductance (kmax) was reached. Percentage loss of
conductivity (PLC) was calculated as (kmax − ki)/kmax.
Water content and sap osmolarity
We extracted xylem sap from samples (40-cm-long, n = 3 per
species) using a vacuum pump (Bollard 1953). Extracted sap
was weighed (SW) (Améglio et al. 2002) and osmolarity was
measured with a Roebling 13DR automatic osmometer (Messtechnik, Berlin, Germany). After xylem sap extraction, sample fresh weights (FW) were measured, before being dried for 7 days at 80 °C and weighed (DW). Water content was cal-culated as: (FW + SW − DW)/DW.
Extraction and quantiication of soluble carbohydrates
We mixed 50 mg of lyophilized ground samples with 1 ml of
man-nitol solution (5 g l−1) in 80% ethanol, shaken for 30 min at 80 °C,
then centrifuged (10 min, 15,775 g, 20 °C, SR2000, Prolabo, Fontenay-sous-bois, France). We iltered the supernatant in a car-tridge containing AGX-1 anion-exchange resin (150 µl), polyvinyl-polypyrrolidone (100 µl) and activated charcoal (200 µl). We mixed the solid three times with 80% ethanol (1 ml), 50% ethanol (0.5 ml) and 80% ethanol (0.5 ml) before rinsing the cartridge with 80% ethanol (1 ml). We dried liquid fraction for carbohydrate analysis and solid fraction for starch analysis.
For carbohydrate analysis, we dissolved each sample in 0.5 ml water and separated them on an Aminex-HPX87C col-umn coupled with a refractometer (R12000, Sopares, Gentilly, France). To measure starch content, we mixed the solids with NaOH 0.02 N and autoclaved them (2 h, 120 °C, 1 bar). We incubated the samples with amyloglucosidase (1.5 h, 52 °C) in
a 96-well microplate, with 12 µl ATP (5 × 10⁻⁴ mol l−1), 12 µl
NADP (1.4 × 10⁻⁴ mol l−1), 60 µl triethanolamine buffer
(trieth-anolamine 0.48 mol l−1, magnesium sulfate 1 × 10⁻² mol l−1,
pH = 7.6), 96 µl water and 12 µl of sample supernatant in each well. We measured the absorbance at 340 nm (Power Wave 200, BioTek Instruments, Thiais, France) as a blank and after
incubation with 10 µl of hexokinase/glucose-6-phosphate
dehydrogenase (EC1.1.1.49) for 40 min under shaking.
Mean vessel diameter
We sliced the samples in 20-µm-thick cross-sections on a
cryomicrotome (Reichert-Jung,2030, Vienna, Austria) with a
platinum-cooled Peltier and sandwiched under glass coverslips. We sliced two cross-sections per individual on different branches (n = 6 per species). We took digital photos of the vessels (magni-ication: ×400) and processed them using the ImageJ software (http://rsb.info.nih.gov/ij). We calibrated between the samples using micrometer photos at the same magniication. We calculated
the mean hydraulic diameter (Dh) from individual vessel diameter
(D) as: ΣD5/ΣD4. The hydraulic diameter is relevant for hydraulic
conductance within a branch (Davis et al. 1999).
Phenological and climate data
We checked, every 2 days, on ive branches per tree species buds phenological stages. Date when 50% of the buds that would eventually break had reached stage 10 on the BBCH
scale was calculated as the day of budburst (Meier 2001). We
monitored daily maximum and minimum air temperature for each sample site by governmental weather stations (Meteo France): Saint-Genes-Champanelle: 45°43′7.58″N, 3°1′0.57″E and Aulnat: 45°47′12.67″N, 3°8′57.30″E. We calculated ther-mal time from 1 January until day of budburst in degree-days
(DD; Arnold 1959) as: Σ(Tmean − 5) (if Tmean > 5 °C).
Statistical analyses and modeling
We calculated linear regression and P values using R
soft-ware (R Development Core Team 2005). We performed
anal-ysis of variance (ANOVA) and subsequent post hoc Fisher’s test (least-signiicant difference (LSD)) to determine signii-cant differences between groups with α = 0.05. For correla-tion tests, we used Spearman’s non-parametric test with α = 0.05 after testing for normality of distribution with a Shapiro–Wilk test.
We modeled potential altitudinal limit by multiple linear
regression itted by R2 minimization using the lm function in the
R software. Selection of the best model was based on
signii-cance of parameters with higher adjusted R2 and lower
Bayesian information criterion (BIC), which qualitatively com-pare models according to maximum likelihood and parsimony.
Results
Frost resistance of living cells
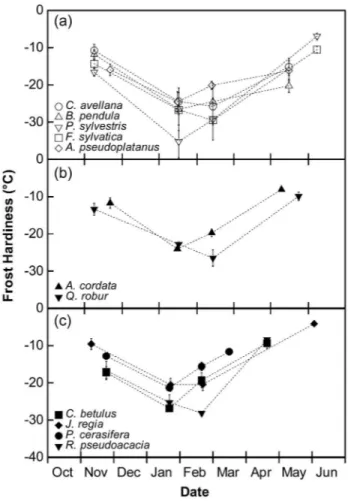
Frost hardiness for all of the species increased from November until deep winter (frost hardening period) then decreased until
budburst (dehardening) in all groups: high-mountain (Figure 1a),
low-mountain (Figure 1b) and lowland species (Figure 1c). In
mid-winter, mean maximal frost hardiness (FHMax) was
−24.4 ± 1.0 °C in the lowland species group, which was similar to the low-mountain species group (−25.4 ± 1.1 °C) and lower than the high-mountain species group (−31.7 ± 1.3 °C). In this
group, P. sylvestris presented a very strong FHMax in winter
(−39.7 ± 0.7 °C), but the difference was still signiicant (Fisher’s LSD test; P = 0.032) without this species.
During winter, changes in frost hardiness were negatively correlated with starch content dynamics for all of the species except A. cordata, A. pseudoplatanus, C. betulus and P. cerasifera
(Table 2). Soluble carbohydrate content increased with
increas-ing frost hardiness except in B. pendula, C. avellana and P. sylvestris. Water content was only signiicantly correlated to frost hardiness
Figure 1. Seasonal change in frost hardiness (°C) of tree species according to their altitudinal distribution: high-mountain and sub-mountain species (a), low-sub-mountain species (b) and lowland species (c). Symbols and bars represent mean and standard errors of three replicates.
Table 2. Correlation between changes in frost hardiness and in starch content (mg g−1 DW), soluble carbohydrates content (mg g−1 DW) or
water content (g g−1 DW) in different species. Numbers represent
Spearman’s correlation coeficient and symbols signiicance of correla-tion: P > 0.05; *P < 0.05; **P < 0.01; ***P < 0.001. Numbers 1–3 refer to altitudinal distribution as in Table 1. Numbers in italics indicate that the correlation is not signiicant.
Species Starch content Soluble carbohydrates content Water content 1 P. sylvestris 0.698* 0.173 0.651* B. pendula 0.618* −0.484 −0.188 A. pseudoplatanus −0.067 −0.648* 0.181 F. sylvatica 0.634* −0.855*** 0.423 C. avellana 0.626* −0.553 −0.081 2 A. cordata −0.269 −0.797** 0.333 Q. robur 0.590* −0.807** 0.251 3 C. betulus 0.292 −0.867*** 0.647* J. regia × nigra 0.746** −0.907*** 0.578* P. cerasifera 0.148 −0.801** 0.305 R. pseudoacacia 0.643* −0.583** 0.124
Tree Physiology Online at http://www.treephys.oxfordjournals.org
in C. betulus, J. regia × nigra and P. sylvestris. Finally, across
species, FHMax was highly correlated with total non-structural
carbohydrate content in November (NSCNov: starch + soluble
carbohydrates, r = −0.48; P = 0.005).
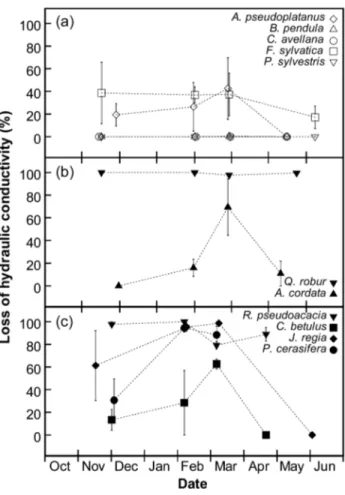
Frost resistance to embolism
In the high-mountain species group, PLC remained null through winter for C. avellana, B. pendula and P. sylvestris, and maximal
PLC (PLCMax) was 43% for A. pseudoplatanus and 39% for
F. sylvatica (Figure 2a). In the low-mountain species group,
PLCMax was higher than 60% (Figure 2b). Seasonal changes
also contrasted across species. In Q. robur, PLC was 100% after the irst freeze–thaw cycle, while for A. cordata, PLC increased in winter and decreased just before budburst. In
lowland species (Figure 2c), PLCMax was higher than 60% for
the four species with either 100% embolism after the irst freeze–thaw cycle or increase in PLC during winter followed by a decrease before budburst.
We observed three different patterns of hydraulic frost resis-tance: (i) complete resistance (B. pendula, C. avellana and
P. sylvestris), (ii) complete sensitivity (Q. robur and R.
pseudo-acacia) and (iii) an increase of embolism during winter followed
by a decrease before budburst (A. cordata, A. pseudoplatanus,
C. betulus, F. sylvatica and J. regia × nigra). Furthermore, PLC
generated by one freeze–thaw cycle in November (PLCAFC) is
related to mean hydraulic diameters of xylem conducing
ele-ments with a threshold in sensitivity around 30 µm (Figure 3).
Among species exhibiting total or partial embolism repair, only F. sylvatica and J. regia × nigra signiicantly increased sap osmolarity during the winter compared with autumn or spring
(Figure 4a). At budburst, B. pendula, C. betulus, C. avellana and
P. cerasifera also signiicantly increased osmolarity. Osmolarity was highly correlated to osmotic pressure generated by
solu-ble carbohydrate (r = 0.89; P < 0.001; Figure 4b), explaining
76% of the variance in osmotic pressure.
Relation with potential altitudinal limit
Frost avoidance to late frost, evaluated based on thermal time to budburst (TT) in DD from 1 January until budburst, was early for
B. pendula, C. avellana, P. cerasifera and Q. robur
(150 < TT < 250DD), but late for P. sylvestris, F. sylvatica,
C. betulus, R. pseudoacacia, A. cordata and A. pseudoplatanus
(250 < TT < 350DD) and even later for J. regia × nigra
(TT > 350DD). However, we found no signiicant correlation in
either potential altitudinal limit (r = −0.28; P = 0.12), PLCMax
(r = 0.34; P = 0.054), FHMax (r = 0.33; P = 0.064) or PLCAFC
(r = 0.30; P = 0.089) (Table 4).
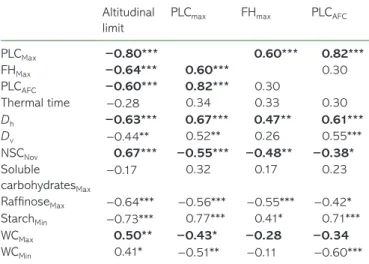
Signiicant correlations between parameters (see Table 4) were
used to model potential altitudinal limits depending on the
eco-physiological parameters (PLCMax, PLCAFC, FHMax and/or TT) or
physiological parameters (Dh, NSCNov, StarchMin, RafiMax, WCMax
and/or WCMin). According to the ecophysiological parameters, the
most signiicant and parsimonious model (R2
adj = 0.602;
P < 0.001; and BIC = 478.89) was dependent on only one
param-eter, PLCMax (Table 5). As PLCMax appeared strongly correlated to
both FHMax and PLCAFC (R2 = 0.774; P < 0.001) without correlation
Frost resistances and altitudinal limit of trees 895
Figure 2. Seasonal change in PLC of tree species according to their altitudinal distribution: high-mountain and sub-mountain species (a), low-mountain species (b) and lowland species (c). Symbols and bars represent mean and standard error of three replicates.
Figure 3. Relationship between PLC after one freeze-thaw cycle and mean hydraulic diameter of vessels. The dotted line plots the sigmoid it of data.
across them (R2 = 0.082; P = 0.105), potential altitudinal limit was
also modeled based on signiicantly correlated physiological and/
or anatomical parameters (Dh, NSCNov, StarchMin, RafiMax, WCMax
and WCMin; Table 4). All of the parameters were signiicant, and the
most signiicant and parsimonious model was obtained with three
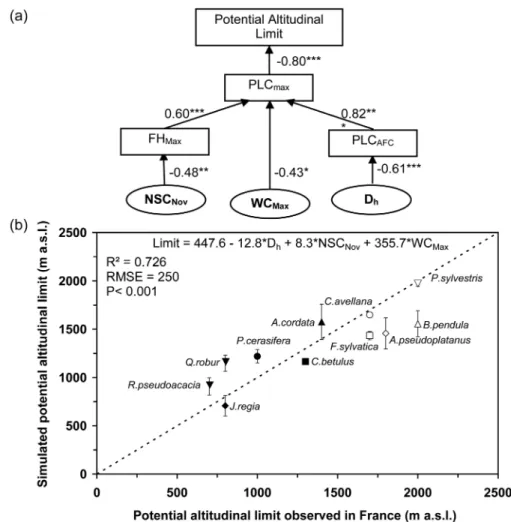
of them: Dh, NSCNov and WCMax (P < 0.001; R2adj = 0.726 and
BIC = 471.28; Table 5). Other parameters did not signiicantly
improve the model. These results suggest that Dh, NSCNov and
WCMax could have an indirect effect on potential altitudinal limit via
direct causal relationship with PLCMax, PLCAFC or FHMax as
indi-cated (Figure 5a). The best model explained 73% of the variance
with RMSE = 250 m (Figure 5b).
Discussion
Frost resistance of living cells
Electrolyte leakage is widely used as a method to monitor frost
hardiness in different tissues (Sutinen et al. 1992, Charrier and
Améglio 2011, Stattin et al. 2012). All of the species harden in autumn and deharden prior to budburst. The timing of frost hardening or dehardening development (date of beginning, end and rate) could have been useful to evaluate potential risks in autumn or spring, but would require far more sampling dates
on all 11 species. Here, we focused on FHMax (in January or
February) as a good descriptor of speciic maximal resistance
level (Larcher and Mair 1968, Nilsson and Walfridsson 1995,
Morin et al. 2007). At the intra-speciic level, FHMax has never
been observed to differ signiicantly among environmental
con-ditions (Larcher and Mair 1968, Bower and Aitken 2006,
Figure 4. (a) Sap osmolarity of species measured wherever possible during winter. Letters indicate signiicantly different groups within a given species by ANOVA and Fisher’s test (LSD) with α = 5%. (b) Relationship between sap osmolarity and soluble sugar concentration (glucose, fruc-tose and sucrose: GFS) measured from xylem sap in species that increased PLC during winter then decreased PLC before budburst. The GFS is expressed in osmotic pressure units as calculated from total con-centration of the three component sugars. The coeficient of determina-tion (R2 = 0.871, P < 0.001) of the linear regression is presented.
Table 3. Thermal time ± SE (in DD base 5 °C) calculated from 1 January until budburst for different species (if Tmean > 5 °C: TT = Σ(Tmean − 5)).
Numbers 1–3 refer to altitudinal distribution as in Table 1.
Species Thermal time for budburst (DD) 1 P. sylvestris 300 ± 0 B. pendula 155 ± 0 A. pseudoplatanus 342 ± 39 F. sylvatica 300 ± 0 C. avellana 155 ± 0 2 A. cordata 305 ± 26 Q. robur 222 ± 1 3 C. betulus 304 ± 14 J. regia × nigra 402 ± 2 P. cerasifera 175 ± 5 R. pseudoacacia 307 ± 12
Table 4. Correlation coeficients according to Spearman’s test between potential altitudinal limit or frost resistance-related parame-ters (maximal PLC (PLCMax), frost hardiness (FHMax) or PLC after one
freeze–thaw cycle (PLCAFC)) and frost resistance-related parameters
(PLCMax, FHMax, PLCAFC, and thermal time) or physiological parameters
(diameter of vessels hydraulically weighted (Dh) or not (Dv),
non-structural carbohydrate in November (NSCNov), maximal soluble
car-bohydrate content (Soluble carcar-bohydratesMax), maximal rafinose
content (RafinoseMax), minimal starch content (StarchMin) and minimal
or maximal water content (WCMin and WCMax, respectively)).
Signiicance of correlation is indicated by: *P < 0.05; **P < 0.01; ***P < 0.001 and the relationships used for altitudinal limit modeling are in bold (cf. text and Figure 5).
Altitudinal limit
PLCmax FHmax PLCAFC
PLCMax −0.80*** 0.60*** 0.82*** FHMax −0.64*** 0.60*** 0.30 PLCAFC −0.60*** 0.82*** 0.30 Thermal time −0.28 0.34 0.33 0.30 Dh −0.63*** 0.67*** 0.47** 0.61*** Dv −0.44** 0.52** 0.26 0.55*** NSCNov 0.67*** −0.55*** −0.48** −0.38* Soluble carbohydratesMax −0.17 0.32 0.17 0.23 RafinoseMax −0.64*** −0.56*** −0.55*** −0.42* StarchMin −0.73*** 0.77*** 0.41* 0.71*** WCMax 0.50** −0.43* −0.28 −0.34 WCMin 0.41* −0.51** −0.11 −0.60***
Tr e e P h ys io lo g y O n lin e at h tt p :// w w w .tr e e ph ys .o xf or d jo u rn a ls .or g F ro st r e sis ta n ce s a n d a lti tu d in a l li m it o f tr e e s 8 97
Table 5. Comparison between different models of potential altitudinal limit depending on ecophysiological (PLCMax, FHMax, PLCAFC and TT) or physiological/anatomical parameters
(Dh, NSCNov, WCMax, WCMin, RafiMax and StarchMin). RSE, adjusted R2, degree of freedom, F-statistic, P-values, BIC and degrees of signiicance of different variables (***, <0.001; **, <0.01; *,
<−0.05;>−0.05) are indicated. Altitudinal limit
depending on
Ecophysiological parameters
PLCMax FHMax PLCAFC TT df F-stat P value RSE R2 R2adj BIC
6.93e−8*** – – – 31 49.33 6.93e−8 301.6 0.614 0.602 478.89
– 2.02e−5*** – – 31 25.22 2.02e−5 360.6 0.449 0.431 490.66
– – 1.65e−3** – 31 11.88 1.65e−3 412.8 0.277 0.254 499.60
– – – 0.16 31 2.07 0.160 470.1 0.063 0.032 508.17
5.04e−4*** 0.211 – – 30 25.99 2.83e−7 298.6 0.634 0.610 480.63
– 8.90e−5*** 6.67e−3** – 30 19.90 3.15e−6 323.6 0.570 0.542 485.93
0.028* 0.183 0.607 – 29 16.99 1.47e−6 302.3 0.637 0.600 483.82
0.025* 0.237 0.701 0.522 28 12.59 5.51e−6 305.4 0.643 0.592 486.83
Physiological/ anatomical parameters
Dh NSCNov WCMax WCMin RafiMax StarchMin
7.96e−6*** – – – – – 31 28.58 7.96e−6 350.3 0.480 0.463 488.75 – 7.93e−6*** – – – – 31 28.59 7.93e−6 350.2 0.480 0.463 488.74 – – 9.90e−4*** – – – 31 13.23 9.90e−4 406.5 0.299 0.277 498.58 – – – 4.24e−3** – – 31 9.53 4.24e−3 424.7 0.235 0.210 501.46 – – – – 1.76e−4*** – 31 18.15 1.76e−4 385.6 0.369 0.349 495.10 – – – – – 1.52e−5*** 31 26.22 1.52e−5 357.4 0.458 0.441 490.08
5.37e−5*** 5.35e−5*** – – – – 30 35.11 1.39e−8 270.1 0.701 0.681 474.00
2.36e−3** 2.16e−5*** 0.020* – – – 29 29.33 6.37e−9 250.0 0.752 0.726 471.28
2.51e−4*** 7.56e−5*** – 0.048* – – 29 27.35 1.34e−8 256.6 0.739 0.712 472.99
7.82e−5*** 5.15e−3** – – 0.088 – 29 26.09 2.21e−8 261.0 0.730 0.702 474.13
1.46e−4** 9.72e−4*** – – – 0.100 29 25.84 2.44e−8 261.9 0.728 0.700 474.36
2.43e−3** 4.75e−5*** 0.186 0.572 – – 28 21.56 3.26e−8 252.9 0.755 0.720 474.39
4.36e−3** 4.47e−3** 0.087 0.770 0.043* – 27 20.31 2.18e−8 238.5 0.790 0.751 472.80
Charrier et al. 2011). Even though small differences are observed across ecotypes, inter-speciic variability is higher.
FHMax was correlated to NSCNov (Table 4), as already described
by Morin et al. (2007) in Quercus. Non-structural carbohydrate contents are the main components of plant carbon balance (Chapin et al. 1990, Le Roux et al. 2001) and indicate carbon
limitation in timberline ecotones (Körner 1998, Hoch and Körner
2003, Shi et al. 2008, Bansal and Germino 2009). Non-structural carbohydrate contents play an active role in frost
har-diness via starch hydrolysis into soluble sugars (Sakai 1966,
Sauter et al. 1996, Améglio et al. 2004, Poirier et al. 2010) or, in
P. sylvestris, other compounds such as amino acids, lipids or
macromolecules (Lasheen and Chaplin 1971, Zwiazek et al.
2001). Frost hardiness is also related to rafinose in
angio-sperms (Thomas et al. 2004) and conifers (Strimbeck et al.
2008). Water content changes were only signiicant for a few
species (e.g., C. betulus, J. regia × nigra and P. sylvestris), although the relationship has been demonstrated in many other
studies (Tanino et al. 1990, Ögren 1999, Gusta et al. 2004,
Charrier and Améglio 2011).
Frost resistance to embolism of non-living water transport systems
Some species are highly embolism resistant (B. pendula,
C. avellana and P. sylvestris), whereas others are highly
embo-lism sensitive (Q. robur and R. pseudoacacia). Freeze–thaw-induced cavitation may be considered a purely physical process
due to water potential deicit (Mayr and Charra-Vaskou 2007),
number of freeze–thaw cycles (Mayr et al. 2007) and diameter
of xylem vessels (Davis et al. 1999, Pratt et al. 2005). Thus, PLC
observed after one freeze–thaw event (PLCAFC) appears strongly
correlated to large mean hydraulic diameter of vessels (Dh Figure
3) and low minimal water content (WCMin Table 4). Without water
stress, woody plants with Dh lower than 30 µm are resistant to
freeze–thaw-induced cavitation, whereas those with Dh higher
than 30 µm are sensitive (Davis et al. 1999). So far, this
thresh-old in sensitivity is mainly observed on cavitation induced in the
lab (Pittermann and Sperry 2003, Pratt et al. 2005, Stuart et al.
2007, Pittermann 2010), but it has also been observed from
data collected in ield conditions at intra-speciic (Schreiber et al.
2013) or inter-speciic level (Figure 3).
Figure 5. Schematic representation of how the most signiicant parameters are linked in relation to potential altitudinal limit. PLCMax, maximal loss
of hydraulic conductivity in winter; FHMax, maximal frost hardiness; PLCAFC, loss of hydraulic conductivity after one freeze–thaw cycle; NSCNov,
non-structural carbohydrates in November; Dh, hydraulically weighted mean diameter of vessels; WCMin, minimal water content (a). Relationship between
Tree Physiology Online at http://www.treephys.oxfordjournals.org
In winter, some species are able to actively reill their vessels via
water movements (Sakr et al. 2003). Here, we could not
differen-tiate stem xylem pressure (Améglio et al. 2001b, 2004) and root
xylem pressure (Ewers et al. 2001) as xylem pressure was not
monitored. Root pressure is a probable mechanism of embolism repair in species that signiicantly decreased PLC before budburst
(Figure 2: A. pseudoplatanus, A. cordata, C. betulus, F. sylvatica
and J. regia × nigra). It has been identiied in A. pseudoplatanus, F.
sylvatica and J. regia × nigra but the results suggest it could be
more widely distributed than these few observations indicate.
Sap osmotic pressure (Figure 4a) and sap-soluble
carbohy-drate content dynamics (Figure 4b) indicate that stem
pres-sure could be involved in reilling in F. sylvatica and
J. regia × nigra during winter and probably also in B. pendula at
the budburst. Surprisingly, this relationship was not observed for A. pseudoplatanus despite carbohydrates being found in
xylem sap during winter (Milburn and Zimmermann 1986,
Tyree and Yang 1992, Cirelli et al. 2008).
Finally, correlations between PLCAFC and StarchMin, RafiMax or
NSCNov suggested that the sampling date was too late after the
freeze–thaw cycle (3 days) and that some species were already
reilling their vessels (as suggested in Figure 3 with F. sylvatica
and J. regia × nigra away from the curve). PLCmax is inluenced by
embolism formation (due to wide xylem elements) and reilling
ability, which depends on living cells. Thus, PLCMax is directly
related to vessel (PLCAFC) and living-cell (FHMax) resistances and
indirectly related to physiological or anatomical parameters
explaining these resistances (Dh, NSCNov, StarchMin, RafiMax,
WCMax and WCMin: Table 4).
Frost resistances and altitudinal limit
There was large inter-speciic variability in budburst date across species (3 months from 27 February until 27 May). Thermal time to budburst is spread from 155 DD in B. pendula or C.
avel-lana to 402 DD in J. regia × nigra (Table 3). We found no rela-tionship with potential altitudinal limit. This is surprising, but similar correlations (between day of budburst and location) have only previously been observed in intra-speciic comparisons
along a latitudinal (P. abies in Leinonen and Hänninen 2002) or
altitudinal gradient (A. pseudoplatanus, F. excelsior, Q. petrae and
F. sylvatica in Vitasse et al. 2009). Even if dormancy release is controlled by chilling exposure, some species are
chilling-insen-sitive (Morin et al. 2009). Ecodormancy could also be under
photoperiod control (Caffarra and Donelly 2011), which would
help avoid late freezing damages, and thus the risks limiting the impact on growing season length and carbon balance.
Carbon reserves are a crucial parameter involved in plant cell frost resistance and ability to reill embolized vessels. Vessel hydraulic integrity is the key physiological process in plant survival (Pratt et al. 2008, 2010). It is also related to altitudinal (Tyree and Cochard 1996, Langan et al. 1997, Pockman and Sperry 1997) or
latitudinal distribution of species (Stuart et al. 2007). However,
frost resistance to winter embolism can be addressed via two
dif-ferent focuses: physical resistance to embolism formation (PLCAFC)
and the resistance of living cells that can actively reill vessels
(FHmax). Very few studies have monitored hydraulic and living-cell
resistances concomitantly. Medeiros and Pockman (2010) found
that freezing tolerance increases in leaves and xylem under
drought conditions, but Feild and Brodribb (2001) arrived at the
opposite conclusion on 12 tree and shrub species from treeline in
Tasmania. Schreiber et al. (2013) found signiicant correlations
between anatomy, frost hardiness in late summer and growth abil-ity in a boreal planting environment in different hybrid poplar clones. Narrow vessels seem to be an important adaptive trait in frost-exposed environments.
According to our indings, hydraulic architecture integrity is
not only critical for trees under drought conditions (Choat et al.
2012), but also during winter freezing conditions. Based on the
correlations presented in Table 4, we modeled potential
altitudi-nal limit depending on ecophysiological or physiological
param-eters (Table 5). While wood anatomy (Dh) appears to be the
main driver of altitudinal limit, osmotic-related parameters
(GNSNov and WC) are also highly signiicant. This relation could
be generalized in different environmental conditions with geno-typic effect and interactions.
Conclusions
This study brings new insights into the physiology of frost resis-tances at the altitudinal limit of species distributions. To survive under extreme climatic conditions, both living cells and non-living water transport systems should be resilient to freezing events. Some clear interactions were observed between two processes (embolism and reilling) that hinge on the contribution of living cells undamaged by frost to the development of pressurization mecha-nisms. After freezing damage, a reduction in reilling ability could lead to reduced bud survival, inducing a loss of carbon (spent to build new structures and reducing carbon assimilation period). This study highlights some important traits (i.e., NSC content, sap osmolarity or mean diameter of vessels) that should be taken into consideration in studies on frost resistance strategies in trees.
Acknowledgments
The authors thank Christian Bodet and Christophe Serre for their help with REL and PLC data collection, and Brigitte Girard, Brigitte Saint-Joanis and Marc Vandame for their input on bio-chemical analysis. We also thank Auvergne Traduction Technique (A.-T.-T.) for proof reading the manuscript and anon-ymous reviewers for their helpful comments.
Conlict of interest
None declared.Funding
This work was supported in part by the INRA’s Agronomy and Environment Department and by an MRES PhD grant for G.C.
References
Améglio T, Cruiziat P (1992) Tension pressure alternation in walnut xylem sap during winter—the role of winter temperature. C R Acad Sci Paris Sér III 315:429–435.
Améglio T, Cruiziat P, Beraud S (1995) Alternance tension/pression de la sève dans le xylème chez le noyer pendant l’hiver. Conséquences sur la conductance hydraulique des rameaux. C R Acad Sci Paris Sér III 318:351–357.
Améglio T, Cochard H, Ewers FW (2001a) Stem diameter variations and cold hardiness in walnut trees. J Exp Bot 52:2135–2142. Améglio T, Ewers FW, Cochard H, Martignac M, Vandame M, Bodet
C, Cruiziat P (2001b) Winter stem xylem pressure in walnut trees: effects of carbohydrates, cooling and freezing. Tree Physiol 21:387–394.
Améglio T, Bodet C, Lacointe A, Cochard H (2002) Winter embolism, mechanisms of xylem hydraulic conductivity recovery and spring-time growth patterns in walnut and peach trees. Tree Physiol 22:1211–1220.
Améglio T, Decourteix M, Alves G, Valentin V, Sakr S, Julien JL, Petel G, Guilliot A, Lacointe A (2004) Temperature effects on xylem sap osmolarity in walnut trees: evidence for a vitalistic model of winter embolism repair. Tree Physiol 24:785–793.
Arnold CY (1959) The determination and signiicance of the base tem-perature in a linear heat unit system. Proc Am Soc Hortic Sci 74:430–445.
Bansal S, Germino MJ (2009) Temporal variation of nonstructural car-bohydrates in montane conifers: similarities and differences among developmental stages, species and environmental conditions. Tree Physiol 29:559–568.
Bollard EG (1953) The use of tracheal sap in the study of apple-tree nutrition. J Exp Bot 4:363–368.
Borghetti M, Leonardi S, Raschi A, Snyderman D, Tognetti R (1993) Ecotypic variation of xylem embolism, phenological traits, growth parameters and allozyme characteristics in Fagus sylvatica. Funct Ecol 7:713–720.
Bower AD, Aitken SN (2006) Geographic and seasonal variation in cold hardiness of whitebark pine. Can J For Res 36:1842–1850. Caffarra A, Donelly A (2011) The ecological signiicance of phenology
in four different tree species: effects of light and temperature on bud burst. Int J Biometeorol 55:711–721.
Chapin FS III, Schulze ED, Mooney HA (1990) The ecology and eco-nomics of storage in plants. Annu Rev Ecol Syst 21:423–447. Charrier G, Améglio T (2011) The timing of leaf fall affects cold
accli-mation by interactions with air temperature through water and car-bohydrate contents. Environ Exp Bot 72:351–357.
Charrier G, Bonhomme M, Lacointe A, Améglio T (2011) Are budburst dates, dormancy and cold acclimation in walnut trees (Juglans regia L.) under mainly genotypic or environmental control? Int J Biometeorol 55:763–774.
Chen P, Li PH (1976) Effect of photoperiod, temperature and certain growth regulators on frost hardiness of Solanum species. Bot Gaz 137:105–109.
Choat B, Jansen S, Brodribb TJ et al. (2012) Global convergence in the vulnerability of forests to drought. Nature 491:752.
Cirelli D, Jagels R, Tyree MT (2008) Toward an improved model of maple sap exudation: the location and role of osmotic barriers in sugar maple, butternut and white birch. Tree Physiol 28:1145–1155.
Cochard H, Peiffer M, Le Gall K, Granier A (1997) Developmental control of xylem hydraulic resistances and vulnerability to embolism in Fraxinus excelsior L. Impacts on water relations. J Exp Bot 48:655–663.
Cochard H, Tyree MT (1990) Xylem dysfunction in Quercus: vessel sizes, tyloses, cavitation and seasonal changes in embolism. Tree Physiol 6:393–407.
Cochard H, Bodet C, Améglio T, Cruiziat P (2000) Cryo-scanning elec-tron microscopy observations of vessel content during transpiration in walnut petioles. Facts or artifacts? Plant Physiol 124:1191–1202. Cochard H, Lemoine D, Améglio T, Granier A (2001) Mechanisms of
xylem recovery from winter embolism in Fagus sylvatica L. Tree Physiol 21:27–33.
Cruiziat P, Cochard H, Améglio T (2002) Hydraulic architecture of trees: main concepts and results. Ann For Sci 59:723–752.
Davis SD, Sperry JS, Hacke UG (1999) The relationship between xylem conduit diameter and cavitation caused by freezing. Am J Bot 86:1367–1372.
Ewers FW, Améglio T, Cochard H, Beaujard F, Martignac M, Vandame M, Bodet C, Cruiziat P (2001) Seasonal variation in xylem pressure of walnut trees: root and stem pressures. Tree Physiol 21:1123–1132. Ewers FW, Lawson MC, Bowen TJ, Davis SD (2003) Freeze/thaw stress in
Ceanothus of southern California chaparral. Oecologia 136:213–219. Feild TS, Brodribb T (2001) Stem water transport and freeze-thaw
xylem embolism in conifers and angiosperms in a Tasmanian treeline heath. Oecologia 127:314–320.
Gusta LV, Wisniewski M, Nesbitt NT, Gusta ML (2004) The effect of water, sugars, and proteins on the pattern of ice nucleation and propagation in acclimated and nonacclimated canola leaves. Plant Physiol 135:1642–1653.
Hacke U, Sauter JJ (1996) Xylem dysfunction during winter and recov-ery of hydraulic conductivity in diffuse-porous and ring-porous trees. Oecologia 105:435–439.
Hoch G, Körner C (2003) The carbon charging of pines at the climatic treeline: a global comparison. Oecologia 135:10–21.
Huner NPA, Öquist G, Sarhan F (1998) Energy balance and acclima-tion to light and cold. Trends Plant Sci 3:224–230.
Körner C (1998) A re-assessment of high elevation treeline positions and their explanation. Oecologia 115:445–459.
Langan SJ, Ewers FW, Davis SD (1997) Xylem dysfunction caused by water stress and freezing in two species of co-occurring chaparral shrubs. Plant Cell Environ 20:425–437.
Larcher W, Mair B (1968) Das Kälteresistenzverhalten von Quercus pubescens, Ostrya carpinifolia und Fraxinus ornus auf drei thermisch unterschiedlichen Standorten. Oecol Plant 3:255–270.
Lasheen AM, Chaplin CE (1971) Biochemical comparison of seasonal variations in three peach cultivars differing in cold hardiness. J Am Soc Hortic Sci 96:154–159.
Le Roux X, Walcroft AS, Daudet FA, Sinoquet H, Chaves MM, Rodrigues A, Osorio L (2001) Photosynthetic light acclimation in peach leaves: importance of changes in mass : area ratio, nitrogen concentration, and leaf nitrogen partitioning. Tree Physiol 21:377–386.
Leinonen I, Hänninen H (2002) Adaptation of the timing of bud burst of Norway spruce to temperate and boreal climates. Silva Fennica 36:695–701.
Levitt J (1980) Responses of plants to environmental stresses. Vol. 1. Chilling, freezing, and high temperature stress. Academic Press, New York, 497 pp.
Li C, Junttila O, Ernstsen A, Heino P, Palva ET (2003) Photoperiodic control of growth, cold acclimation and dormancy development in silver birch (Betula pendula) ecotypes. Physiol Plant 117:206–212. Mayr S, Charra-Vaskou K (2007) Winter at the alpine timberline causes
complex within-tree patterns of water potential and embolism in Picea abies. Physiol Plant 131:131–139.
Tree Physiology Online at http://www.treephys.oxfordjournals.org Mayr S, Cochard H, Améglio T, Kikuta SB (2007) Embolism formation
during freezing in the wood of Picea abies. Plant Physiol 143:60–67. Medeiros JS, Pockman WT (2010) Carbon gain and hydraulic limits on
water use differ between size classes of Larrea tridentata. J Arid Environ 74:1121–1129.
Meier U (2001) Stades phénologiques des mono- et dicotylédones cultivées. BBCH Monographie, Centre Fédéral de Recherche Biologiques pour l’Agriculture et les Forêts.
Milburn JA, Zimmermann MH (1986) Saplow in the sugar maple in the lealess state. J Plant Physiol 124:331–344.
Morin X, Améglio T, Ahas R, Kurz-Besson C, Lanta V, Lebourgeois F, Miglietta F, Chuine I (2007) Variation in cold hardiness and carbohy-drate concentration from dormancy induction to bud burst among prov-enances of three European oak species. Tree Physiol 27:817–825. Morin X, Lechowicz MJ, Augspurger C, O’Keefe J, Viner D, Chuine I
(2009) Leaf phenology in 22 North American tree species during the 21st century. Glob Chang Biol 15:961–975.
Nilsson JE, Walfridsson EA (1995) Phenological variation among plus-tree clones of Pinus sylvestris (L.) in northern Sweden. Silvae Genet 44:20–28.
Ögren E (1999) Fall frost resistance in willows used for biomass pro-duction. II. Predictive relationships with sugar concentration and dry matter content. Tree Physiol 19:755–760.
Pittermann J (2010) The evolution of water transport in plants: an inte-grated approach. Geobiology 8:112–139.
Pittermann J, Sperry JS (2003) Tracheid diameter is the key trait deter-mining the extent of freezing-induced embolism in conifers. Tree Physiol 23:907–914.
Pittermann J, Sperry JS (2006) Analysis of freeze–thaw embolism in conifers. The interaction between cavitation pressure and tracheid size. Plant Physiol 140:374–382.
Pockman WT, Sperry JS (1997) Freezing-induced xylem cavitation and the northern limit of Larrea tridentata. Oecologia 109:19–27. Poirier M, Lacointe A, Améglio T (2010) A semi-physiological model of
cold hardening and dehardening in walnut stem. Tree Physiol 30:1555–1569.
Pratt RB, Ewers FW, Lawson MC, Jacobsen AL, Brediger MM, Davis SD (2005) Mechanisms for tolerating freeze–thaw stress of two ever-green chaparral species: Rhus ovata and Malosma laurina (Anacardiaceae). Am J Bot 92:1102–1113.
Pratt RB, Jacobsen AL, Mohla R, Ewers FW, Davis SD (2008) Linkage between water stress tolerance and life history type in seedlings of nine chaparral species (Rhamnaceae). J Ecol 96:1252–1265. Pratt RB, North GB, Jacobsen AL, Ewers FW, Davis SD (2010) Xylem
root and shoot hydraulics is linked to life history type in chaparral seedlings. Funct Ecol 24:70–81.
R Development Core Team (2005) R: a language and environment for statistical computing. R Foundation for Statistical Computing, Vienna, Austria. ISBN 3-900051-07-0, URL: http://www.R-project.org. Rameau JC, Mansion D, Dumé G, Timbal J, Lecointe A, Dupont P, Keller
R (1989) In: Flore forestière française. I Plaines et Collines, eds. Institut pour le développement forestier, Paris, 1785 pp.
Rameau JC, Mansion D, Dumé G, Timbal J, Lecointe A, Dupont P, Keller R (1993) In: Flore forestière française. II Montagnes, eds. Institut pour le développement forestier, Paris, 2421 pp.
Repo T, Lappi J (1989) Estimation of standard error of impedance-estimated frost resistance. Scand J For Res 4:67–74.
Rodrigo J (2000) Spring frosts in deciduous fruit trees—morphologi-cal damage and lower hardiness. Sci Hortic 85:155–173.
Sakai A (1966) Studies of frost hardiness in woody plants. II. Effect of temperature on hardening. Plant Physiol 41:353–359.
Sakai A, Larcher W (1987) Frost survival of plants. Responses and adaptation to freezing stress. Ecological studies 62. Springer, Berlin, 321 pp.
Sakr S, Alves G, Morillon RL, Maurel K, Decourteix M, Guilliot A, Fleurat-Lessard P, Julien JL, Chrispeels MJ (2003) Plasma membrane aquaporins are involved in winter embolism recovery in walnut tree. Plant Physiol 133:630–641.
Sauter JJ, Wisniewski M, Witt W (1996) Interrelationships between ultrastructure, sugar levels, and frost hardiness of ray parenchyma cells during frost acclimation and deacclimation in poplar (Populus × canadensis Moench Robusta) wood. J Plant Physiol 149:451–461.
Schreiber SG, Hamann A, Hacke UG, Thomas BR (2013) Sixteen years of winter stress: an assessment of cold hardiness, growth perfor-mance and survival of hybrid poplar clones at boreal planting site. Plant Cell Environ 36:419–428.
Shi P, Körner C, Hoch G (2008) A test of the growth-limitation theory for alpine tree line formation in evergreen and deciduous taxa of the eastern Himalayas. Funct Ecol 22:213–220.
Siminovitch D, Wilson CM, Briggs DR (1953) Studies on the chemistry of the living bark of the black locust in relation to its frost hardiness. V. Seasonal transformations and variations in the carbohydrates: starch–sucrose interconversions. Plant Physiol 28:383–400. Sperry JS, Sullivan JEM (1992) Xylem embolism in response to
freeze-thaw cycles and water stress in ring-porous, diffuse-porous and conifer species. Plant Physiol 100:605–613.
Sperry JS, Robson DG (2001) Xylem cavitation and freezing in coni-fers. In: Colombo S, Bigras F (eds) Conifer cold hardiness, Kluwer Academic Publishers, Dordrecht, pp 121–136.
Sperry JS, Holbrook NM, Zimmermann MH, Tyree MT (1987) Spring illing of xylem vessels in wild grapevine. Plant Physiol 83:414–417. Sperry JS, Donnelly JR, Tyree MT (1988) Seasonal occurrence of
xylem embolism in sugar maple (Acer saccharum). Am J Bot 75:1212–1218.
Stattin E, Verhoef N, Balk P, van Wordragen M, Lindstrom A (2012) Development of a molecular test to determine the vitality status of Norway spruce (Picea abies) seedlings during frozen storage. New For 43:665–678.
Strimbeck RG, Kjellsen TD, Schaberg PG, Murakami PF (2008) Dynamics of low-temperature acclimation in temperate and boreal conifer foliage in a mild winter climate. Tree Physiol 28:1365–1374. Stuart SA, Choat B, Martin KC, Holbrook NM, Ball MC (2007) The role
of freezing in setting the latitudinal limits of mangrove forests. New Phytol 173:576–583.
Sutinen ML, Palta JP, Reich PB (1992) Seasonal differences in freezing stress resistance of needles of Pinus nigra and Pinus resinosa: evalu-ation of the electrolyte leakage method. Tree Physiol 11:241–254. Tanino K, Weiser CJ, Fuchigami LH, Chen THH (1990) Water-content
during abscisic-acid induced freezing tolerance in bromegrass cells. Plant Physiol 93:460–464.
Thomas FM, Meyer G, Popp M (2004) Effects of defoliation on the frost hardiness and the concentrations of soluble sugars and cycli-tols in the bark tissue of pedunculate oak (Quercus robur L.). Ann For Sci 61:455–463.
Tyree MT, Yang S (1992) Hydraulic conductivity recovery versus water pressure in xylem of Acer saccharum. Plant Physiol 100:669–676. Tyree MT, Cochard H (1996) Summer and winter embolism in oak.
Impact on water relations. Ann Sci For 53:173–180.
Vitasse Y, Porte AJ, Kremer A, Michalet R, Delzon S (2009) Responses of canopy duration to temperature changes in four temperate tree species: relative contributions of spring and autumn leaf phenology. Oecologia 161:187–198.
Yang S, Tyree MT (1992) A theoretical model of hydraulic conductivity recovery from embolism with comparison to experimental data on Acer saccharum. Plant Cell Environ 15:633–643.
Zhang MIN, Willison JHM (1987) An improved conductivity method for the measurement of frost hardiness. Can J Bot 65:710–715.
Zhu XB, Cox RM, Bourque CPA, Arp PA (2002) Thaw effects on cold-hardiness parameters in yellow birch. Can J Bot 80:390–398. Zimmermann MH (1983) Xylem structure and the ascent of sap.
Springer, Berlin, 143 pp.
Zwiazek JJ, Renault S, Croser C, Hansen J, Beck E (2001) Biochemical and biophysical changes in relation to cold hardiness. In: Colombo S, Bigras F (eds) Conifer cold hardiness. Kluwer Academic Publishers, Dordrecht, pp 165–186.