ARTICLE
doi:10.1038/nature11622Analyses of pig genomes provide insight
into porcine demography and evolution
A list of authors and their affiliations appears at the end of the paper
For 10,000 years pigs and humans have shared a close and complex relationship. From domestication to modern
breeding practices, humans have shaped the genomes of domestic pigs. Here we present the assembly and analysis of
the genome sequence of a female domestic Duroc pig (Sus scrofa) and a comparison with the genomes of wild and
domestic pigs from Europe and Asia. Wild pigs emerged in South East Asia and subsequently spread across Eurasia. Our
results reveal a deep phylogenetic split between European and Asian wild boars
1 million years ago, and a selective
sweep analysis indicates selection on genes involved in RNA processing and regulation. Genes associated with immune
response and olfaction exhibit fast evolution. Pigs have the largest repertoire of functional olfactory receptor genes,
reflecting the importance of smell in this scavenging animal. The pig genome sequence provides an important resource
for further improvements of this important livestock species, and our identification of many putative disease-causing
variants extends the potential of the pig as a biomedical model.
The domestic pig (Sus scrofa) is a eutherian mammal and a member of
the Cetartiodactyla order, a clade distinct from rodent and primates,
that last shared a common ancestor with humans between 79 and
97 million years (Myr) ago
1,2(http://www.timetree.net). Molecular
genetic evidence indicates that Sus scrofa emerged in South East Asia
during the climatic fluctuations of the early Pliocene 5.3–3.5 Myr ago.
Then, beginning ,10,000 years ago, pigs were domesticated in
multi-ple locations across Eurasia
3(Frantz, L. A. F. et al., manuscript
submitted).
Here we provide a high-quality draft pig genome sequence developed
under the auspices of the Swine Genome Sequencing Consortium
4,5,
established using bacterial artificial chromosome (BAC)
6and
whole-genome shotgun (WGS) sequences (see Methods and Supplementary
Information). The assembly (Sscrofa10.2) comprises 2.60 gigabases
(Gb) assigned to chromosomes with a further 212 megabases (Mb) in
unplaced scaffolds (Table 1 and Supplementary Tables 1–3).
Genome annotation
A de novo repeat discovery and annotation strategy
(Supplemen-tary Fig. 8) revealed a total of 95 novel repeat families, including:
5 long interspersed elements (LINEs), 6 short interspersed elements
(SINEs), 8 satellites and 76 long terminal repeats (LTRs). The relative
content of repetitive elements (,40%, Supplementary Figs 9 and 10)
is lower than reported for other mammalian genomes. The main
repetitive element groups are the LINE1 and glutamic acid transfer
RNA (tRNA
Glu)-derived SINEs or PRE (porcine repetitive element).
The expansion of PRE is specific to the porcine lineage. Phylogenetic
analysis of LINE1 and PRE (Supplementary Figs 13 and 14) indicates
that only a single lineage of each is currently active and that the main
expansion of both LINE1 and PRE occurred in the first half of
the Tertiary period. Smaller expansions, particularly in LINE1, have
occurred since, but recent activity is very low (Supplementary
Information).
Annotation of genes, transcripts and predictions of orthologues
and paralogues was performed using the Ensembl analysis pipeline
7(Table 1 and Supplementary Figs 3–7). Further annotation for
non-protein-coding RNAs (ncRNAs) was undertaken with another
analysis pipeline (Supplementary Information and Supplementary
Table 4).
Evolution of the porcine genome
Evolution of genes and gene families
To examine the mutation rate and type of protein-coding genes that
show accelerated evolution in pigs, we identified ,9,000 as 1:1
ortho-logues within a group of six mammals (human, mouse, dog, horse,
cow and pig). This orthologous gene set was used to identify proteins
that show accelerated evolution in each of these six mammalian
lineages (Supplementary Information). The observed number of
syn-onymous substitutions per synsyn-onymous site (dS) for the pig lineage
(0.160) is similar to that of the other mammals (0.138–0.201) except
for the mouse (0.458), indicating similar evolutionary rates in pigs and
other mammals. The observed dN/dS ratio (ratio of the rate of
non-synonymous substitutions to the rate of non-synonymous substitutions) of
0.144 is between those of humans (0.163) and mice (0.116), indicating
an intermediate level of purifying selection pressure in the pig. Genes
showing increased dN/dS ratios in each lineage were analysed using
DAVID
8to examine whether these rapidly evolving genes were enriched
for specific biological processes. Most lineages show different
fast-evolving pathways, but some pathways are shared (Fig. 1).
Immune genes are known to be actively evolving in mammals
9,10.
Because many immune genes were not included in the analysis
of 1:1 orthologues, we examined a randomly selected subset of 158
immunity-related pig proteins for evidence of accelerated evolution
(Supplementary information). Twenty-seven of these genes (17%)
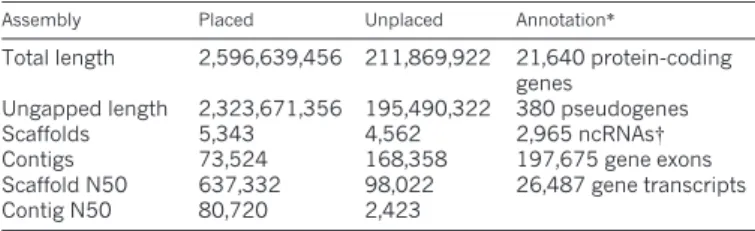
Table 1
|
Assembly and annotation statisticsAssembly Placed Unplaced Annotation*
Total length 2,596,639,456 211,869,922 21,640 protein-coding genes
Ungapped length 2,323,671,356 195,490,322 380 pseudogenes
Scaffolds 5,343 4,562 2,965 ncRNAs{
Contigs 73,524 168,358 197,675 gene exons Scaffold N50 637,332 98,022 26,487 gene transcripts
Contig N50 80,720 2,423
*Numbers refer to the annotation performed by Ensembl (release 67). Results of an independent annotation by the NCBI can be obtained from http://www.ncbi.nlm.nih.gov/mapview/stats/ BuildStats.cgi?taxid59823&build54&ver51.
{An improved ncRNA annotation with 3,601 ncRNAs and structured elements is available as a separate track in Ensembl version 70 and for download from http://rth.dk/resources/rnannotator/susscr102. N50, 50% of the genome is in fragments of this length or longer.
demonstrated accelerated evolution (Supplementary Table 8). A
parallel analysis of 143 human and 145 bovine orthologues revealed
very similar rates of evolution (18% in human and 12% in cattle,
respectively). Using a branch-site analysis, we detected accelerated
evolution of amino acids in PRSS12, CD1D and TRAF3 specific to
pig (positive selection on pig branch), as well as amino acids in
TREM1, IL1B and SCARA5 specific to pig and cow (positive selection
on the cetartiodactyl branch).
Further analysis of porcine immune genes (Supplementary Table 5)
revealed evidence for specific gene duplications and gene-family
expansions (Supplementary Tables 6 and 7). The analysis of this second
cetartiodactyl genome indicates that some expansions are
cetartiodactyl-specific (cathelicidin) whereas others are ruminant/bovine-cetartiodactyl-specific
(b-defensins, C-type lyzozymes) or potentially porcine-specific (type
I interferon, d subfamily).
Pigs have at least 39 type I interferon (IFN) genes, which is twice the
number identified in humans and significantly more than in mice. We
also detected 16 pseudogenes in this family. Cattle have 51 type I IFNs
(13 pseudogenes), indicating that both bovine and porcine type I IFN
families have undergone expansion. This is particularly important
for interferon subtypes d (IFND), v (IFNW) and t (IFNT); pigs
and cattle are evolving species-specific subtypes of IFND and IFNT,
respectively. Both species are expanding the IFNW family and share
many more IFNW isoforms than other species. Thus, expansion of
interferon genes is not ruminant-specific as proposed earlier
10, although
duplication within some specific sub-families seems to be either
bovine-or pbovine-orcine-specific.
Within the immunity-related genes annotated, we found evidence
for duplication of six immune-related genes: IL1B, CD36, CD68,
CD163, CRP and IFIT1, and one non-immune gene, RDH16. The
CD36 gene is also duplicated in the bovine genome, whereas the
IL1B gene duplication, where evidence for a partial duplication was
reported previously
11, is unique in mammals. Other key immune
genes in the major histocompatibility complex, immunoglobulin,
T-cell-receptor and natural killer cell receptor loci have been
charac-terized in detail
12–19(Supplementary Information).
Another significant porcine genome expansion is the olfactory
receptor gene family. We identified 1,301 porcine olfactory receptor
genes and 343 partial olfactory receptor genes
20. The fraction of
pseu-dogenes within these olfactory receptor sequences (14%) is the lowest
observed in any species so far. This large number of functional
olfac-tory receptor genes most probably reflects the strong reliance of pigs
on their sense of smell while scavenging for food.
Conservation of synteny and evolutionary breakpoints
Alignment of the porcine genome against seven other mammalian
genomes (Supplementary Information) identified homologous
syn-teny blocks (HSBs). Using porcine HSBs and stringent filtering
cri-teria, 192 pig-specific evolutionary breakpoint regions (EBRs) were
located. The number of porcine EBRs (146, Supplementary Table 11
and Supplementary Fig. 16) is comparable to the number of
bovine-lineage-specific EBRs (100) reported earlier using a slightly lower
resolution (500 kilobases (kb)), indicating that both lineages evolved
with an average rate of ,2.1 large-scale rearrangements per million
years after the divergence from a common cetartiodactyl ancestor
,60 Myr ago
2. This rate compares to ,1.9 rearrangements per million
years within the primate lineage (Supplementary Table 11). A total of
20 and 18 cetartiodactyl EBRs (shared by pigs and cattle) were detected
using the pig and human genomes as a reference, respectively.
Pig-specific EBRs were enriched for LTR endogenous retrovirus 1
(LTR-ERV1) transposons and satellite repeats (Supplementary
Table 12), indicating that these two families of repetitive sequences
have contributed to chromosomal evolution in the pig lineage.
Dif-ferent families of transposable elements seem to have been active in
the cetartiodactyl ancestor. The cetartiodactyl EBRs are enriched for
LINE1 elements and tRNA
Glu-derived SINEs. tRNA
Glu-derived
SINEs, previously found over-represented in cetartiodactyl EBRs
defined in the bovine genome
10, originated in the common ancestor of
cetartiodactyls
21. Our observation that these elements are also enriched
in porcine EBRs strongly supports the hypothesis that active
transpos-able elements promote lineage-specific genomic rearrangements.
A stringent set of porcine to human one-to-one orthologues using
the MetaCore database revealed that porcine EBRs and adjacent
inter-vals are enriched for genes involved in sensory perception of taste
(P , 8.9 3 10
26; FDR ,0.05), indicating that taste phenotypes may
have been affected by events associated with genomic rearrangements.
Pigs have a limited ability to taste NaCl
22. SCNN1B, a gene encoding a
sodium channel involved in the perception of salty tastes, is located in
a porcine-specific EBR. Another gene, ITPR3, encoding a receptor for
inositol triphosphate and a calcium channel involved in the
percep-tion of umami and sweet tastes, has been affected by the inserpercep-tion of
several porcine-specific SINE mobile elements into its 39 untranslated
region (39 UTR), consistent with our observation of a higher density
of transposable elements in EBRs. In addition to 8 bitter taste receptor
genes annotated by Ensembl and which were used in the gene
enrich-ment analysis, we identified 9 intact genes, to give a total number of 17
TAS2R receptors in the pig (Supplementary Table 13). This compares
to 18 intact bitter taste receptors in cattle, 19 in horse, 15 in dog and 25
in humans
23,24. Of the 14 bitter taste receptor genes that were mapped
to a specific pig chromosome (SSC), 10 were found near 2 EBRs on
SSC5 and SSC18 (Supplementary Tables 13 and 15). We also found
that at least four taste receptors (TAS1R2, TAS2R1, TAS2R40 and
TAS2R39) have been under relaxed selection (Supplementary
Infor-mation). Pigs are not sensitive to bitter tastes and tolerate higher
concentrations of bitter compounds than humans
22,25. Thus, pigs
can eat food that is unpalatable to humans. A review of the porcine
taste transduction network (Supplementary Fig. 17) revealed
addi-tional genes affected by rearrangements that affect ‘apical and taste
Dilated cardiomyopathy (4) Tight junction (4) Adherens junction (4)
Lysine degradation (3) ECM-receptor interaction (4)
Small cell lung cancer (3)
Hypertrophic cardiomyopathy (4)
Glycerolipid metabolism (4) Retinol metabolism (4)
Fatty-acid metabolism (3) Regulation of actin cytoskeleton (6)
97 Myr ago 85 Myr ago 83 Myr ago 91 Myr ago 64.5Mya dN/dS dS 0.2 0.15 0.1 0.05 0 dN/dS dS 0.4 0.3 0.2 0.1 0 0.5 0.2 0.15 0.1 0.05 0 0.25 dN/dS dS 0.15 0.1 0.05 0 0.2 dN/dS dS dN/dS dS 0.15 0.1 0.05 0 0.2 dN/dS dS 0.15 0.1 0.05 0 0.2 Mouse (84) Dog (120) Horse (311) Human (118) Cow (147) Pig (331) 65 Myr ago Endocytosis (8) Focal adhesion (5) Regulation of actin cytoskeleton (4)
ECM-receptor interaction (7) ABC transporters (5)
Focal adhesion (11) RNA degradation (5) Epithelial cell signalling in HPI (5)
Spliceosome (7)
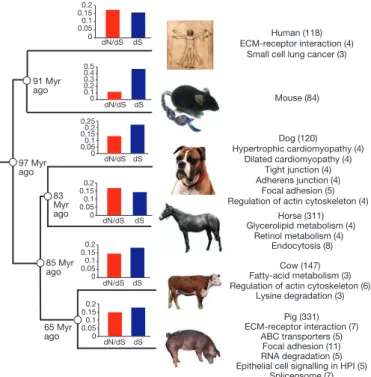
Figure 1
|
Phylogeny of the six mammals used in the dN/dS analysis.
KEGG
pathways with genes that show accelerated evolution for each of the six
mammals used in the dN/dS analysis. The bar charts show the individual dN/dS
and dS values for each of the six mammals. The dN/dS and dS values refer to the
time period of each of the six individual lineages. The number of proteins that
show significantly accelerated dN/dS ratios in each lineage varies from 84 in the
mouse to 311 in the pig lineage. Pathways significantly (P , 0.05) enriched
within this group of genes are also shown with the number of genes shown in
brackets. HPI, Helicobacter pylori infection.
receptor cell’ processes. Together with the observed
over-representa-tion of genes related to ‘adrenergic receptor activity’ and ‘angiotensin
and other binding’ categories in the pig EBRs (Supplementary
Fig. 18), our data indicate that chromosomal rearrangements
signifi-cantly contributed to adaptation in the suid lineage.
Population divergence and domestication
Divergence between Asian and European wild boar
We investigated the evolution within Sus scrofa in Eurasia by
sequen-cing ten individual unrelated wild boars from different geographical
areas. In total, 17,210,760 single nucleotide polymorphisms (SNPs)
were identified among these ten wild boars. The number of SNPs
segregating in the four Asian wild boars (11,472,192) was much higher
than that observed in the six European wild boars (6,407,224) with only
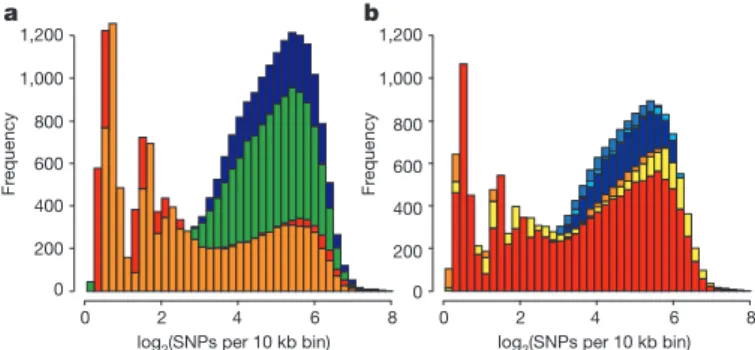
2,212,288 shared SNPs. This higher nucleotide diversity was visible in
the distribution of heterozygous sites of the Asian compared to the
European wild boar genomes (Fig. 2). Phylogenomic analyses of
com-plete genome sequences from these wild boars and six domestic pigs
revealed distinct Asian and European lineages (Supplementary Fig. 23)
that split during the mid-Pleistocene 1.6–0.8 Myr ago (Calabrian stage,
Frantz, L. A. F. et al., manuscript submitted). Colder climates during
the Calabrian glacial intervals probably triggered isolation of
popula-tions across Eurasia. Admixture analyses (Supplementary
Infor-mation) within Eurasian Sus scrofa disclosed gene flow between the
northern Chinese and European populations consistent with pig
migra-tion across Eurasia, between Europe and northern China, throughout
the Pleistocene. Our demographic analysis on the whole-genome
sequences of European and Asian wild boars (Fig. 3) revealed an
increase in the European population after pigs arrived from China.
During the Last Glacial Maximum (LGM; ,20,000 years ago)
26,
how-ever, Asian and European populations both suffered population
bottle-necks. The drop in population size was more pronounced in Europe
than Asia (Fig. 3), suggesting a greater impact of the LGM in northern
European regions and probably resulting in the observed lower genetic
diversity in modern European wild boar.
The deep phylogenetic split between European and Asian wild
boars is further supported by our observation of 1,272,737 fixed
dif-ferences between the six European and four Asian wild boars, 1,706 of
which are non-synonymous mutations in 1,191 different genes. Genes
involved in sensory perception, immunity and host defence were
among the most rapidly evolving genes (Supplementary Table 28),
further strengthening the conclusions from our analysis of
immunity-related pig proteins. This conclusion is further supported by our
observation that these genes are also enriched in porcine segmental
duplications (Supplementary Information).
To investigate further whether specific regions in the genome of
European and Asian wild boar have been under positive selection, a
selective sweep analysis was performed on the ten wild boar genome
sequences using an approach similar to that recently described in the
comparison of Neanderthal and Homo sapiens genomes
27. Regions in
the genome under strong positive selection after the divergence of
these two populations are expected to share fewer derived alleles.
Using stringent criteria (Supplementary Information), we identified
a total of 251 putative selective sweep regions, with an average size
of 111,269 base pairs (bp), together comprising around 1% of the
genome and harbouring 365 annotated protein-coding genes
(Sup-plementary Table 26). Many of these regions (112) do not contain any
currently annotated protein-coding exons. In contrast, the 10 putative
selective sweep regions located between positions 39–43 Mb on SSC3
together harbour 93 genes. This SSC3 region (Supplementary Fig. 25)
is directly adjacent to the centromere and exhibits low recombination
rates
28. Low recombining regions have been shown to be more prone
to selective sweeps and meiotic drive
29,30. Although similar large
puta-tive selecputa-tive sweep regions close to the centromere were only
observed on SSC6 between positions 56.2–57.5 Mb, on most
chromo-somes selective sweep regions tended to cluster in the central part of
chromosomes, thus exhibiting a clear correlation with regions of low
recombination (Supplementary Fig. 27). As expected, regions with the
highest nucleotide differentiation between European and Asian wild
boars were observed in high recombination regions towards the end of
the chromosomes on both metacentric and acrocentric chromosomes
28.
The putative selective sweep regions displayed significant
over-rep-resentation of genes involved in RNA splicing and RNA processing,
indicating possible changes in the regulation of genes at the level of
RNA processing (Supplementary Table 27). Several of these genes
(CELF1, CELF6, WDR83, RBM39, RBM6, HNRNPA1, HNRNPM)
are involved in alternative splicing, and, small differences in expression
might affect alternatively spliced transcripts of specific genes. Evolution
of regulatory splicing factors such as heterogeneous ribonucleoprotein
particle (hnRNP) proteins has been proposed as an evolutionary
model for alternative splicing
31, and genetic variation in such factors
can affect alternative splicing and result in different phenotypes or
disease
32. Our observation that specific genes involved in splicing show
accelerated evolution in the pig lineage (Fig. 1) supports this
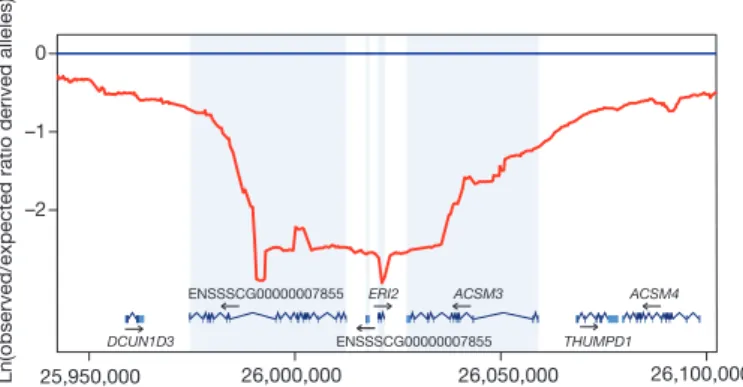
hypo-thesis. Of particular interest is the selective sweep region observed at
position 26 Mb on SSC3 around the ERI2 gene (Fig. 4), which encodes
ERI1 exoribonuclease family member 2. Different gene variants have
0 200 400 600 800 1,000 1,200 0 200 400 600 800 1,000 1,200 0 2 4 6 8 0 2 4 6 8 Fr equency
log2(SNPs per 10 kb bin) log2(SNPs per 10 kb bin)
a
b
Fr
equency
Figure 2
|
Distribution of heterozygosity for individual pig genomes.
Shown is the distribution of the heterozygosity as the log
2(SNPs) per 10k bin.
a, Wild Sus scrofa: blue, south China; green, north China; orange, Italian; red,
Dutch. b, Breeds: blue, Chinese breeds (Jiangquhai, Meishan, Xiang); red–
yellow, European breeds (Hampshire, large white, landrace). Note that the
Hampshire breed is a North American breed of European origin.
LGM
Ef
fective population size (
× 10 4) Years (g=5, μ=2.5 × 10⁻⁸) 104 105 106 WBnl WBit WBNch WBSch 3.5 3 2.5 2 1.5 1 0.5 0 Population expansion after colonization of Eurasia Population decline during LGM
Figure 3
|
Demographic history of wild boars.
Demographic history was
inferred using a hidden Markov model (HMM) approach as implemented in
pairwise sequentially Markovian coalescence (PSMC)
45. In the absence of
known mutation rates for pig, we used the default mutation rate for human (m)
of 2.5 3 10
28. For the generation time (g) we used an estimate of 5 years. The
Last Glacial Maximum (LGM) is highlighted in grey. WB
nl, wild boar
Netherlands; WB
it, wild boar Italy; WB
Nch, wild boar north China; WB
Sch, wild
been fixed in European and Asian wild boar coding for proteins that
differ at two amino acid positions: Cys52Arg and His358Leu encoded
by exons 3 and 9 of the ERI2 gene, respectively. The precise function of
ERI2 is unknown but the ERI1 exoribonuclease family members have
been shown to be involved in mRNA decay
33and in Caenorhabditis
elegans ERI-1 has been shown to be involved in the degradation of
microRNAs (miRNAs)
34.
Independent domestication and admixture events in domestic
breeds
A phylogenetic tree constructed using four European wild boar and
domestic pigs and six East Asian wild boar and domestic pigs revealed
a clear distinction between European and Asian breeds, thus
substan-tiating the hypothesis that pigs were independently domesticated
in western Eurasia and East Asia
3. An admixture analysis revealed
European influence in Asian breeds, and a ,35% Asian fraction in
European breeds (Supplementary Table 24). These results are
con-sistent with the known exchange of genetic material between
European and Asian pig breeds
35. We also observed that European
breeds form a paraphyletic clade, which cannot be solely explained by
varying degrees of Asian admixture (Supplementary Information).
Within each continent, our analysis revealed different degrees of
related-ness between breeds and their respective wild relatives (Supplementary
Table 20).
During domestication, pigs were often allowed to roam in a
semi-managed state and recurrent admixture between wild and
domesti-cated individuals was not uncommon, especially in Europe
35. Thus, the
most likely explanation for the paraphyletic pattern seen in domestic
individuals is a long history of genetic exchange between wild and
domestic pigs.
The pig as a biomedical model
The pig is an important biomedical model and the ability to generate
transgenics and knockouts in combination with somatic nuclear cloning
procedures has resulted in a number of models for specific human
diseases
36. Naturally occurring mutations also offer opportunities to
use pigs as biomedical models
37,38. To explore the potential for natural
models further, predicted porcine protein sequences were compared
with their human orthologues. We observed 112 positions where the
porcine protein has the same amino acid that is implicated in a human
disease (Supplementary Table 29). Most of these changes in humans
have been shown to increase risk in multifactorial traits such as
obe-sity (ADRB3, SDC3) and diabetes (PPP1RA, SLC30A8, ZNF615) or
shown to result in relatively mild phenotypes (for example, dyslexia:
KIAA0319) or late-onset diseases such as Parkinson’s disease (LRRK2,
SNCA) and Alzheimer’s disease (TUBD1, BLMH, CEP192, PLAU).
These porcine variants are of interest, as they will allow detailed
characterization in an experimental model organism whose
physi-ology is very similar to that of human.
Among 32,548 non-synonymous mutations identified by
sequen-cing 48 individual pigs, representing 8 different European and Asian
breeds and wild boars
39, 6 protein variants implicated in human
disease were identified (Supplementary Table 30). In addition,
another 157 nonsense mutations in 142 genes were identified, 11 of
which have also been implicated in human disease (Supplementary
Table 31). Most of these 11 variants were only observed in a
hetero-zygous state and those for which homohetero-zygous individuals were
observed probably result in either a mild phenotype (ASS1, mild form
of citrullinaemia in humans) or in phenotypes unlikely to affect the
fitness of wild boars (RBBP8, pancreatic carcinomas). Our estimate
for the average number of nonsense mutations per individual (,30) is
smaller than that observed in humans
40despite the observed threefold
higher nucleotide diversity in pigs
39. This is in agreement with the
higher effective population size in the pig compared to that for the
human population, which exhibited a strong bottleneck followed by
an exponential increase in size during recent history
41.
When considering pig-to-human xenotransplantation, porcine
endogenous retroviruses (PERVs) pose a risk of zoonotic infection.
The pig genome contains fewer endogenous retroviruses than
many vertebrates, including humans and mice, and most PERVs were
characterized as defective. However, the potential risk posed by
re-activation of rare replication-competent PERVs and defective PERVs
by recombination remains, as shown for murine ERVs (XMRV)
42.
Most PERVs consist of c and c-like groups (68%), with b-retroviral
ERVs comprising the second most abundant group (Supplementary
Fig. 15). Our phylogenetic study shows a particularly close
relation-ship between the most intact c1 group of PERVs (c1) and murine
c-ERVs, suggesting a potential recent instance of murine-to-porcine
transmission of c1 ERVs (Supplementary Fig. 15). We identified
20 almost intact PERV c1 loci (Supplementary Table 10), none of
which contained a complete set of gag, pol or env open reading frames,
indicating that these proviruses are not replicable. We also identified
four b-retroviral PERVs, each containing defects, primarily in env.
These were distantly related to intracisternal type A particle (IAP)
proviruses of mice and the mouse mammary tumour virus
(MMTV)-like (HML) proviruses of humans. None of the above loci was shared
in more than 120 pigs tested, indicating considerable PERV
poly-morphisms.
Conclusion
The draft pig genome sequence reported here has illuminated the
evolution of Sus scrofa and confirmed its speciation in South East
Asia and subsequent domestication at multiple regions across
Eurasia. The high-quality annotated reference genome sequence has
already proven to be a critical framework for comparing individual
genomes
39,43,44and its value is further illustrated in associated papers
published elsewhere (http://www.biomedcentral.com/series/swine).
The genome sequence also provides a valuable resource enabling
effective uses of pigs both in agricultural production and in
biomedi-cal research.
METHODS SUMMARY
Assembly. We constructed a hybrid de novo assembly based primarily on sequences from BAC clones sequenced clone-by-clone and supplemented with Illumina whole-genome shotgun (WGS) reads. BAC clones were selected from the high-resolution physical (BAC contig) map6with CHORI-242 library clones prepared from DNA from a single Duroc sow (Duroc 2-14) chosen preferentially. The WGS sequence data were generated using DNA isolated from the same animal. The BAC-derived sequence data were assembled into sequence contigs using Phrap on a clone-by-clone basis and subsequently independently assembled WGS contigs (Supplementary Information) were used to extend BAC clone-derived sequence contigs and to close gaps between clone-derived contigs. Further details and other methods are described in Supplementary Information.
Ln(observed/expected ratio derived alleles)
–2 –1 0 25,950,000 26,000,000 26,050,000 26,100,000 DCUN1D3 ENSSSCG00000007855 ENSSSCG00000007855 ERI2 ACSM3 THUMPD1 ACSM4
Figure 4
|
Putative selective sweep region around the
ERI2 gene on SSC3.
The y axis shows the log-transformed value of the ratio for the observed/
expected derived allele frequency using a sliding window at a bin size of
50,000 bp. The x axis shows the position on SSC3 in base pairs.
Received 16 June; accepted 27 September 2012.
1. Kumar, S. & Hedges, S. B. A molecular timescale for vertebrate evolution. Nature 392, 917–920 (1998).
2. Meredith, R. W. et al. Impacts of the Cretaceous Terrestrial Revolution and KPg extinction on mammal diversification. Science334, 521–524 (2011).
3. Larson, G. et al. Worldwide phylogeography of wild boar reveals multiple centers of pig domestication. Science307, 1618–1621 (2005).
4. Schook, L. B. et al. Swine Genome Sequencing Consortium (SGSC): a strategic roadmap for sequencing the pig genome. Comp. Funct. Genomics6, 251–255 (2005).
5. Archibald, A. L. et al. Pig genome sequence – analysis and publication strategy. BMC Genomics11, 438 (2010).
6. Humphray, S. J. et al. A high utility integrated map of the pig genome. Genome Biol. 8, R139 (2007).
7. Flicek, P. et al. Ensembl 2012. Nucleic Acids Res.40, D84–D90 (2012). 8. Huang, D. W., Sherman, B. T. & Lempicki, R. A. Systematic and integrative analysis
of large gene lists using DAVID bioinformatics resources. Nature Protocols4, 44–57 (2009).
9. Barreiro, L. B. & Quintana-Murci, L. From evolutionary genetics to human immunology: how selection shapes host defense genes. Nature Rev. Genet.11, 17–30 (2010).
10. Bovine Genome Sequencing and Analysis Consortium. The genome sequence of taurine cattle: a window to ruminant biology and evolution. Science324, 522–528 (2009).
11. Vandenbroeck, K. et al. Gene sequence, cDNA construction, expression in Escherichia coli and genetically approached purification of porcine interleukin-1 beta. Eur. J. Biochem.217, 45–52 (1993).
12. Renard, C. et al. The genomic sequence and analysis of the swine major histocompatibility complex. Genomics88, 96–110 (2006).
13. Tanaka-Matsuda, M., Ando, A., Rogel-Gaillard, C., Chardon, P. & Uenishi, H. Difference in number of loci of swine leukocyte antigen classical class I genes among haplotypes. Genomics93, 261–273 (2009).
14. Schwartz, J. C., Lefranc, M. P. & Murtaugh, M. P. Evolution of the porcine (Sus scrofa domestica) immunoglobulin k locus through germline gene conversion. Immunogenetics64, 303–311 (2012).
15. Schwartz, J. C., Lefranc, M. P. & Murtaugh, M. P. Organization, complexity and allelic diversity of the porcine (Sus scrofa domestica) immunoglobulin lambda locus. Immunogenetics64, 399–407 (2012).
16. Uenishi, H. et al. Genomic structure around joining segments and constant regions of swine T-cell receptor a/d (TRA/TRD) locus. Immunology109, 515–526 (2003). 17. Uenishi, H. et al. Genomic sequence encoding diversity segments of the pig TCR d
chain gene demonstrates productivity of highly diversified repertoire. Mol. Immunol.46, 1212–1221 (2009).
18. Eguchi-Ogawa, T., Toki, D. & Uenishi, H. Genomic structure of the whole D-J-C clusters and the upstream region coding V segments of the TRB locus in pig. Dev. Comp. Immunol.33, 1111–1119 (2009).
19. Sambrook, J. G. et al. Identification of a single killer immunoglobulin-like receptor (KIR) gene in the porcine leukocyte receptor complex on chromosome 6q. Immunogenetics58, 481–486 (2006).
20. Nguyen, D. T. et al. The complete swine olfactory subgenome: expansion of olfactory receptor gene repertoire in the pig genome. BMC Genomics (in the press).
21. Shimamura, M., Abe, H., Nikaido, M., Ohshima, K. & Okada, N. Genealogy of families of SINEs in cetaceans and artiodactyls: the presence of a huge superfamily of tRNA(Glu)-derived families of SINEs. Mol. Biol. Evol.16, 1046–1060 (1999). 22. Hellekant, G. & Danilova, V. Taste in domestic pig, Sus scrofa. J. Anim. Physiol. Anim.
Nutr. (Berl.)82, 8–24 (1999).
23. Fischer, A., Gilad, Y., Man, O. & Pa¨a¨bo, S. Evolution of bitter taste receptors in humans and apes. Mol. Biol. Evol.22, 432–436 (2005).
24. Dong, D., Jones, G. & Zhang, S. Dynamic evolution of bitter taste receptor genes in vertebrates. BMC Evol. Biol.9, 12 (2009).
25. Nelson, S. L. & Sanregret, J. D. Response of pigs to bitter-tasting compounds. Chem. Senses22, 129–132 (1997).
26. Yokoyama, Y., Lambeck, K., De Deckker, P., Johnston, P. & Fifield, L. K. Timing of the Last Glacial Maximum. Nature406, 713–716 (2000).
27. Green, R. E. et al. A draft sequence of the Neandertal genome. Science328, 710–722 (2010).
28. Tortereau, F. et al. Sex specific differences in recombination rate in the pig are correlated with GC content. BMC Genomics (in the press).
29. Barton, N. H. Genetic hitchhiking. Phil. Trans. R. Soc. Lond. B355, 1553–1562 (2000).
30. Lyttle, T. W. Cheaters sometimes prosper: distortion of mendelian segregation by meiotic drive. Trends Genet.9, 205–210 (1993).
31. Ast, G. How did alternative splicing evolve? Nature Rev. Genet.5, 773–782 (2004). 32. Garcia-Blanco, M. A., Baraniak, A. P. & Lasda, E. L. Alternative splicing in disease
and therapy. Nature Biotechnol.22, 535–546 (2004).
33. Kupsco, J. M., Wu, M.-J., Marzluff, W. F., Thapar, R. & Duronio, R. J. Genetic and biochemical characterization of Drosophila Snipper: A promiscuous member of the metazoan 39hExo/ERI-1 family of 39 to 59 exonucleases. RNA12, 2103–2117 (2006).
34. Kennedy, S., Wang, D. & Ruvkun, G. A conserved siRNA-degrading RNase negatively regulates RNA interference in C. elegans. Nature427, 645–649 (2004). 35. White, S. From globalized pig breeds to capitalist pigs: a study in animals cultures
and evolutionary history. Environ. Hist.16, 94–120 (2011).
36. Walters, E. M. et al. Completion of the swine genome will simplify the production of swine as a large animal biomedical model. BMC Med. Genomics (in the press). 37. Gillard, E. F. et al. A substitution of cysteine for arginine 614 in the ryanodine
receptor is potentially causative of human malignant hyperthermia. Genomics11, 751–755 (1991).
38. Murgiano, L., Tammen, I., Harlizius, B. & Dro¨gemu¨ller, C. A de novo germline mutation in MYH7 causes a progressive dominant myopathy in pigs. BMC Genomics (in the press).
39. Bosse, M. et al. Regions of homozygosity in the porcine genome: Consequence of demography and the recombination landscape. PLoS Genet.8, e1003100 (2012). 40. MacArthur, D. G. et al. A systematic survey of loss-of-function variants in human
protein-coding genes. Science335, 823–828 (2012).
41. Keinan, A. & Clark, A. G. Recent explosive human population growth has resulted in an excess of rare variants. Science336, 740–743 (2012).
42. Paprotka, T. et al. Recombinant origin of the retrovirus XMRV. Science333, 97–101 (2011).
43. Fang, X. et al. The sequence and analysis of an inbred pig genome. GigaScience (in the press).
44. Rubin, C. J. et al. Strong signatures of selection in the domestic pig genome. Proc. Natl. Acad. Sci. USA (in the press).
45. Li, H. & Durbin, R. Inference of human population history from individual whole-genome sequences. Nature475, 493–496 (2011).
Supplementary Information is available in the online version of the paper. Acknowledgements The authors recognize the contributions of the following individuals towards the establishment of the Swine Genome Sequencing Consortium and their leadership in realizing this effort: J. Jen, P. J. Burfening, D. Hamernik, R. A. Easter, N. Merchen, R. D. Green, J. Cassady, B. Harlizius, M. Boggess and M. Stratton. Also the authors acknowledge A. Hernandez, C. Wright at the University of Illinois Keck Center for Comparative and Functional Genomics; N. Bruneau and Prof. Ning Li for their contribution to PERV studies; D. Goodband and D. Berman for their efforts in genome annotation; D. Grafham of the Welcome Trust Sanger Institute for his efforts in the genome assembly and J. Hedegaard, M. Nielsen and R. O. Nielsen for their contribution on the miRNA analysis. We also recognize contributions from the National Institute of Agrobiological Sciences and the Institute of Japan Association for Techno-innovation in Agriculture, Forestry and Fisheries, Tsukuba, Japan, H. Shinkai, T. Eguchi-Ogawa, K. Suzuki, D. Toki, T. Matsumoto, N. Fujishima-Kanaya, A. Mikawa, N. Okumura, M. Tanaka-Matsuda, K. Kurita, H. Sasaki, K. Kamiya, A. Kikuta, T. Bito and N. Fujitsuka. We acknowledge support from the USDA CSREES/NIFA Swine Genome Coordination Program, College of Agricultural, Consumer and Environmental Sciences, University of Illinois; College of Agriculture and Life Sciences, Iowa State University; North Carolina Agricultural Research Service; USA National Pork Board; Iowa Pork Producers Association; North Carolina Pork Council; Danish government; TOPIGS Research Center IPG The Netherlands; INRA Genescope, France; Wellcome Trust Sanger Institute and BGI. We are grateful to the genome team at NCBI for their assistance in checking the Sscrofa10.2 assembly and for their independent annotation of the sequence. This project was also partially supported by grants: BBSRC grants (Ensembl): BB/E010520/1, BB/E010520/2, BB/I025328/1; EC FP6 ‘Cutting edge genomics for sustainable animal breeding (SABRE)’; EC FP7 ‘Quantomics’; C. J. Martin Overseas Based Biomedical Fellowship from the Australian NHMRC (575585); BBSRC (BB/H005935/1); Next-Generation BioGreen 21 Program (PJ009019,
PJ0081162012), RDA, Republic of Korea; Consolider programme from Ministry of Research (Spain); NIH R13 RR020283A; NIH R13 RR032267A; ILLU 535-314; ILLU 538-379; ILLU-538-312; ILLU-538-34; CSREES, NIFA for funding genome coordination activities; NIH grant 5 P41LM006252; MAFF grants (IRPPIAUGT-AG 1101/1201); USDA-NRI-2009-35205-05192; USDA-NRSP8 Bioinformatics Coordination and Pig Genome Coordination funds; US-UK Fulbright Commission; Next-Generation BioGreen 21 (no. PJ0080892011) Program, RDA, Republic of Korea; USDA-ARS Project Plan 1235-51000-055-00D; USDA-ARS Project Plan
1265-32000-098-00D; USDA-NRI-2006-35204-17337 USDA AFRI NIFA/DHS 2010-39559-21860; NIH P20-RR017686; USDA ARS; USDA-NRSP8 Bioinformatics; USDA ARS Beltsville Area Summer Undergraduate Fellowships; BBSRC grant BB/ G004013/1; NSFC Outstanding Youth grant (31025026); The Swedish Research Council FORMAS; The Swedish Wenner-Gren Foundations; European Commission FP6 funded project LSHB-CT-2006-037377; BioGreen21, RDA grant PJ00622901; BioGreen21, RDA grant PJ00622902; BioGreen21, RDA grant PJ00622903; BioGreen21, RDA grant PJ00622903. The research leading to these results has received funding from the European Research Council under the European Community’s Seventh Framework Programme (FP7/2007-2013)/ERC grant agreement no. 249894 (SelSweep); NIH P20-RR017686; NIH NIDA P30 DA018310; NIH NIDA R21 DA027548; NIAS, RDA grant PJ001758; BioGreen21, RDA grant PJ006229; NIAS, RDA grant 20040301034467; ANR grant ANR07-GANI-001 DeliSus; Danish funding agencies: FTP/DFF (09-066598); DSF/Strategic Growth Technologies (09-067036); the Lundbeck foundation (374/06); DCSC (Scientific Computing); The Funds for International Cooperation from the Ministry of Science and Technology of China 2002AA229061; PL-Grid project: POIG.02.03.00-00-007/08-00 ‘Genome Assembly’; USDA-NIFA-CREES AG 2006-35216-16668; AG
2002-34480-11828; AG 2003-34480-13172; AG 2004-34480-14417; AG 2005-34480-15939; AG 2006-34480-17150; AG 2008-34480-19328; AG 2009-34480-19875; AG 2002-35205-12712; somatic cell genomics: Integrating QTL Discovery and Validation; AG 2008-35205-18769; AG 2009-65205-05642; AG 2004-3881-02193; AG 2011-67015-30229; AG 58-5438-2-313; AG 58-5438-7-317; and AG 58-0208-7-149; NIH grant 5 P41 LM006252.
Author Contributions Manuscript main text: A.L.A., M.A.M.G., L.B.S., H.U., C.K.T., Y.T., M.F.R., C.P., S.L., D.M., H.-J.M., D.M.L., H.Ki., L.A.F.F., G.L.M.C.; project coordination: A.L.A., M.A.M.G., L.B.S., M.F.R., D.M., J.R., C.Chu., H.U., M.C., K.E.; project initiation: A.L.A.,
M.A.M.G., L.B.S., M.F.R., D.M., M.F., C.W.B., P.C., G.A.R., M.Y., J.R., L.B.; library preparation and sequencing: S.J.H., C.S., C.Cl., S.M., L.M., M.J., Y.Lu, X.X., P.N., Jia.Z., G.Z., A.L.A., R.C.C., T.M., H.Ka., K.-T.L., T.-H.K., H.-S.P., E.-W.P., J.-H.K., S.-H.C., S.-J.O., Ji.W., Ju.W., J.-T.J.; genome assembly: A.L.A., M.C., S.L., C.S., P.D., H.-J.M., H.U., D.M., B.S., T.F., Y.Li, N.D., R.R.-G., R.L., K.H., W.C.; repetitive DNA analysis: G.J.F. (leader), J.J., F.DeS., H.-J.M.; gene content and genome evolution: S.F., B.L.A., S.W., S.S.; conservation of synteny and evolutionary breakpoints: D.M.L. (leader), J.N., L.A., B.C., H.A.L., J.M., J.K., D.K.G., K.E.F.; speciation: L.A.F.F., M.A.M.G., O.M., H.-J.M., J.G.S.; divergence of Asian and European wild boar: H.-J.M., M.Bo., M.A.M.G., L.A.F.F.; annotation: S.S., B.L.A., T.M., C.K.T., Y.S., M.By., R.C., J.R., E.F., Z.-L.H., W.L., M.P.-E.; RNA analysis: O.M., R.P.M.A.C., H.U., C.A., H.T., B.T., P.S., M.F., J.G., C.B., F.P., H.H., Z.B., J.F.; neuropeptides: J.V.S., B.R.S., S.R.-Z.; pig domestication: L.A.F.F., R.P.M.A.C., H.-J.M., M.Bo., S.O., G.L., L.R., J.G.S.; population admixture: L.A.F.F., J.G.S.; biomedical models: B.D., L.R., K.S., M.A.M.G.; immune response: C.K.T., (co-leader) C.R.-G. (co-leader), H.D.D., J.E.L., A.A., B.B., J.S., D.B., F.B., M.By., S.B., C.Che., D.C.-S., R.C., E.F., E.G., J.G.R.G., J.L.H., T.H., Z.-L.H., R.K., J.K.L., K.M., M.P.M., T.M., G.P., J.M.R., J.S., H.U., Jie Z., S.Z.; olfactory and taste receptor analysis: C.P. (leader), D.T.N., K.L.; dN/dS analysis: H.Ki. (leader), H.A., K.-W.K.; PERV and retroviral insertions: C.R.-G., A.H., P.J., J.B., G.S., L.S., R.W., Y.T. (leader); segmental duplications: O.M., Y.P., Z.-Q.D., M.F.R.
Author Information The final assembly (Sscrofa10.2) has been deposited in the public sequence databases (GenBank/EMBL/DDBJ) under accession number
AEMK01000000. The primary source of the Sscrofa10.2 assembly is the NCBI ftp site (ftp://ftp.ncbi.nih.gov/genbank/genomes/Eukaryotes/vertebrates_mammals/ Sus_scrofa/Sscrofa10.2/). The chromosomes are CM000812–CM00830 and CM001155. They are built from 5,343 placed scaffolds, with GenBank accession numbers GL878569–GL882503 and JH114391–JH118402. The 4,562 unplaced scaffolds of Sscrofa10.2 have accessions in the ranges GL892100–GL896682 and JH118403–JH118999. Illumina sequences for the sequenced wild boars and individuals of the other breeds, aligned against build10.2, have been deposited in the European Nucleotide Archive (ENA) under project number ERP001813. Reprints and permissions information is available at www.nature.com/reprints. The authors declare no competing financial interests. Readers are welcome to comment on the online version of the paper. Correspondence and requests for materials should be addressed to M.A.M.G. ([email protected]) or A.L.A. ([email protected]). This work is licensed under a Creative Commons Attribution-NonCommercial-ShareAlike 3.0 Unported licence. To view a copy of this licence, visit http://creativecommons.org/ licenses/by-nc-sa/3.0/
Martien A. M. Groenen1*, Alan L. Archibald2*, Hirohide Uenishi3, Christopher
K. Tuggle4, Yasuhiro Takeuchi5, Max F. Rothschild4, Claire Rogel-Gaillard6, Chankyu Park7, Denis Milan8, Hendrik-Jan Megens1, Shengting Li9,10, Denis M. Larkin11, Heebal Kim12, Laurent A. F. Frantz1, Mario Caccamo13, Hyeonju Ahn12, Bronwen L. Aken14,
Anna Anselmo15, Christian Anthon16, Loretta Auvil17, Bouabid Badaoui15, Craig W.
Beattie18, Christian Bendixen19, Daniel Berman20, Frank Blecha21, Jonas Blomberg22,
Lars Bolund9,10, Mirte Bosse1, Sara Botti15, Zhan Bujie19, Megan Bystrom4, Boris
Capitanu17, Denise Carvalho-Silva23, Patrick Chardon6, Celine Chen24, Ryan Cheng4,
Sang-Haeng Choi25, William Chow14, Richard C. Clark14, Christopher Clee14, Richard
P. M. A. Crooijmans1, Harry D. Dawson24, Patrice Dehais8, Fioravante De Sapio2, Bert
Dibbits1, Nizar Drou13, Zhi-Qiang Du4, Kellye Eversole26, Joa˜o Fadista19{, Susan
Fairley14, Thomas Faraut8, Geoffrey J. Faulkner2{, Katie E. Fowler27, Merete
Fredholm16, Eric Fritz4, James G. R. Gilbert14, Elisabetta Giuffra6,15, Jan Gorodkin16,
Darren K. Griffin27, Jennifer L. Harrow14, Alexander Hayward28, Kerstin Howe14,
Zhi-Liang Hu4, Sean J. Humphray14{, Toby Hunt14, Henrik Hornshøj19, Jin-Tae
Jeon29{, Patric Jern28, Matthew Jones14, Jerzy Jurka30, Hiroyuki Kanamori3,31, Ronan
Kapetanovic2, Jaebum Kim7,32, Jae-Hwan Kim33, Kyu-Won Kim34, Tae-Hun Kim35,
Greger Larson36, Kyooyeol Lee7, Kyung-Tai Lee35, Richard Leggett13, Harris A. Lewin37,
Yingrui Li9, Wansheng Liu38, Jane E. Loveland14, Yao Lu9, Joan K. Lunney20, Jian Ma39,
Ole Madsen1, Katherine Mann20{, Lucy Matthews14, Stuart McLaren14, Takeya
Morozumi31, Michael P. Murtaugh40, Jitendra Narayan11, Dinh Truong Nguyen7,
Peixiang Ni9, Song-Jung Oh41, Suneel Onteru4, Frank Panitz19, Eung-Woo Park35,
Hong-Seog Park25, Geraldine Pascal42, Yogesh Paudel1, Miguel Perez-Enciso43,
Ricardo Ramirez-Gonzalez13, James M. Reecy4, Sandra Rodriguez-Zas44, Gary
A. Rohrer45, Lauretta Rund44, Yongming Sang21, Kyle Schachtschneider44, Joshua G. Schraiber46, John Schwartz40, Linda Scobie47, Carol Scott14, Stephen Searle14,
Bertrand Servin8, Bruce R. Southey44, Goran Sperber48, Peter Stadler49, Jonathan V.
Sweedler50, Hakim Tafer49, Bo Thomsen19, Rashmi Wali47, Jian Wang9, Jun Wang9,51,
Simon White14, Xun Xu9, Martine Yerle8, Guojie Zhang9,52, Jianguo Zhang9, Jie
Zhang53, Shuhong Zhao53, Jane Rogers13, Carol Churcher14& Lawrence B. Schook54 1
Animal Breeding and Genomics Centre, Wageningen University, De Elst 1, 6708 WD, Wageningen, The Netherlands.2
The Roslin Institute and R(D)SVS, University of Edinburgh, Easter Bush, Midlothian EH25 9RG, UK.3
National Institute of Agrobiological Sciences, 2-1-2 Kannondai, Tsukuba, Ibaraki 305-8602, Japan.4
Department of Animal Science and Center for Integrated Animal Genomics, Iowa State University, 2255 Kildee Hall, Ames 50011, USA.5
MRC/UCL Centre for Medical Molecular Virology and Wohl Virion Centre, Division of Infection & Immunity, University College London, Cruciform
Building, Gower Street, London WC1E 6BT, UK.6
INRA, Laboratory of Animal Genetics and Integrative Biology/AgroParisTech, Laboratory of Animal Genetics and Integrative Biology/CEA, DSV, IRCM, Laboratoire de Radiobiologie et Etude du Ge´nome, Domaine de Vilvert, F-78350 Jouy-en-Josas, France.7
Department of Animal Biotechnology, Konkuk University, 1 Hwayang-dong, Kwangjin-gu, Seoul 143-701, South Korea.8
INRA, Laboratoire de Ge´ne´tique Cellulaire, Chemin de Borde-Rouge, Auzeville, 31320 Castanet Tolosan, France.9
BGI-Shenzhen, Shenzhen 518083, China.10
Department of Biomedicine, Aarhus University, DK-8000 Aarhus C, Denmark.11
Institute of Biological, Environmental and Rural Sciences, Aberystwyth University, Penglais Campus, Aberystwyth, Ceredigion SY23 3DA, UK.12
Department of Agricultural Biotechnology and C&K Genomics, Seoul National University, Gwanakgu, Seoul 151-742, South Korea.13
The Genome Analysis Centre, Norwich Research Park, Norwich NR4 7UH, UK.14
Wellcome Trust Sanger Institute, Wellcome Trust Genome Campus, Hinxton, Cambridgeshire CB10 1SA, UK.15
Parco Tecnologico Padano, Via Einstein, Loc. C. Codazza, 26900 Lodi, Italy.
16
Center for non-coding RNA in Technology and Health, IBHV University of Copenhagen, Frederiksberg, Denmark.17
Illinois Informatics Institute, University of Illinois, Urbana, Illinois 61801, USA.18
Department of Surgery, University of Illinois, Chicago, Illinois 60612, USA.19
Department of Molecular Biology and Genetics, Aarhus University, DK-8830 Tjele, Denmark.20
USDA ARS BARC Animal Parasitic Diseases Laboratory, Beltsville, Maryland 20705, USA.21
Department of Anatomy and Physiology, College of Veterinary Medicine, Kansas State University, Manhattan, Kansas 66506, USA.22
Clinical Virology, Department of Medical Sciences, Uppsala University, Building D1, Academic Hospital, 751 85 Uppsala, Sweden.23
European Bioinformatics Institute, Wellcome Trust Genome Campus, Hinxton, Cambridgeshire CB10 1SD, UK.24
Diet, Genomics, Immunology Laboratory, Beltsville Human Nutrition Research Center, United States Department of Agriculture, BARC-East 10300 Baltimore Ave Beltsville, Maryland 20705, USA.25Korean Research Institute of Bioscience and Biotechnology, 125 Gwahak ro, Yuseong gu, Daejeon 305-806, South Korea.26
Eversole Associates and the Alliance for Animal Genome Research, 5207 Wyoming Road, Bethesda, Maryland 20816, USA.
27
School of Biosciences, The University of Kent, Giles Lane, Canterbury, Kent CT2 7NJ, UK.
28
Science for Life Laboratory, Department of Medical Biochemistry and Microbiology, Uppsala University, BMC, Box 582, SE75123 Uppsala, Sweden.29
Department of Animal Sciences, College of Agriculture and Life Sciences, Gyeongsang National University, Jinju 660-701, South Korea.30
Genetic Information Research Institute, 1925 Landings Drive, Mountain View, California 94043, USA.31
Institute of Japan Association for
Techno-innovation in Agriculture, Forestry and Fisheries, 446-1 Ippaizuka, Kamiyokoba, Tsukuba, Ibaraki 305-0854, Japan.32
Institute for Genomic Biology, University of Illinois, Urbana, Illinois 61801, USA.33
Animal Genetic Resources Station, National Institute of Animal Science, RDA, San 4, Yongsanri, Unbong eup, Namwon 590-832, South Korea.
34
C&K Genomics, Gwanakgu, Seoul 151-742, South Korea.35
Animal Genomics and Bioinformatics Division, National Institute of Animal Science, RDA, 77 Chuksan gil, Kwonsun gu, Suwon 441-706, South Korea.36
Durham Evolution and Ancient DNA, Department of Archaeology, Durham University, Durham DH1 3LE, UK.37
Department of Evolution and Ecology, The UC Davis Genome Center, University of California, Davis, California 95618, USA.38
Department of Dairy and Animal Sciences, Center for Reproductive Biology and Health (CRBH), College of Agricultural Sciences, The Pennsylvania State University, 305 Henning Building, University Park, Pennsylvania 16802, USA.39
Department of Bioengineering and Institute for Genomic Biology, University of Illinois, Urbana, Illinois 61801, USA.40
Department of Veterinary and Biomedical Sciences, University of Minnesota, 1971 Commonwealth Avenue, St Paul, Minnesota 55108, USA.41
Jeju National University, 102 Jejudaehakno, Jeju 690-756, South Korea.42
INRA UMR85/CNRS UMR7247 Physiologie de la Reproduction et des Comportements/IFCE, F-37380 Nouzilly, France and Universite´ François Rabelais de Tours, F-37041 Tours, France.43
ICREA, Centre for Research in Agricultural Genomics (CRAG) and Facultat de Veterinaria UAB, Campus Universitat Autonoma Barcelona, Bellaterra E-08193, Spain.44
Department of Animal Sciences, University of Illinois, Urbana, Illinois 61801, USA.45
USDA, ARS, US Meat Animal Research Center, Clay Center, Nebraska 68933, USA.46
Department of Integrative Biology, University of California, Berkeley, California 94720-3140, USA.47
Department of Life Sciences, Glasgow Caledonian University, Glasgow G4 0BA, UK.48
Department of Neuroscience, Biomedical Centre, Uppsala University, PO Box 593, 751 24 Uppsala, Sweden.49
Bioinformatics Group, Department of Computer Science, Interdisciplinary Center for Bioinformatics, Universita¨t Leipzig, Leipzig, Germany.50
Department of Chemistry, University of Illinois, Urbana, Illinois 61801, USA.51
Novo Nordisk Foundation Center for Basic Metabolic Research and Department of Biology, University of Copenhagen, DK-2200 Copenhagen, Denmark.52
BGI-Europe, DK-2200 Copenhagen N, Denmark.53
Key Lab of Animal Genetics, Breeding, and Reproduction of Ministry Education, Huazhong Agricultural University, Wuhan 430070 PR China, Huazhong Agricultural University, Wuhan 430070, China.54
Department of Animal Sciences and Institute for Genomic Biology, University of Illinois, Urbana, Illinois 61801, USA. {Present addresses: Lund University Diabetes Centre, CRC, Malmo¨ University Hospital, SE-205 02 Malmo¨, Sweden (J.F.); Mater Medical Research Institute, and School of Biomedical Sciences, University of Queensland, Brisbane, 4072 Queensland, Australia (G.J.F.); Illumina Inc. Chesterford Research Park, Little Chesterford, Nr Saffron Walden, Essex CB10 1XL, UK (S.J.H.); Department of Molecular Microbiology, Washington University School of Medicine, Saint Louis, Missouri 63110, USA (K.M.).
*These authors contributed equally to this work. {Deceased.