ORIGINAL PAPER
Wipe sampling procedure coupled to LC
–MS/MS analysis
for the simultaneous determination of 10 cytotoxic drugs
on different surfaces
Susanne Nussbaumer&Laurent Geiser&Farshid Sadeghipour&Denis Hochstrasser& Pascal Bonnabry&Jean-Luc Veuthey&Sandrine Fleury-Souverain
Received: 21 March 2011 / Revised: 19 May 2011 / Accepted: 2 June 2011 / Published online: 24 June 2011 # Springer-Verlag 2011
Abstract A simple wipe sampling procedure was devel-oped for the surface contamination determination of ten cytotoxic drugs: cytarabine, gemcitabine, methotrexate, etoposide phosphate, cyclophosphamide, ifosfamide, irino-tecan, doxorubicin, epirubicin and vincristine. Wiping was performed using Whatman filter paper on different surfaces such as stainless steel, polypropylene, polystyrol, glass, latex gloves, computer mouse and coated paperboard. Wiping and desorption procedures were investigated: The same solution containing 20% acetonitrile and 0.1% formic acid in water gave the best results. After ultrasonic desorption and then centrifugation, samples were analysed by a validated liquid chromatography coupled to tandem mass spectrometry (LC–MS/MS) in selected reaction monitoring mode. The whole analytical strategy from wipe sampling to LC–MS/MS analysis was evaluated to deter-mine quantitative performance. The lowest limit of quan-tification of 10 ng per wiping sample (i.e. 0.1 ng cm−2) was determined for the ten investigated cytotoxic drugs. Relative standard deviation for intermediate precision was
always inferior to 20%. As recovery was dependent on the tested surface for each drug, a correction factor was determined and applied for real samples. The method was then successfully applied at the cytotoxic production unit of the Geneva University Hospitals pharmacy.
Keywords Cytotoxic . Antineoplastic drugs . Surface contamination . Environmental monitoring . LC–MS/MS . Wipe sampling
Introduction
Cytotoxic drugs are widely used in cancer therapy, and an increasing number of patients receiving chemotherapy have been observed during the last decades. These drugs have been recognized as hazardous for healthcare professionals such as oncology nurses or pharmacists and technicians [1]. Despite the existence of safety standards for handling cytotoxic drugs, several studies report low-level contamination of these compounds on workbenches, floors, vials, gloves and storage shelves [2– 10]. Traces of cytotoxic agents have also been found in urine [11–17] and blood of healthcare professionals [18], indicating that this working population is at risk. Never-theless, a direct relationship between exposure to cytotoxic contamination and harmful effects has not been estab-lished yet, and no maximal acceptable amount of surface contamination for these drugs has been set up by regulatory offices until now. According to precautionary principles, exposure should nevertheless be kept at the lowest possible level [19]. Monitoring of contamination is essential to ascertain the contamination risk in order to improve working conditions by effective cleaning proce-dures or other measures.
Published in the special issue Analytical Sciences in Switzerland with guest editors P. Dittrich, D. Günther, G. Hopfgartner, and R. Zenobi. S. Nussbaumer
:
F. Sadeghipour:
P. Bonnabry:
S. Fleury-Souverain (*)
Pharmacy, Geneva University Hospitals (HUG), 1211 Geneva 14, Switzerland
e-mail: [email protected]
S. Nussbaumer
:
D. Hochstrasser:
P. Bonnabry:
J.-L. Veuthey School of Pharmaceutical Sciences, University of Geneva, University of Lausanne,1211 Geneva 4, Switzerland
S. Nussbaumer
:
L. Geiser:
D. Hochstrasser:
J.-L. Veuthey Swiss Centre for Applied Human Toxicology,1211 Geneva 4, Switzerland
Anal Bioanal Chem (2012) 402:2499–2509 DOI 10.1007/s00216-011-5157-2
In Germany, threshold guidance values for platinum and 5-fluorouracil have been set on the basis of data from a large multicenter study including 102 pharmacies [20,21]. Wiping samples have been obtained by compound-specific wiping procedures and analysed by voltammetry for platinum drugs and by GC-MS for fluorouracil. This approach presented very good quantitative performance and detection limits (i.e., 0.1–1 pg per sample) and estimated potential surface contamination using platinum drugs or 5-FU as model markers. However, a wide range of chemotherapy formulations with different drugs and with different preparation procedures are produced daily in hospital cytotoxic units. To get an overview of several contaminations, multi-compound methods are required. To the author’s knowledge, only few generic wiping proce-dures have been developed, for example a wipe sampling procedure coupled to liquid chromatography–tandem mass spectrometry (LC–MS/MS) for the simultaneous determi-nation of gemcitabine, paclitaxel, cyclophosphamide and ifosfamide [22] or for methotrexate, 5-fluorouracil and cyclophosphamide [9]. Other toxic compounds, such as irinotecan, anthracyclines or vincalcaloïdes, which are also largely used in chemotherapies, have rarely been included in surface contamination studies.
Recently, we developed and validated a LC–MS/MS method for the simultaneous quantification of ten cytotoxic drugs [23]. In the continuity of this method, we present the development of a wiping and extraction procedure of the same ten cytotoxic drugs on different surfaces and their quantitative analysis by the LC–MS/MS method. This wipe sampling procedure was then applied to evaluate the surface contamination in the cytotoxic production unit at the pharmacy of Geneva University Hospital (HUG).
Experimental
Chemicals and reagents
The study was performed with the following commercially available cytotoxic drugs: Campto® (irinotecan, 20 mg mL−1) and Cytosar® (cytarabine, 20 mg mL−1) were purchased from Pfizer AG (Zürich, Switzerland); Gemcitabin Teva® (gemcitabine reconstituted in water at 20 mg mL−1) and Vincristin Teva® (vincristine, 1 mg mL−1) from Teva Pharma AG (Aesch, Switzerland); Holoxan (ifosfamid reconstituted in water at 40 mg mL−1) and Endoxan® (cyclophosphamide reconstituted in glucose 5% at 20 mg mL−1) from Baxter AG (Volketswil, Switzerland); Methotrexat Farmos® (methotrexate, 2.5 mg mL−1) from Orion Pharma (Zug, Switzerland); Etopophos® (etoposide phosphate reconsti-tuted in water at 20 mg mL-1) from Bristol-Myers Squibb SA (Baar, Switzerland); Doxorubine Ebewe® (doxorubicin,
2 mg mL−1) from Ebewe Pharma (Cham, Switzerland); and Epirubicin Actavis Solution® (epirubicin, 2 mg mL−1) from Actavis (Regensdorf, Switzerland).
The reconstitution of Etopophos, Gemcitabine Teva and Holoxan was performed with water for injection, obtained from Bichsel Laboratories (Interlaken, Switzerland). Glucose 5% for the reconstitution of Endoxan was from Sintetica-Bioren SA (Couvet, Switzerland). The internal standard (IS) [13C, 2H3]-methotrexate was purchased from Alsachim (Illkirch, France).
Wiping and desorption material
The evaluated materials for wipe sampling were filter paper (Protein SaverTM 903 Card) from Whatman (Dassel, Germany), filter card DMPK-300 from Ahlstrom (Helsinki, Finland) and blend wipers TX 612 from Texwipe (Cabuyao, Philippines).
Desorption was performed in 1.5-mL polyethylene (PE) safe-lock tubes from Eppendorf AG (Hamburg, Germany). Equipment
Analyses were carried out with the liquid chromatography system Accela from Thermo Fisher Scientific Inc. (Waltham, MA, USA) consisting of a quaternary pump equipped with an online degasser, an autosampler and a solvent platform. The chromatographic system was coupled to a triple quadrupole (TSQ) Quantum Discovery MS from Thermo Fisher Scien-tific equipped with an Ion Max electrospray ionization (ESI) interface and operated with Xcalibur software (Thermo Fisher Scientific). Separations were done on a ZORBAX SB-C18 RR 2.1×100-mm, 3.5-μm column from Agilent Technologies (Waldbronn, Germany).
Solutions
Mobile phase solutions
Chromatography was performed using Lichrosolv® HPLC-grade acetonitrile (ACN) and ultrapure water from Merck (Darmstadt, Germany) and formic acid (FA) from Biosolve (Valkenswaard, the Netherlands). The mobile phase used for chromatography was constituted of three solutions: ultra-pure water (solution A), ACN (solution B) and FA 1% (solution C). Washing of the needle and the injection loop was performed with 5% ACN in water after each injection. Cytotoxic stock solutions, calibration standard, internal standard, desorption and wiping samples
All solutions (i.e. drug reconstitutions and sample dilution) were prepared in appropriate conditions for handling
hazardous compounds as cytotoxic agents. Moreover, the development of the wiping procedure was performed with brand drugs to avoid direct contact of the operator to the cytotoxic powder and to minimize contamination risk when preparing the working solutions.
Aliquots of the IS were prepared with a mixture of ACN and water (75:25, v/v) at 250μg mL−1and stored at−22°°C for 12 months. No sample degradation was observed. Stock solutions of IS were regularly diluted at 50 ng mL−1 in ACN 20% with FA 0.1%, and they were stable for at least 2 weeks at 2–8°°C.
A main stock solution containing the ten cytotoxic drugs was prepared by diluting each compound in water at a concentration of 20 μg mL−1. This solution was further diluted to obtain five independent stock solutions at 20, 40, 200, 1,000 and 4,000 ng mL−1in ACN 20% with FA 0.1%. For calibration standards (CS), these solutions were diluted by the IS solution at 50 ng mL−1to obtain five CS at 1, 2, 10, 50 and 200 ng mL−1. For desorption samples, the cytotoxic stock solutions were spiked on a wiping paper and desorbed with 1 mL of the IS solution at 50 ng mL−1. For wiping samples, 50μL of cytotoxic stock solutions was spread over the studied surface (10 × 10 cm) by an adjustable volume micropipette, followed by wiping and desorption with 1 mL of the IS solution at 50 ng mL−1. The final concentrations of the ten cytotoxic compounds were at 10, 50 and 200 ng mL−1for desorption and wiping samples. All samples were immediately stored at 15°°C in the LC autosampler and analysed within the day.
Analytical conditions LC–MS/MS method
The LC–MS/MS conditions have been described elsewhere [23]. Briefly, the mobile phase flow rate was set at
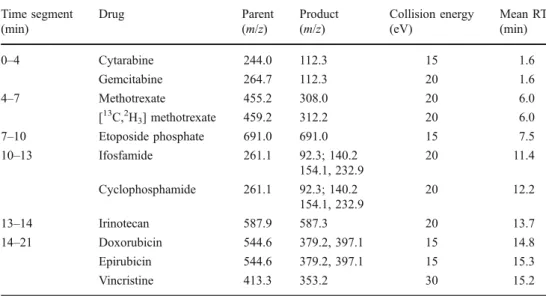
200 μL min−1 using the following gradient elution programme with a constant concentration of 0.1% FA during the entire run: 2% of ACN at 0–2 min, 21% of ACN at 2.5– 10 min, 30% of ACN at 13 min, 50% of ACN from 13.5 to 15.5 min and a re-equilibration step to the initial solvent from 16 up to 21 min. The thermostated autosampler was maintained at 15°C and the injection volume was 25 μL. Positive ESI conditions were: capillary temperature set at 325°°C, spray voltage at 4 kV, and sheath and auxiliary gas (nitrogen) flow rates at 45 and 2 psi, respectively. MS/MS was acquired in selected reaction monitoring mode in Q1 and Q3. The Q2 collision gas (argon) pressure was set at 1.5 mTorr. Chromatographic data acquisition, peak integra-tion and quantificaintegra-tion were performed using the Xcalibur software (ThermoQuest, San Jose, CA, USA). Different time segments were used as reported in Table1.
Desorption step development
Standard solution of the ten cytotoxic drugs at 1,000 ng mL−1 and the IS at 1,000 ng mL−1were spotted on wiping papers to obtain a final amount of 50 ng per sample for each compound. Then, desorption was performed with different desorption solutions (FA 0.1%, 20% ACN with 0.1% FA) and desorption procedures (gentle mixture, ultrasonication for 5 and 20 min). Before LC–MS/MS analysis, a centrifugation step at 2,880 RCF for 5 min was performed to obtain samples without particulate matter such as fibres from the filter paper. Each desorption procedure was repeated in triplicate (N=3).
The best desorption procedure was then evaluated with three series at three concentrations (10, 50 and 200 ng mL−1), with four repetitions each. Cytotoxic solutions at 200, 1,000, 4,000 ng mL−1 were spiked on the filter paper to obtain 10, 50 and 200 ng per sample, put in a PE tube, and 1 mL of the desorption solution (20% ACN with 0.1% FA) Time segment (min) Drug Parent (m/z) Product (m/z) Collision energy (eV) Mean RT (min) 0–4 Cytarabine 244.0 112.3 15 1.6 Gemcitabine 264.7 112.3 20 1.6 4–7 Methotrexate 455.2 308.0 20 6.0 [13C,2H3] methotrexate 459.2 312.2 20 6.0 7–10 Etoposide phosphate 691.0 691.0 15 7.5 10–13 Ifosfamide 261.1 92.3; 140.2 20 11.4 154.1, 232.9 Cyclophosphamide 261.1 92.3; 140.2 20 12.2 154.1, 232.9 13–14 Irinotecan 587.9 587.3 20 13.7 14–21 Doxorubicin 544.6 379.2, 397.1 15 14.8 Epirubicin 544.6 379.2, 397.1 15 15.3 Vincristine 413.3 353.2 30 15.2
Table 1 Instrument method for the LC–MS/MS analysis of the ten cytotoxic drugs with [13C, 2
H3]-methotrexate as internal standard: time segment description
containing the IS at 50 ng mL−1 was added. Desorption was performed by ultrasonication for 20 min followed by centrifugation at 2,880 RCF for 5 min. Finally, 0.5 mL of the clear solution was placed in a vial and LC–MS/MS analysis was performed.
Wiping step development
Standard solutions of the ten cytotoxic drugs at 1,000 ng mL−1 in water were spread over a stainless steel plate (10×10 cm) with an adjustable volume micropipette to obtain a final concentration of 0.5 ng cm−2 for each drug. After solvent evaporation, wiping was performed with three different wiping papers (Whatman, Ahlstrom and Texwipe). Filter
papers were previously wetted with different wiping sol-utions (water, NaOH 0.01 M, FA 0.1%, ACN 20% with 0.1% FA, ACN 50% with 0.1% FA, ACN with 0.1% FA and isopropyl alcohol 70%) and the tested surface wiped using tweezers. Each wiping procedure was followed by the desorption procedure, and LC–MS/MS analysis was repeated in triplicate (N=3).
Quantitative performance of the method applied to different surfaces
Quantitative performance was evaluated with the best wiping and desorption conditions for different surface types, i.e. stainless steel, polypropylene infusion bags,
NL: 5.16E5 244.000 [112.200-112.400] NL: 1.54E4 264.700 [112.200-112.400] NL: 7.86E5 459.200 [312.100-312.300] NL: 1.18E6 455.200 [307.900-308.100] NL: 2.75E4 691.000 [690.900-691.100] NL: 1.22E5 261.100 [92.200-92.400; 140.100-140.300; 154.000-154.200; 232.800-233.000] 1.60 1.62 0 4 8 12 16 20 0 50 100 6.00 6.02 7.49 11.35 12.18 13.66 0 4 8 12 16 20 0 50 100 0 4 8 12 16 20 0 50 100 0 4 8 12 16 20 0 50 100 0 4 8 12 16 20 0 50 100 0 4 8 12 16 20 0 50 100 NL: 9.49E5 587.900 [587.200-587.400] 0 4 8 12 16 20 0 50 100 Irinotecan Ifosfamide Etoposide phosphate Gemcitabine Cyclophosphamide Methotrexate Cytarabine NL: 6.21E4 413.300 [353.100-353.300] Time (min) 15.26 0 4 8 12 16 20 0 50 100 Vincristine [13C, 2H 3] Methotrexate (IS) NL: 1.00E4 544.600 [379.100-379.300; 397.000-397.200] 15.33 0 4 8 12 16 20 0 50 100 14.81 Doxorubicin Epirubicin Relative Abundance
Fig. 1 LC–MS/MS chromatogram of a calibration sample containing the ten cytotoxic drugs and the internal standard at 50 ng mL−1 in ACN 20% with 0.1% FA. Column: ZORBAX SB-C18 RR 2.1 ×
100 mm, 3.5μm; flow rate, 200 μL min−1; gradient conditions are reported in“Experimental” and scan events are shown in Table1
polystyrol bags, glass, latex gloves, computer mouse and coated paperboard. Solutions containing the ten cytotoxic drugs at 200, 1,000 and 4,000 ng mL−1 were spiked on a stainless steel or polypropylene surface to obtain a final surface concentration of 0.1, 0.5 and 2 ng cm−2. For the other surfaces, only one concentration (0.5 ng cm−2) was studied. After solvent evaporation for at least 1 h, wiping with Whatman filter paper wetted with 0.1 mL of ACN 20% with 0.1% FA was performed. Desorption was carried out with 1 mL of ACN 20% with 0.1% FA containing the IS at 50 ng mL−1 by ultrasonication for 20 min and then centrifugation at 2,880 RCF for 5 min. Finally, 0.5 mL of the clear solution was placed in a vial, which was followed by LC–MS/MS analysis.
Evaluation of quantification performance was performed over three independent series with three repetitions for each surface and concentration. Each series involved (1) freshly
prepared calibration, wiping samples (corresponding to the whole procedure: to spread cytotoxic stock solutions on surfaces, evaporation and dried surface wiping) and solvents (LC, desorption and wiping solvents); (2) washing of the column and LC system; (3) LC shut off; (4) cleaning the capillary and cone of the MS with water and methanol; and (5) tuning/calibration of the MS system.
Concentrations of the cytotoxic agents were calculated with reference to a calibration curve constructed the same day with five levels of CS containing the ten drugs (1, 2, 10, 50 and 200 ng mL−1in ACN 20% with 0.1% FA) and weighted linear regression (1/x) for each compound. Calculations were performed using peak area ratios of the ten cytotoxic drugs versus the IS.
Stability of cytotoxic drugs on wiping papers
The stability of the cytotoxic drugs on the filter paper was studied over 3 months. A solution containing the ten compounds was spiked on the Whatman filter paper and the papers kept at 25, at 4 and at−22°C. Desorption and LC–MS/ MS analyses were performed in triplicate on day 0, week 1, and months 2 and 3. Concentrations of the cytotoxic agents were calculated with reference to a calibration curve constructed the same day with five levels of CS (1, 2, 10, 50 and 200 ng mL−1 in ACN 20% with 0.1% FA containing the ten drugs) and weighted linear regression (1/x) for each compound.
Application to surface contamination at the cytotoxic production unit of HUG pharmacy
For the proof of concept, the developed method was applied to the measurement of cytotoxic contamination at HUG phar-macy. Several surfaces of 10×10 cm were tested in the
Gem citab ine Cyc loph osph amid e Meth otre xate Irino teca n Ifosfa mid e Eto posi de phosp hate Cyta rabi ne Vincr istin e Doxo rubici n Epiru bicin 0 25 50 75 100 125 150 Recovery [%] FA 0.1%: gentle mixing FA 0.1%: ultrasonication 5 min FA 0.1%: ultrasonication 20 min ACN 20%, FA 0.1%: ultrasonication 20 min
Fig 2 Desorption step development with Whatman papers: recovery of cytotoxic drugs as function of different procedures: FA 0.1% with gentle mixing, FA 0.1% with ultrasonication for 5 min, FA 0.1%
with ultrasonication for 20 min, and 20% ACN, FA 0.1% with ultrasonication for 20 min
Table 2 Quantitative performance for the desorption of the ten cytotoxic drugs on Whatman filter paper (50 ng per sample) with 1 mL of ACN 20% with FA 0.1%
Recovery (%) Intermediate precision (%)
Cytarabine 102 5.7 Gemcitabine 99 5.2 Methotrexate 99 1.6 Etoposide phosphate 95 1.9 Ifosfamide 102 7.6 Cyclophosphamide 100 4.9 Irinotecan 102 3.7 Doxorubicin 93 3.9 Epirubicin 94 3.6 Vincristine 98 6.4
cytotoxic unit, in the preparation and the logistic areas. However, for some special wiping places such as the door handle and phone, the wiping surface was reduced for practical reasons. Concentrations of the cytotoxic drugs were calculated with reference to a calibration curve constructed the same day with five levels of CS (1, 2, 10, 50 and 200 ng mL−1 in ACN 20% with 0.1% FA containing the ten drugs) and weighted linear regression (1/x) for each compound. A correcting factor for each surface and compound was applied to calculate the surface concentration (see “Quantitative performance of the method applied to different surfaces”).
Results and discussion
Three steps can be distinguished during the wipe sampling procedure: (1) wiping of cytotoxic drugs from the investigated
surface to the filter paper; (2) desorption of drugs from the filter paper to the solution; and (3) LC–MS/MS analysis. Then, quantitative performance of the whole procedure was determined for different surfaces and the stability of the cytotoxic drugs on the wiping papers was studied. The method was finally applied for surface contamination deter-mination at the cytotoxic unit of HUG pharmacy.
LC–MS/MS method
Development and validation of the LC–MS/MS method for the determination of ten cytotoxic drugs has been reported elsewhere [23]. The compounds have been selected among the 20 most prepared cytotoxic drugs at the HUG pharmacy according to toxicity and analytical considerations. These compounds are cytarabine, gemcitabine, methotrexate, etoposide phosphate, cyclophosphamide, ifosfamide,
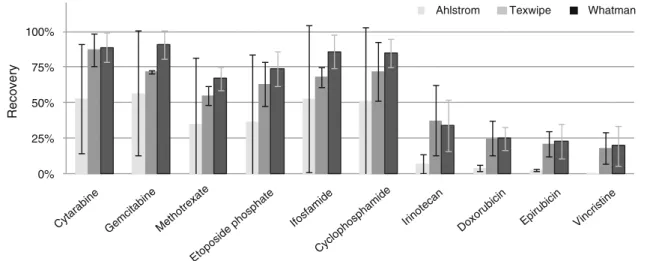
irino-Irino teca n Ifosfa mid e Eto posi dephos phat e Gem citab ine Cyc loph osph am ide Meth otre xate Cyta rabi ne Vincr istin e Doxo rubici n Epiru bicin
Ahlstrom Texwipe Whatman
0% 25% 50% 75% 100% Recovery
Fig 3 Recovery of ten cytotoxic drugs from a stainless steel surface obtained with different wiping papers (Ahlstrom, Texwipe, Whatman) previously wetted by water during wiping step development
Recovery 0% 25% 50% 75% 100% 125% 150% Irino teca n Ifosfa mid e Eto posi dephos phat e Gem citab ine Cyc loph osph amid e Meth otre xate Cyta rabi ne Vincr istin e Doxo rubici n Epiru bicin
NaOH 0.01M H2O 0.1% FA 20% ACN, 0.1% FA 50% ACN, 0.1% FA ACN, 0.1% FA
Fig 4 Wiping step development: recovery of cytotoxic drugs as function of different wiping solvents (water, FA 0.1%, NaOH 0.01 M, 20% ACN with 0.1% FA, 50% ACN with 0.1% FA and ACN with
0.1% FA). Wiping was performed with Whatman filter paper on stainless steel surface as described in“Experimental”
tecan, doxorubicin, epirubicin and vincristine. It can be noted that with 20% of ACN in the wiping samples, cytarabine and gemcitabine were not separated by chroma-tography. The presence of ACN is discussed below, and time segments had to be modified accordingly (Table 1). Calibration samples were also prepared in 20% ACN with FA 0.1%, instead of FA 0.1%. A typical chromatogram, obtained from the analysis of a calibration sample with 50 ng mL−1 of each analyte and 50 ng mL−1 of the IS in 20% ACN with FA 0.1%, is shown in Fig.1.
Desorption step development
Desorption of cytotoxic drugs from the filter paper was performed in PE tubes using 1 mL of the desorption solution. This small volume allowed obtaining a small quantity of cytotoxic waste and satisfying quantification limits (“Quantitative performance of the method applied to different surfaces”).
Several desorption procedures, including gentle mixing and ultrasonication for 5 and 20 min, were compared using FA 0.1% as the desorption solution. Recovery values and confidence interval were calculated for each assay. As shown in Fig. 2, cytarabine, gemcitabine, methotrexate, etoposide phosphate, ifosfamide and cyclophosphamide were not affected by the desorption procedure and exhibited recoveries close to 100% in all the tested conditions. For
the four other compounds, ultrasonication for 20 min improved the desorption rate. In addition, it decreased their confidence interval (inferior to 10%) compared with desorption by gentle mixing and ultrasonication for 5 min. FA 0.1% was first tested to be fully compatible with the LC–MS/MS method [23], but recoveries of only 50–70% were obtained for irinotecan, doxorubicin, epirubicin and vincristine. In order to increase the recovery of these hydrophobic tested substances, 20% ACN was added. Hence, recoveries were close to 100% for all compounds (Fig. 2).
The desorption procedure with 20% ACN, FA 0.1% and ultrasonication for 20 min was evaluated with three series at three concentrations (10, 50 and 200 ng mL−1), with four repetitions each. Concentrations of the desorption samples were calculated from a calibration model constructed the same day. Recovery was expressed in per cent as the ratio between the theoretical and average measured values at each concentration level. Intermediate precisions were expressed as relative standard deviation (RSD) of the ratio of the between-day standard deviation (sR). The sR values were obtained using ANOVA. Recovery values were between 93% and 102% and intermediate precision inferior to 8% at 10, 50 and 200 ng mL−1for all compounds (Table 2). Therefore, the chosen procedure allowed desorption of the ten cytotoxic drugs from filter paper with satisfying quantita-tive performance in the studied concentration range. Table 3 Quantitative performances of the wiping method for the ten cytotoxic drugs on different surfaces at 0.5 ng cm−2
Surface material Stainless steel
Polypropylene Polystyrol Glass Latex gloves Computer mouse Paperboard Cytarabine Recovery (%) 81 79 76 74 58 69 5 Intermediate precision (%) 8.3 7.8 5.8 7.3 18.0 8.8 2.9 Gemcitabine Recovery (%) 82 79 76 74 59 81 5 Intermediate precision (%) 9.5 8.8 6.0 7.7 15.2 6.4 2.5 Methotrexate Recovery (%) 63 85 75 72 50 64 5 Intermediate precision (%) 9.8 5.1 5.2 6.5 12.8 9.8 3.2
Etoposide phosphate Recovery (%) 45 82 73 68 58 81 5
Intermediate precision (%) 7.8 8.2 10.4 11.7 11.0 22.6 1.9 Ifosfamide Recovery (%) 82 91 79 85 65 98 7 Intermediate precision (%) 10.4 8.2 11.2 11.7 17.0 24.8 2.5 Cyclophosphamide Recovery (%) 86 94 71 80 57 77 5 Intermediate precision (%) 10.8 4.8 10.0 15.3 11.4 20.4 2.5 Irinotecan Recovery (%) 57 84 67 65 27 45 15 Intermediate precision (%) 11.8 11.9 14.5 7.7 11.8 12.0 5.3 Doxorubicin Recovery (%) 46 54 47 53 20 35 9 Intermediate precision (%) 5.1 6.1 10.2 10.6 6.8 12.2 3.7 Epirubicin Recovery (%) 46 58 45 55 16 19 13 Intermediate precision (%) 5.2 6.2 6.0 7.6 5.0 11.1 10.6 Vincristine Recovery (%) 50 55 35 56 27 22 13 Intermediate precision (%) 12.0 11.9 13.3 7.6 13.0 12.3 7.1
Wiping step development
Several wiping procedures were evaluated, including different wiping papers and wiping solvents. Wipe sampling was performed on stainless steel surfaces (10×10 cm) to compare the different procedures in the same conditions. Recovery values and confidence interval were calculated for each wiping procedure.
The tested wiping papers were filter paper from Whatman, which have already been successfully used for the desorption of dried blood spots [24,25]; filter paper from Ahlstrom; and wipers from Texwipe. The papers were wetted with water before wiping. As shown in Fig.3, the best recovery values with confidence intervals inferior to 20% were achieved with filter papers from Whatman. Wipers from Texwipe possessed slightly inferior recovery values with similar precision than Whatman papers, but they were not easy to handle for wiping. Filter papers from Ahlstrom gave much lower recovery values with higher variability than the other two papers. Therefore, further experiments were performed with Whatman filter papers.
Filter papers were wetted with 0.1 mL of different wiping solutions, i.e. water, NaOH 0.01 M, FA 0.1%, 20%
ACN with 0.1% FA, 50% ACN with 0.1% FA, ACN with 0.1% FA and isopropyl alcohol 70%. As shown in Fig.4, NaOH 0.01 M was discarded because etoposide phosphate was not detected in wiping samples, probably due to its degradation in basic conditions. Moreover, recovery values inferior to 20% were obtained for doxorubicin, epirubicin and vincristine. Addition of FA 0.1% to water increased the recovery values for gemcitabine, etoposide phosphate, irinotecan and vincristine; better precision values were also obtained for most cytotoxic drugs. Therefore, an acidic wiping solution was selected and different amounts of ACN (20%, 50% and 100%) were tested. The addition of an organic solvent was used to reduce the adsorption of more hydrophobic compounds onto the surface. However, with amounts of ACN superior to 20%, the papers were not easy to handle anymore, resulting in an increased confidence interval. The same phenomenon was also observed with isopropyl alcohol 70% as the wiping solution. The presence of 20% ACN increased the recovery values, and better precision values (confidence interval inferior to 20%) were achieved.
To improve the recovery rate, a second wiping with a new filter paper and a separated desorption procedure was
0% 20% 40% 60% 80% 100% 120% 25°C 0% 20% 40% 60% 80% 100% 120% 4°C cyclophosphamide cytarabine doxorubicin epirubicin etoposide phosphate gemcitabine ifosfamide irinotecan methotrexate vincristine 0% 20% 40% 60% 80% 100% 120% 0 5 10 15 0 5 10 15 0 5 10 15 -22°C Week Recovery
Fig 5 Stability data of the ten cytotoxic drugs on wiping papers stored at−22, 4 and 25°C for 3 months
performed on the same surface. Recovery values between 10% and 15% of the initial spiked amount were found. In addition with the amount found by the first wiping, the total recovery values were still inferior to 75% for methotrexate, etoposide phosphate, irinotecan, doxorubicin, epirubicin and vincristine. This loss of cytotoxicity might be due to adsorption or degradation issues. Only cytarabine, gemcitabine, ifosfamide and cyclophosphamide presented total recovery values be-tween 90% and 100%. Given the low improvement of recovery values with a second wiping, only one wipe was performed in the final procedure and a correcting factor per compound and surface was determined (see below).
Quantitative performance of the method applied to different surfaces
Quantitative performance was studied with three indepen-dent series at three concentrations with three repetitions for the stainless steel plate and polypropylene infusion bag. Among the investigated surfaces, these two areas were most commonly in contact with cytotoxic drugs during the daily preparation of drug formulations. Concentrations of wiping samples were calculated from the calibration model constructed the same day. Recovery was expressed in per cent as the ratio between the theoretical and average measured values at each concentration level. Intermediate precision was expressed as the RSD of the ratio of the between-day standard deviation (sR). The sR values were obtained using ANOVA. Surface-dependent correcting factors for each compound were determined according to the recovery value. This factor was used to calculate the surface contamination for real wiping samples.
Constant recovery values were found for 0.1, 0.5 and 2 ng cm−2(corresponding to 10, 50 and 200 ng mL−1) for all compounds (data not shown). Therefore, the recovery value could be considered as independent of the concentration between 0.1 and 2 ng cm−2. The quantitative performance of the other surfaces (polystyrol, glass, latex gloves, computer mouse and coated paperboard) were determined at only one concentration, i.e. 0.5 ng cm−2(50 ng mL−1). A wide range of recoveries (5–98%) were obtained according to the investi-gated surface and compound (Table3). In general, wiping of smooth surfaces, such as stainless steel, polypropylene, polystyrol and glass, presented higher recovery and smaller RSD values than irregular surfaces such as latex gloves or computer mouse. Wiping of coated paperboard was not successful (recovery values between 5% and 15%), probably due to the absorption of drugs inside the coated paperboard. For the other surfaces, most recovery values were superior to 50% and RSD for intermediate precision inferior to 20%. As expected, some compounds (irinotecan, doxorubicin, epiru-bicin and vincristine) presented lower recovery values, probably due to adsorption or degradation issues. Table
4 Cytotoxic surface contamination at the cytotoxic unit of HUG pharmacy Sampled surface Cytotoxic contamination (nanograms per wiping sample) Cytarabine Gemcitabine Methotrexate Etoposide phosphate Ifosfamide Cyclophosphamide Irinotecan Doxorubicin V incristine Epirubicin Middle of bench flow ND <LOQ <LOQ ND 70 38 <LOQ ND ND ND Sleeves inside isolator 10 24 <LOQ 62 >200 28 94 ND <LOQ ND Balance ND <LOQ <LOQ ND 85 24 <LOQ ND ND ND Door handle inside isolator <LOQ 65 <LOQ 20 >200 98 28 ND ND <LOQ Floor in front of isolator ND ND ND 42 ND ND <LOQ ND ND <LOQ Product storage box at 4°C <LOQ <LOQ ND 10 <LOQ <LOQ <LOQ ND ND ND Product storage box at 25°C <LOQ >200 <LOQ ND 27 <LOQ ND ND ND ND Phone ND ND ND ND ND ND < LOQ ND ND ND ND not detected
Limits of quantification (LOQs) were based on the validation of the LC–MS/MS [23] method and the determined correction factor for the wiping procedure. LOQs for all cytotoxic drugs were set at 10 ng per wiping sample, or 0.1 ng cm−2.
Stability of cytotoxic drugs on wiping papers
According to the number of wipe samples, the wipe location and the reduced availability of the LC–MS/MS instrumentation, storage of filter papers might be very interesting. Therefore, the stability of cytotoxic drugs on the filter paper was studied over 3 months at three storage temperatures (−22, 4 and 25°C) in a light-protected area (Fig.5). At 25°C, only ifosfamide was stable for 3 months, whilst all other drugs presented recoveries inferior to 80% after 2 months. Concentrations of etoposide phosphate, doxorubicin, epirubicin and vincristine were already de-creased to 20% after 1 week. At 4°C, the wiping samples were stable for 1 week, with at least 80% of the initial concentration found for all drugs. After 2 months, the concentrations of doxorubicin, epirubicin and vincristine were inferior to 50% of the initial amount, and at 3 months, 50% of etoposide phosphate was lost. The other com-pounds were stable for 3 months at 4°C. However, the best storage conditions for all drugs were obtained at−22°C: All cytotoxic drugs presented acceptable recoveries between 90% and 110% after 2 months. After 3 months, values above 50% were obtained. Therefore, wiping samples could be kept at−22°C for 2 months until desorption procedure and LC–MS/MS analysis.
Application to surface contamination at the cytotoxic production unit of HUG pharmacy
In order to demonstrate the applicability of the developed method to real samples, the contamination rate of the ten cytotoxic agents was measured on different places of the cytotoxic unit at HUG pharmacy. The sample locations included places in the cytotoxic production area such as working surfaces, floor in front of the isolator door, and in the storage and checking room for cytotoxic drugs, including phone, refrigerator, storage shelves and others (Table4). Gemcitabine, ifosfamide and cyclophosphamide were the most commonly detected drugs. This finding could be explained by the necessity of the operators to reconstitute these drugs before dilution, the high pre-scribed concentrations or the quantity of preparations during the days before wiping. Most of the contamination was found inside the isolator, and only some traces of cytotoxic drugs were outside the production zone (inferior to LOQ). To reduce contamination inside the isolators, some actions should be applied, such as more efficient
cleaning procedure with the use of different cleaning solvents or enhanced cleaning frequency.
Conclusions
A wipe sampling procedure coupled to LC–MS/MS was developed for the determination of ten cytotoxic drugs on different surfaces. To the author’s knowledge, this work describes the first wiping method allowing the simultaneous quantification of ten cytotoxic drugs from different therapeu-tic families, with well-established quantitative performance in terms of recovery and precision. Seven surfaces, the most commonly encountered in hospital production units, were investigated, and the recovery values were clearly defined according to surfaces and compounds. Therefore, this approach is particularly suitable for environmental monitoring and can be used to identify exposure of hospital staff who handles cytotoxic drugs and to validate decontamination procedures. Finally, the method was successfully applied for the determination of surface contamination at the cytotoxic production unit of HUG pharmacy.
Acknowledgements The authors kindly thank the Proteomics Core Facility at the Faculty of Medicine, University of Geneva (Switzerland) for the loan of the LC–MS/MS instrument and the Unit of Toxicology, University Center of Legal Medicine, Geneva (Switzerland) for the wiping papers.
References
1. Falck K, Gröhn P, Sorsa M, Vainio H, Heinonen E, Holsti L (1979) Lancet 8128:1250–1251
2. Touzin K, Bussières J-F, Langlois E, Lefebvre M (2009) J Oncol Pharm Pract 15:53–61
3. BGW (2009) Forschungsprojekt MEWIP.http://www.pharma-monitor. de/download_mewip/MEWIP-Abschlussbericht_Sept_2008.pdf. Accessed 20 July 2010
4. Latour JF (2008) Eur J Hosp Pharm Pract—ESMO Supplement, pp 23–25
5. Weir PJ, Rigge DC, Holmes A, Fox E (2009) Hosp Pharm Eur 47:58–60
6. Brouwers E, Huitema A, Bakker E, Douma J, Schimmel K, van Weringh G, de Wolf P, Schellens J, Beijnen J (2007) Int Arch Occup Environ Health 80:689–699
7. Wallemacq P, Capron A, Vanbinst R, Boeckmans E, Gillard J, Favier B (2006) Am J Health Syst Pharm 63:547–555
8. Connor TH, Anderson RW, Sissink PJM, Broadfiled L, Power L (1999) Am J Health Syst Pharm 56:1427–1432
9. Sabatini L, Barbieri A, Tosi M, Violante FS (2005) J Mass Spectrom 40:669–674
10. Turci R, Sottani C, Spagnoli G, Minoia C (2003) J Chromatogr B 789:169–209
11. Turci R, Sottani C, Ronchi A, Minoia C (2002) Toxicol Lett 134:57–64
12. Schreiber C, Radon K, Pethran A, Schierl R, Hauff K, Grimm C-H, Boos K-S, Nowak D (2003) Int Arch Occup Environ Health 76:11–16
13. Pethran A, Schierl R, Hauff K, Grimm C-H, Boos K-S, Nowak D (2003) Int Arch Occup Environ Health 76:5–10
14. Sottani C, Rinaldi P, Leoni E, Poggi G, Teragni C, Delmonte A, Minoia C (2008) Rapid Commun Mass Spectrom 22:2645–2659 15. Sottani C, Porro B, Comelli M, Imbriani M, Minoia C (2010) J
Chromatogr B 878:2593–2605
16. Hedmer M, Tinnerberg H, Axmon A, Jönsson B (2008) Int Arch Occup Environ Health 81:899–911
17. Connor TH, DeBord DG, Pretty JR, Oliver MS, Roth TS, Lees PSJ, Krieg EFJ, Rogers B, Escalante CP, Toennis CA, Clark JC, Johnson BC, McDiarmid MA (2010) J Occup Environ Med 52:1019–1027
18. Nygren O, Lundgren C (1997) Int Arch Occup Environ Health 70:209–214
19. Turci R, Minoia C (2006) Ann New York Acad Sci 1076:649–656
20. Schierl R, Böhlandt A, Nowak D (2009) Ann Occup Hyg 53:703– 711
21. Schmaus G, Schierl R, Funck S (2002) Am J Health Syst Pharm 59:956–961
22. Sottani C, Turci R, Schierl R, Gaggeri R, Barbieri A, Violante FS, Minoia C (2007) Rapid Commun Mass Spectrom 21:1289– 1296
23. Nussbaumer S, Fleury-Souverain S, Antinori P, Sadeghipour F, Hochstrasser D, Bonnabry P, Veuthey J-L, Geiser L (2010) Anal Bioanal Chem 398:3033–3042
24. Déglon J, Thomas A, Daali Y, Lauer E, Samer C, Desmeules J, Dayer P, Mangin P, Staub C (2011) J Pharm Biomed Anal 54:359– 367
25. Thomas A, Déglon J, Lenglet S, Mach F, Mangin P, Wolfender J-L, Steffens S, Staub C (2010) Anal Chem 82:6687–6694