Characterization of the Down Regulation of Antibody Production
in High Cell Density Perfusion Culture
by
Joyce Catherine Morrill
B.S. Chemical Engineering, Massachusetts Institute of Technology (1984) M.S. Mechanical Engineering, Duke University (1987)
SUBMITTED TO THE DEPARTMENT OF APPLIED BIOLOGICAL SCIENCES IN PARTIAL FULFILLMENT OF THE REQUIREMENTS FOR THE DEGREE
OF
DOCTOR OF PHILOSOPHY in
BIOTECHNOLOGY at the
MASSACHUSETTS INSTITUTE OF TECHNOLOGY May, 1994
Copyright © 1994
Signature of Author
Certified by
Accepted
by..
Massachusetts Institute of Technology All rights reserved
(...__ I~~~_
Departint of/Applied Biological Sciences May 13, 1994
-- / William G. Thilly Professor of Applied Biology and Civil Engineering Thesis Supervisor
Steven R. Tannenbaum Chairman, Departmental Committee on Graduate Students
- , i ~ w
"This doctoral thesis has been examined by a Committee of the Department of Applied Biological Sciences as follows:"
Professor Steven R. Tannenbaum
Professor William G. Thilly
Professor Sam Singer
Professor Vernon Young
-' Chairman
Thesis Supervisor
- //
/-Professor Helmut Zarbl
Characterization of the Down Regulation of Antibody Production in High Cell Density Perfusion Culture
by Joyce Morrill
Submitted to the Department of Applied Biological Sciences on May 13, 1994 in partial fulfillment of the requirements for the degree of
Doctor of Philosophy in Biotechnology Abstract
A marked drop of secretory protein production with increasing cell density is a common problem with industrial scale bioproduction. Research in this laboratory with a high density perfusion reactor has reproduced this phenomenon at the bench scale using an antibody producing cell line. As the cell density increased from 106 to 107 c/ml, the antibody secretion rate declined 10 fold from about 0.2 to 0.02 pg/cell-h. The reversibility of the down regulation was demonstrated by removing cells from high density and observing that at lower density these cells regain their secretion ability. A concomitant but unexplained metabolic change is that the overall uptake rate of amino acids declines by 5 fold (Tyo, 1991).
This research answers two questions. The first question is, "What is the signal for the reversible decrease in antibody production ?" Three hypotheses have been examined: nutrient limitation, cell-to-cell contact inhibition, and a diffusible inhibitor. The nutrient limitation theory was eliminated because amino acids and saccharides were not depleted at high cell density (Tyo, 1991), and antibody production was not restored by increases in serum components and sulfur containing compounds. The cell to cell contact theory was eliminated as a primary down regulator because high density medium (without cells) inhibited antibody production, and membrane fractions did not inhibit production. Diffusible inhibitors are the external signal for the decrease in antibody production. Lactate and ammonia are the primary inhibitors, accounting for about 2/3 of the inhibition of antibody production. Experiments with fractionated high density, low productivity media showed that the additional factors inhibiting antibody production are of 10,000 MW or less.
The second question is, "What do cells do with the excess of amino acid uptake at low density ?" Cells at low density in the bioreactor take up amino acids at a rate greatly exceeding requirements for protein and nucleotides. Most of this "excess" can now be attributed to de novo lipid synthesis. I have investigated several major changes in cell biochemistry coincident with the decrease in antibody production and increase in cell density. With the experimental data for growth rates, cellular content, and amino acid uptake rates, the mass balance on amino acid uptake at both high and low cell density is now closed. By flow cytometry, I demonstrated that the cells continue to grow in the reactor and that cell cycle time lengthens by 25% (at high density). Between 1 and 10 million cells/ml, cellular content declines: (a) 66% decline in total lipid per cell, (b) 33% decline in total protein, and (c) 85% decline in the free amino acid pool. This correlates with a 50% decline in cell volume. I found that the uptake of radioactive leucine into lipid is a function of cell density. The changes in lipid are, however, not a function of the antibody inhibitors lactate and ammonia. Because amino acid uptake into lipid declines as a function of cell density, and because of the decline in total lipid per cell, the amino acid requirements for lipid synthesis becomes much less than protein and nucleotides at high density.
Acknowledgments
[ would like to thank the many people that have made this thesis possible.
[ thank my advisor, Bill Thilly, for teaching me the science of cell culture and for giving me the intellectual space and tools to explore these research questions.
I thank my committee members, Steve Tannenbaum, Helmut Zarbl, Vernon Young, and Sam Singer, for their time and guidance.
I am thankful for financial support from Centocor Inc. and MIT for this work. The cell line and methods for assaying antibody production was donated for research by Centocor.
This research project began as a collaboration with Mike Tyo and Claudia Buser. Early bioreactor experiments lead to the discovery of the decrease in antibody production at high cell density, and to a team effort in investigating the biological changes.
The technical assistance of others is gratefully acknowledged. Lori Tsurida isolated the the high producing clone that we used. Peter Becker contributed to the second bioreactor experiments. Jackie Griffith helped with many experiments over the years. Thanks to the members of the Langer and Grodzinskey groups for the use of the plate readers. I would like to thank Stuart Conner and Glen Paridis in the flow cytometry lab for sorting
samples, for helping me to work out experimental procedures and for teaching me how to run samples.
For their friendship, support, and assistance I thank the many members of the lab group and department past and present including: Rita Cha, Jia Chen, Hilary Coller, Rita
DeMeo, Cindy Flannery, Jackie Griffith, John Hanekamp, Carolyn Hoemann, Gengxi Hu, Debra Luchanin, Lata More, Riitta Mustonen, and Diane Rose, and especially Claudia Buser and Mike Tyo.
I: am thankful to my parents and my sister for their consistent support of my education.
Last but not least, for the many years of support, understanding and patience I would like to thank my wonderful husband Jeff. This thesis is dedicated to our now seventh month old daughter Valerie, who was an inspiration to finish this thesis.
Contents
Title Page...1 Committee Page ... 2 Abstract ... ... 3 Acknowledgments...4 Table of Contents ... 5 List of Figures ... 7 List of Tables...8List of Symbols and Abbreviations ... .9
I. Introduction . ... 12
A. Background ... 12
1. Antibodies for Human Use ... 12
2. Reactor Systems for High Density Production of Antibodies ... 15
B. Problems in Achieving High Density Production . ...18
1. Irreversible Loss of Antibody Production ... 19
2. Reversible Loss of Antibody Production ...20
C. Reversible Decrease of Antibody Production in CLC Cells ...22
D. Changes in Hybridoma Metabolism at High Density ... 23
E. Goals of Research ... 26
II. Experimental Techniques
... 27
A. Cell Culture ... .... . ... 27
B. Analytical Techniques ... 31
1. Antibody Measurements ... 31
2. Cell Cycle Analysis...32
3. Extracellular Metabolic Concentrations ...33
4. Cellular Membrane Preparation ... 33
5. Fractionation of Inhibitors ... 34
6. Leucine Uptake ... 35
7. Lipid and Protein per Cell . ... 36
C. Kinetic Equations ... 37
1. Growth and Death ... 37
2. Antibody Production ... 39
3. Substrate Consumption ... 40
III. Results ... ... 42
A. Decrease in Antibody Production in High Density Culture ... 42
1. Bioreactor Experiments ... 42
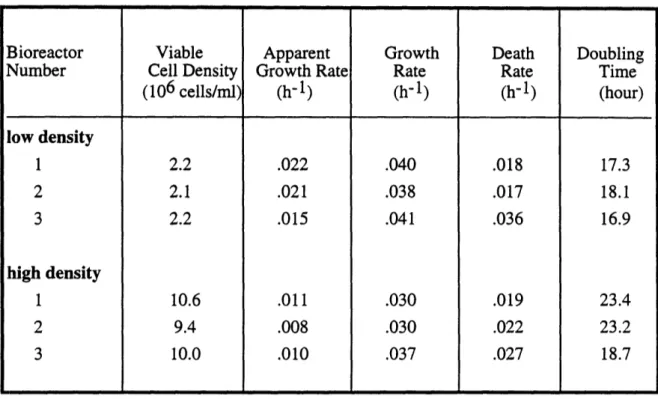
2. Growth and Death Rate Analysis . ... 46
2.1 Doubling Time Estimates by Kinetic Modeling ...46
2.2 Doubling Time Estimates by Flow Cytometry ...48
3. Population Shifts to Lower Producers ...52
B. Nutrient Limitation ... 56
1. Utilization of Amino Acids, Glucose and Pyruvate...56
2. Adding Serum, Vitamins and Amino Acids in Low Density Experiments ... 58
5. Oxygen Limitation ... 63
C. Cell to Cell Contact ... 64
1. Medium from Bioreactors Inhibits Growth and Antibody Production ... 65
1.1 Growth and Antibody Secretion in Microwell Cultures ...65
1.2 Growth Inhibition in T Flask Cultures... 67
1.3 Intracellular Antibody Contents in Spinner Cultures.68... 68
2. Membranes from the Secreting and Nonsecreting Cell Lines Do Not Inhibit ... 70
D. Diffusible Inhibitors ... 73
1. Secreted Amino Acids Do Not Inhibit Antibody Production ...74
2. Lactate and Ammonium Decrease Antibody Production ...75
3. Redox Potential Alone Does Not Inhibit Antibody Production. ...76
4. The Combined Effects of Lactate, Ammonium and Redox...79
5. A High Molecular Weight Inhibitor Was Not Found ...83
E. Shift in Amino Acid Utilization ... 87
1. Metabolic Shift in Amino Acid Uptake ...87
2. Incorporation of Leucine into Lipid is a Function of Cell Density...93
3. The Free Amino Acid Pool is a Function of Cell Density ...97
4. Cellular Content of Protein and Lipid Declines with Cell Density ... 100
IV. Discussion ... 103
A. Cause of Decreased Antibody Production . ...103
1. Nutrient Limitation Did Not Occur... 103
2. Cell to Cell Contact Did Not Signal Decreased Antibody Production... 106
3. At Least Three Inhibitors Did Signal Decreased Antibody Production 108 3.1 No Inhibition by Secreted Amino Acids ... 108
3.2 Ammonia and Lactate are Two of the Inhibitors ... 110
3.3 Additional Inhibitor of Less Than 10,000 MW ... 111
3.4 Identity of Unknown Inhibitor ... 113
3.5 Growth Associated Behavior ... 115
B. Further Characterization of Density Effects ...118
1. Density Dependence of Nutrient Uptake . ... 118
2. Density Dependence of Amino Acid Pools ... 119
3. Density Dependence of Amino Acid Uptake ... 120
4. Density Dependence of Cell Size ... ... 122
C. Mass Balance of Amino Acids ... 125
V. Conclusions ... 132
VI. Suggestions for Future Research . ...
137
A. Suggestions to Improve Antibody Production at High Density ...137
B. Further Characterization of Unknown Inhibitors ... 139
C. Further Analysis of Amino Acid Uptake...141
List of Figures
1. Metabolic Pathways ... 24
:2. Schematic of Perfusion Bioreactor ... 29
3. Viable Cell Density in Bioreactors ... 44
4 Reversible Decline of Antibody Secretion ... 44
5. Specific Antibody Production vs. Viable Cell Density ...45
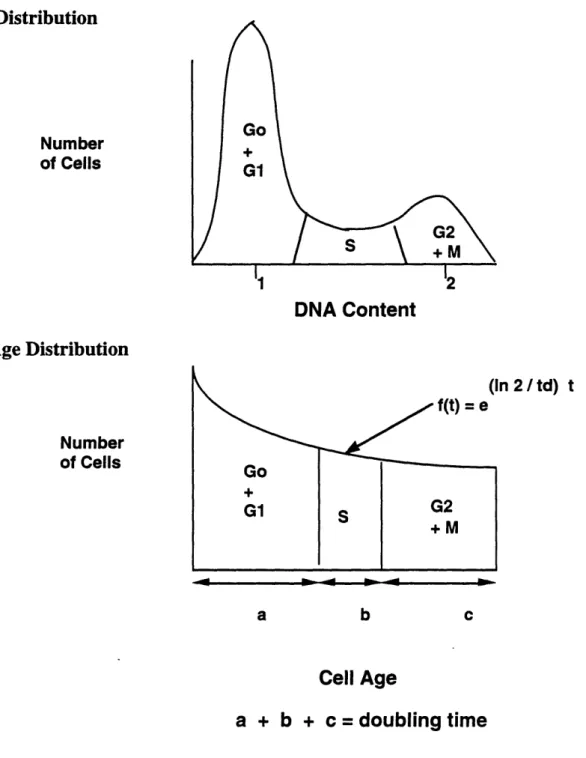
6. Distribution of Cells by DNA Content and by Cell Age...49
7. Histogram of LGFL to Heavy Chain of Sample Removed at Day 20 and Passaged Two Weeks at Low Density ... 53
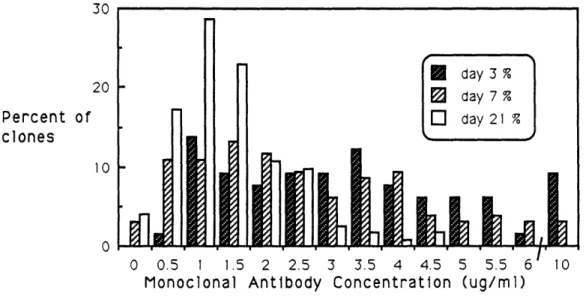
8. Analysis of Clonal Populations Isolated from Bioreactor: Samples were Carried Two Weeks at Low Density ...54
9. Nutrient Limitation Experiments in Three Bioreactor Runs ...62
10. Antibody Secretion of Low Density Cells in Test Supernatants ...66
11. Doubling Time of Low Density Cells in Test Supernatants ...66
.12. Growth in Bioreactor #4 High Density, Low Productivity Media ...67
.13. Growth with Addition of Crude Membranes ...71
14. Viability with Addition of Crude Membranes ...71
1L5. Doubling Time with Addition of Crude Membranes ...72
16. Antibody Secretion with Addition of Crude Membranes ...72
17. Antibody Productivity vs. Calculated Redox Potential in Bioreactor #1 ... 76
118. Viable Cell Density vs. Calculated Redox Potential in Bioreactor #1 ... 77
19. Antibody Production at Lower Density in Redox Media...78
20. Histograms of Intracellular Antibody Content after 4 Days in Lactate, Ammonia, and Redox Conditions ... 80
21. Histograms of Intracellular Antibody Content of Cells Removed from Bioreactor #4 ... 82
22. Fractionation of High Density, Low Productivity Media ...84
23. Total Amino Acid Uptake Rates vs. Time ... 88
24. Total Amino Acid Uptake Rates vs. Cell Density ...88
25. Antibody Production vs. Total Amino Acid Uptake ...89
26. 14C-Leucine Uptake into Lipid...95
27. 14C-Leucine Uptake into Protein ... 96
28. 14C-Leucine Uptake into Free Amino Acids ... 96
29. Intracellular Concentration of Leucine vs. Cell Density ...98
30. Intracellular Concentration of Imported Amino Acids vs. Cell Density...98
31. Intracellular Concentration of Exported Amino Acids ...99
32. Protein Content per Cell as a Function of Cell Density ... 101
33. Lipid Content per Cell as a Function of Cell Density ... 101
34. Antibody Secretion Rate per Protein or Lipid Content ... 102
List of Tables
l. US Market for Monoclonal Antibodies ($ Millions) ... 14
2. Purification of Crude Membranes ... 34
3. Growth and Death Rates from Kinetic Modeling ... 47
4 Doubling Time Values from Flow Cytometry ... 50
5. Mean and Median Antibody Concentrations for Clonal Populations ...54
6. Extracellular Nutrient Concentrations at High Density ...57
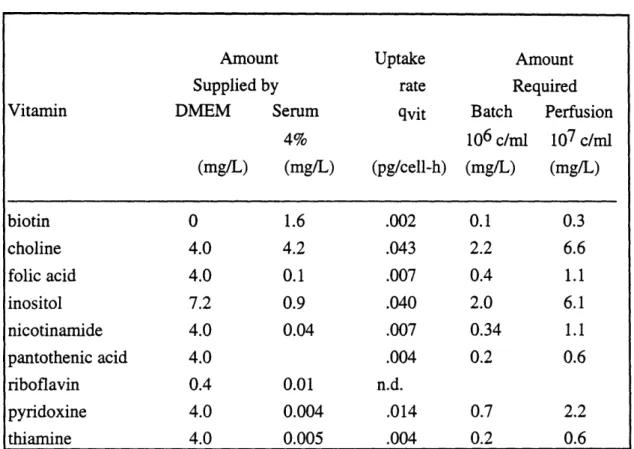
7. Estimated Vitamin Utilization: Vitamins are not Depleted ...60
8. Intracellular Antibody Content after Growth in High Density, Low Productivity Media ... 68
9. Amino Acid Imbalance, Addition of Amino Acids to Fresh Medium...74
10. Effect of Added Lactate and/or Ammonium to Spinner Cultures ...75
11. Two Days in Lactate, Ammonia and Redox Conditions ... 81
12. Four Days in Lactate, Ammonia and Redox Conditions ...81
13. Comparison of Fractionated Test to Reconstruction Experiments ...85
14. A Major Metabolic Shift Involves Amino Acid Utilization ...91
15. Incorporation of 3H-[3,4,5]-Leucine into Cellular Components ...94
16. Amino Acid Transport Systems ... 109
17. Mass Balance on Amino Acid Uptake ... 128
List of Symbols and Abbreviations
Ala alanine Arg arginine Asp aspartate Asn asparagine c cells Ci Curiecpm counts per minute
D dilution rate in bioreactor (h-1) DMEM Dulbecco's Modified Eagles Medium
DMEM* Dulbecco's Modified Eagles Medium supplemented with 6 mM glutamine, 2 mM pyruvate, and 50 gM -mercaptoethanol
Eh redox potential (mV)
E'0 standard potential of redox couple (mV)
F flow rate (ml/h)
F Faraday constant (96,406 joule/volt) FBS fetal bovine serum
fmole femtomole (10-15 mole) Go resting phase of cell cycle G 1 gap 1 phase of cell cycle G2 gap 2 phase of cell cycle
Gln glutamine
Glu glutamate
Gly glycine
h time (hours)
HDLP high density, low productivity
His histidine
IgG immunoglobulin G
Ile isoleucine
1 liter
Leu leucine
mg milligram ml milliliter (10-3 mole) mM millimolar (10-3 mole/l) g.M micromolar (10-6 mole/l) mV millivolt (10-3 volt) n.d. not determined
PBS phosphate buffered saline
pg picogram (10-12 gram)
Phe phenylalanine
pmol picomole (10-12 mole)
Pro proline
Q volumetric flow rate (ml/min)
Qp volumetric rate of product formation (mole/l-h or g/l-h) qp specific rate of product formation (mole/cell-h or g/cell-h) Qs volumetric rate of substrate utilization (mole/l-h)
qs specific rate if substrate utilization (mole/c-h) R gas constant (8.31 joule/OK-mole)
s time (seconds)
S synthesis phase of cell cycle or
S substrate concentration (mole/l) Si inlet substrate concentration (mole/l) So initial substrate concentration (mole/l)
Ser serine
t time (seconds, minutes or hours) td doubling time of cells (hours)
T temperature (OK) The threonine Trp trptophan Tyr tyrosine V bioreactor volume (ml) Val valine
X cell concentration (cells/ml) Xo initial cell concentration (cell/ml) XD dead cell concentration (cell/ml) XV viable cell concentration (cell/ml)
oa specific death rate (h- 1)
e separation ratio of cells removed from reactor (dimensionless) ED separation ratio of dead cells (dimensionless)
EV separation ratio of viable cells( dimensionless)
A specific growth rate (h- 1)
I.
Introduction
A. Background
1. Antibodies for Human Use
The recent advances in biotechnology have provided the possibility for the diagnosis and treatment of human diseases with large quantities of proteins. Instead of purifying proteins from animal sources, cells which produce the desired product are grown in a regulated cell culture system of either bacteria, yeast, or mammalian cells. Currently marketed proteins produced from bacteria cells (E. coli) are recombinant human insulin, human growth hormone and interferon-alpha 2a. The hepatitis B vaccine is produced in yeast cells. Marketed proteins produced from mammalian cells are tissue plasminogen activator, Factor VIII, erythropoietin, beta-interferon and monoclonal antibodies. Mammalian cells are chosen over yeast or bacterial cells when the protein requires post-translational modifications, such as glycosylation, proteolytic cleavage, or disulfide bond formation. Another advantage of mammalian cells is that the protein is secreted in an active form. The sales from these biotechnology products about 50% from mammalian cells (Spier, 1991). The sales of monoclonal antibodies for health care in the US is projected to increase to one sixth of the market share of recombinant proteins (Frost and Sullivan, 1989).
Antibodies, as found in blood serum, are a heterogeneous mixture of proteins which bind with great specificity to a foreign substance called an antigen. The antigen is often a protein or polysaccharide. The antibodies bind specifically to the three dimensional structure of the antigen in a "lock and key" fashion. B Lymphocyte cells secrete antibodies in response to an antigen. In vivo, many antibody proteins may bind to each antigen, and many antigens are present.
An antibody (or an immunoglobulin) protein consists of four amino acid chains, two heavy chains and two light chains. The four chains are joined by inter and intrachain disulfide bonds. There are five classes of antibodies that play different roles in the body. One portion of each chain is variable in sequence, the rest of the chain is constant for the class. The antigen binding regions are composed of the variable parts of each heavy and light chain. The variable sequences form unique three-dimensional pockets in which an
antigen binds. Each immunoglobulin has two identical antigen binding regions. A binding region is specific to a single region of an antigen, such as 5 or 6 amino acids or sugar residues of a protein.
The five classes of human antibodies proteins are designated IgG, IgA, IgM, IgD and IgE, and vary in the constant regions of the heavy chains. The corresponding heavy chains are calls y, a, g, and e. The molecular weights of the heavy chains range from 50,000 to 70,000. The light chains in any class are of either two types (K of A) with molecular weight of 23,000. IgG, IgD and IgE are composed of two heavy (H) and two light chains (L) for H2L2. IgM is composed of five H2L2 units joined by five joining (J) chains. IgG consists of -75% of all the antibody in the blood. IgA is in body secretions as a dimer (H2L2)2 with a secretory component and a J chain, and as either the dimer (without the secretory component) or H2L2 in the blood. Subclasses of H chains also divide the classes IgG, IgM and IgA. Characteristics of the IgG class include ability to signal other cells by activating the complement cascade and cytotoxic activity through receptor interactions. The four subclasses of IgG differ in their cytotoxic activity and complement activity. IgG is the only class that crosses the placenta. IgM is expressed first during an immune response, and has antibacterial activity, and the highest complement fixation activity. In secretions, IgA blocks antigens and has antivirial and antibacterial activity. Both IgG and IgA boost the immune system of infants through mothers milk. IgD is the class predominantly present on the surface of B lymphocytes. IgE is present in the lowest concentrations in blood and is associated with allergic type reactions. In the production of antibodies, cell lines secreting IgG or IgM are most likely to be produced by the fusion technique of K6hler and Milstein (1975), described below.
K6hler and Milstein (1975) developed a methodology to fuse a mortal antibody-producing B lymphocyte cell with an immortal B lymphocyte tumor cell, resulting in a hybrid cell line (or hybridoma) producing identical antibody molecules. Before then, in order to isolate antibody one had to immunize animals and purify blood serum, resulting in a heterogeneous (or polyclonal) mixture of antibodies. The technique of K6hler and Milstein allowed for isolation and expansion of single hybridoma cells into a population of identical cells (or clones) producing a homogeneous (or monoclonal) solution of antibody. By this method, an animal is injected with the antigenic substance and after the animal has had time to produce an immune response, the spleen (containing B
immortal tumor cells are deficient in an enzyme required for the salvage pathway of nucleotides and will not grow in the selective media. The selective media, HAT, blocks the de novo pathway for nucleotide synthesis with aminopterin and supplies precursors to the salvage pathways, hypoxanthine and thymidine. The spleen cells do not grow in culture, and only fused cells survive in the HAT media. The population of fused cells are plated as single cells into multiwell plates and allowed to grow as clones of cells. Each clones produces one antibody protein. The media from the wells are tested for presence of the desired antibody, and selected clones of cells are expanded for production of the monoclonal antibody. Monoclonal antibodies have been produced in the past in vivo in the ascities fluid of rodents, and currently in vitro in cell culture.
The practical significance of improved antibody production is to reduce the production costs of proteins for health care for applications ranging from cancer therapy to medical imaging to diagnostics. Antibodies find many applications because they bind with great specificity to antigens such as on the surface of cancer cells and other disease-related antigens. A summary of the US demand for antibodies is presented in the following table. The demand for monoclonal antibodies is predicted to reach $18 billion by 2000 (The Freedona Group, 1991). The home medical testing market is dominated by pregnancy and ovulation prediction kits. In vivo imaging products use radioactivity labeled antibodies to locate cancers and cardiovascular disease. The largest growing application in the in vitro diagnostics market is testing for AIDS. Antibodies for therapeutic uses have been developed for the treatment of cancers (or immunotherapeutics), such as breast and colon, and for autoimmune diseases, such as rheumatoid arthritis.
Table 1: US Market for Monoclonal Antibodies ($ Millions)
year 1990 1995 2000
Home Medical Testing 125 310 530
In Vitro Diagnostics 930 3100 7800
Therapeutic 75 700 7500
In Vivo Imaging - 250 1560
Other 105 240 410
By the year 2000, the anticipated therapeutics market will require thousands of kilograms of antibody protein per year. Monoclonal antibodies used for human use sell for as much as 10 to 100 million dollars per kilogram due to the high cost associated with clinical trials, purification and quality assurance testing required for human injections (Leist, 1990). Using hundreds of milligrams per patient per year for 10,000 patients would require kilograms of antibody per year in order to treat a single form of cancer. For example, Sears et. al. (1985) used single doses of 200 to 250 mg of the murine 17-1A antibody in phase II clinical trials to treat gastrointestinal tumors. Antibody products are being developed to treat such cancers as: colorectal, prostate, lung, ovarian, breast, lymphatic, leukemia and melanoma.
2. Reactor Systems for High Density Production of Antibodies
Research in the field of monoclonal antibody production is driven by the needs for simple, practical and economic methods for producing antibody protein. A variety of reactor systems have been developed to produce antibody protein. The simplistic view of optimizing production is that by increasing the cell density by a factor of ten, ten times the nutrients are required and ten times the product is excreted. In reality, there is a density dependence of the metabolism of the cells and the production kinetics. The goal of this work is to characterize the effects of high cell density on one antibody producing cell line.
To reduce costs of purification, high density culture with a high antibody concentration is favored over a low density, low antibody concentration culture. Antibody producing cells do not attach to surfaces and grow freely in suspension. Antibody producing cells can be grown in any of the following methods of culture:
* batch -- cells are grown in a bioreactor without replenishing nutrients or removing metabolic products
* continuous culture -- cells are grown in a bioreactor with continuous supply of nutrients and continuous removal of cells and metabolic products
* perfusion culture -- like continuous culture, cells are grown in a bioreactor with continuous supply of nutrients and removal of metabolic products and antibody, but most or all of the cells are prevented from exiting the bioreactor
Both batch and continuous cultures give relatively low, maximum cell density on the order of 106 cells/ml. By retaining cells in a reactor and continually feeding nutrients and removing metabolites, perfusion systems can achieve cell densities of 107 to 108 cells/mi.
High densities of suspension type, antibody producing cells, have been achieved in both homogeneous (well-mixed) and heterogeneous perfusion systems. Some recent examples of heterogeneous perfusion systems used for antibody production include entrapment in hollow fibers (Altshuler et. al., 1986a; Klerx et. al., 1988), immobilization in packed beds of foam (Karkare et. al., 1985) or glass (Bliem et. al., 1992), and encapsulation in beads of alginate (Sinacore et. al., 1989) or capsules of chitosan - carboxymethyl-cellulose (Yoshioka et. al., 1990). Although these systems achieve high densities of cells (108 cells/ml), and sometimes high concentrations of antibody protein, they are not well mixed for nutrients or oxygen. Therefore the conditions of the bioreactor are not uniform and some conditions are suboptimal. During the operation of hollow fiber systems flow patterns must be alternated to prevent regions were oxygen and other nutrients are depleted or pH is decreased. Similarly, encapsulated cells in the center of beads have a different environment then cells at the surface of beads. Densities of immobilized systems are often limited by oxygen transfer. In a homogenous perfusion system, in contrast, all or most of the culture is retained in a stirred tank, and optimal conditions can be maintained uniformly throughout the bioreactor.
To study the effects of high cell density on metabolism and antibody production a continuous suspension, perfusion culture was selected. To maintain a high cell density a cell separation method is required, and a conical cell settling device was developed for this research (Tyo, 1991). This device separates cells by inclined sedimentation without moving parts. Against an upward flow of media, the cell separator operates on the principle of gravity settling cells down an inclined plane. (The bioreactor system is described further in section II.A).
This novel, conical cell settler design was selected over previously existing devices. Some researchers have used systems which require the continual pumping of cells out of the reactor, into the separation device, and returning the cells back to the reactor. Examples of such designs used to study antibody production include tangential flow cartridges (Reuveny et. al., 1986), hollow fibers (Flickinger et. al., 1990; Seamans and Hu, 1990; Smith et. al., 1991; Hiller et. al., 1993), and continuous centrifuges (Hamamoto et. al., 1989; Tokashiki et. al., 1990). Eliminating the passage of cells
through pumps, Shirai et. al. (1991) placed a .45 micron membrane at the bottom of a stirred reactor and achieved densities up to 7x10⁶ c/ml. Another method is to place the :separation device, such a rotating spin filter (Himmelfarb, 1969) in the reactor. Some disadvantages of these devices include loss of cell viability and cell number as cells pass through pumps and clog filters.
Cell settling devices separate cells based on gravimetric settling of cells. These devices have the advantages of no moving parts or membranes that can clog. Various designs have been used to with hybridoma cultures to reach maximum densities up to 107 cells/mi. For example, Takazawa and Tokashiki, (1989) used an inner settling tube and Batt et. al., (1990) used an external, inclined rectangular channel. The external, single cone design (Sato et. al., 1983) has been used by many to reach densities of x107 cells/ml (Kitano et. al., 1991; Shintani et. al., 1991; Hilsher et. al., 1992). The settler design used in this work has two conical channels enclosed with an inverted cone and has been used to achieve densities of 2x10⁷ cells/ml (Buser, 1992; Tyo, 1991). The higher cell density may be a function of cell type, the number of channels or the angle of incline of the channels.
B. Problems in Achieving High Density Production
In theory, perfusion culture systems can maintain a culture indefinitely at high density. Nutrients such as amino acids, vitamins, and saccharides need to be continuously supplied to the bioreactor in amounts required for cell growth and in concentrations that can easily be taken up by the cells. Also, metabolic by-products need to be continuously removed and kept at concentrations low enough to prevent cell death. Oxygen must be supplied in amounts necessary for growth, and in a manner that does not cause cell death by foaming of the media or bubble bursting. The pH and redox can be held in a physiological range by buffering of the media and reducing lactic acid concentrations. Damage due to hydrodynamic forces is minimized by choice of stirring speed and bioreactor configuration.
For cell lines that secrete antibody best at slow growth rates, such as many mouse-mouse hybridomas, very slow growth and high density are desired for high production. High density perfusion culture of mouse hybridomas often increases production rates (e.g. Seaver et. al., 1987; Batt et. al., 1990) or does not change the antibody production rate (e.g. Hamamoto et. al., 1990; Tokashiki et. al., 1990; de la Broise et. al., 1992). For cell lines that produce best at high growth rates, such as some human hybridomas (e.g. Shintaini et. al., 1991; Kitano et. al., 1991) and transfectomas (Robinson and Memmert, 1991), good growth and high density are desired for high production.
Even with all of the parameters optimized to achieve fastest cell growth and highest cell density, the secretion of the product can decline over time. Some loss of production over time is inevitable. Researchers usually resort to periodically restarting a culture with a frozen vial of high producing stocks. Sometimes the loss of production is reversible, and production of the population is rescued by removing the cells from unproductive bioreactor conditions. Research presented previously (Buser, 1992) and in this thesis, demonstrated both the irreversible loss of production over time and the reversible loss of production due to reactor conditions.
1. Irreversible Loss of Antibody Production
In general, the rate of production of antibodies from a population of cells decreases irreversibly with time in culture (Scharff et. al., 1973). The rate of loss of production of myeloma and hybridoma cells has been reported in the range of 10-2 to 10- 5 per cell per generation (Scharff et. al., 1973, Galfr6 et. al., 1980; Gardner et. al., 1985). The mechanisms for an irreversible loss of production include:
* deletion of the entire gene
* small genetic alterations such as point mutations * a decrease in transcription (DNA to RNA) * a decrease in translation (RNA to protein) * a decrease in protein transport out of the cell
These effects are thoroughly documented in the biological literature (James and Bell, 1987).
The overall irreversible loss of production of a cell line has been attributed to the appearance of a non-producer cell population (Frame and Hu, 1990; Ozturk and Palsson, 1990). A mass balance model including the rate of loss of antibody production and difference in growth rates of the populations of producers and non-producers has been analyzed by Lee et. al. (1991). When the non-producers grow slower than the producers then a stable population balance occurs at any rate of loss. When the non-producing subpopulation grows at a slightly faster rate than the producing cells, then over time, the population of nonproducers takes over the culture and the average production rate
decreases. For example, at a rate of loss of production of about 10-3 per cell per generation, and a growth advantage of 10% for the non-producers, the culture is 50% non-producers in 100 generations.
The irreversible loss of production is a problem in the manufacturing of monoclonal antibodies. For example, Dean (1989) noted production of a murine hybridoma declined in a low density, continuous culture but was stabilized in a high density, immobilized culture of microsponges. Similarly, Lee and Palsson (1990) found immobilization in alginate beads to stabilize a culture. In continuous culture maximum growth rate can be obtained while in immobilized cultures very slow growth rates occur. The growth advantage of non-producers over producers is reduced at slower growth rates for
mouse-production has been shown to be faster in low serum and serum free conditions than in high serum for one mouse hybridoma (Ozturk and Palsson, 1990, Chuck and Palsson,
1992).
2. Reversible Loss of Antibody Production
A reversible loss of production is defined here as a situation where high density per-cell protein production declines and the loss is reversed by returning the cells to low cell
density.
The phenomenon of a reversible decline in antibody production is a common industrial problem, though it is rarely mentioned in the literature. Nevertheless, Kidwell (1989) has noted this in hollow fiber culture of two mouse hybridomas, COl 12 (IgG) and END (IgM). In continuous, suspension perfusion cultures, the mouse hybridoma AFP-27 (IgG) (Seamans and Hu, 1990) and the human hybridoma TFC-7 (IgM) (Kitano et. al., 1991; Shintani et. al., 1991) decreased production as cell density increased.
One cause for the decrease in the production can be nutrient limitation. Nutrients supplied to a culture include glucose, amino acids, vitamins, inorganic ions, and growth factors. In batch culture, rapidly consumed amino acid compounds, such as glutamine or isoleucine, are completely consumed. Research by Jo et. al. (1990) assumes that nutrient limitation is more important than waste product limitation and they have designed various nutrient-fortified media for high density culture of hybridoma cells. To maintain a continuous culture, we have used the strategy of perfusion culture to supply nutrients at a rate needed for cell growth.
Another cause can be an increase in concentration of diffusible inhibitors. The metabolism of glucose and glutamine lead to an accumulation of lactate and ammonia. Lactate and ammonia are inhibitors of growth and antibody production of hybridoma cells (Glacken et. al., 1988, Reuveny et. al., 1986.) The uptake of pyruvate and the metabolism of glucose to lactate alters the major redox pair, and the redox state of the culture (Imamura et. al., 1982). Cells may secrete factors to regulate product production. MIerten et. al. (1985) suggested that the antibody protein is a feedback inhibitor.
A third cause may be the physical interaction of cells at high cell density. Some cell lines that adhere to surfaces will stop growing when they cover the surface and are therefore called contact inhibited. Lieberman and Glaser (1981) reviewed the contact inhibition phenomena and the experiments that demonstrate that the plasma membranes of such cells inhibit growth. Cells that grow in suspension may also require interaction to signal high density and to slow growth. For example, Stallcup et. al. (1984a) demonstrated that cell membrane factors decrease the growth rate of lymphoid cells.
C. Reversible Decrease of Antibody Production in CLC Cells
Research in this lab has encountered the loss of antibody production in perfusion culture with a genetically engineered mammalian cell line, CLC, designed to produce a chimeric mouse/human antibody protein for colorectal cancer therapy (Sun et. al., 1987). We have shown that the phenomenon is reversible by subsequently lowering the cell density. Experiments have shown that the phenomenon is accompanied by a molecular shift characterized by a decline in the steady-state mRNA and a decrease in transcription and translation rates (Buser, 1992). Additionally, there is a metabolic shift characterized by a decline in some amino acid uptake rates (Tyo, 1991).
Experiments to investigate the molecular cascade (Buser, 1992) comparing high production to low production with a second set of bioreactors demonstrated that a 10 fold drop in productivity can be accounted for by the following:
* no instability of the antibody protein or proteases in cell free bioreactor medium, * no change in the copy number of heavy or light chain genes,
* the steady state heavy and light chain mRNA levels dropped three fold, * a decrease in the immunoglobulin translation rate estimated to be 2.4 fold, and * a general decrease in translation, as shown with ox-tubulin, by 1.4 fold.
Buser (1992) demonstrated that the cells removed from the bioreactor return to low density secretion rate within two days. Live cells from the bioreactor were inoculated into low density spinner cultures, and the extracellular antibody secretion rate was determined by ELISA and intracellular antibody content by FACS. The population analysis of intracellular antibody showed return to low density, high production in two days. Therefore the effect of a condition in the reactor (nutrient limitation, cell to cell contact, or diffusible inhibitors) can be reversed, or up-regulated, in a short time.
D.
Changes in Hybridoma Metabolism at High Density
Although most of the published research on perfusion culture of hybridomas has focused on reactor design, ability to reach and maintain a high cell density, and maintain antibody secretion, a few research groups have also looked at metabolism.
The metabolic pathways of hybridoma cells are summarized in Figure 1 (redrawn from Batt and Kompala, 1989; Gaertner and Dhurjati, 1993a). The major substrates for cell growth are glucose, glutamine and other amino acids. Glucose is metabolized via the pentose phosphate pathway to nucleotides or via glycolysis to pyruvate. Through pyruvate, glucose is converted to the acetyl-CoA, and through the TCA cycle into lipids, amino acids, or energy. Most of the glucose is excreted as lactate. The glycolysis efficiency, defined as twice the percentage rates of lactate secretion to glucose uptake, can approach 100% for cells in culture. Glutamine enters the TCA cycle via an analogous pathway of glycolysis, called glutaminolysis (McKeehan, 1982). Glutamine is a carbon and nitrogen source for amino acids for proteins, nucleic acids, and lipids. Glutamine supplies more energy than glucose, as was determined by Reitzer et. al. (1979) with HeLa cells. Since animal cells in culture cannot synthesize amino acids, and amino acids must be transported into the cell from the cell culture media (Eagle, 1955). Hybridomas secrete antibody protein, as well as ammonia, lactate and alanine. Ammonia and lactate are inhibitors of growth and antibody production (Reuveny et. al., 1986; Glacken et. al., 1988).
Research by Tyo (1991) focused on the analysis of the metabolic changes occurring as the cell density increased and the antibody production declined. A metabolic shift in glycolysis efficiency and amino acid uptake occurred. At low density the glycolysis efficiency was 65 %, and for the other reactor conditions the efficiency was nearly 100%. The uptake rate of pyruvate also declined from 2.5 to 1.5 fmole/cell-hour. A metabolic shift in the amino acid uptake paralleled the decline in cell density. The total uptake of the amino acids (produced plus consumed rates) declined 5 fold from about 250 to 50 fmole/cell-hour. The uptake rate or production rate of each amino acid declined. For example, the uptake rate of glutamine and the secretion rate of alanine decreased coordinately 3 fold (from 60 to 20 fmole/cell-h).
Figure 1: Metabolic Pathways
Amino
Acids Glucose
I.
All these changes at high density suggest fewer precursors available for cellular protein, lipid and nucleotide synthesis as well as secreted antibody. At high density the amino acid supply is nearly equal to the requirements for proteins and nucleotides, while at low density amino acids are taken up in excess of these requirements (Tyo, 1991).
A few studies with hybridoma cell lines in perfusion have looked at density effects on specific uptake rates of glucose and glutamine. A similar case of antibody production declining with increasing cell density were observed by Seamans and Hu (1990) in the perfusion culture of the AFP-27 hybridoma. They found that glycolysis was constant. In contrast, Shirai et. al. (1991) perfused a mouse-mouse hybridoma 4C10B6 with a .45 micron membrane filter at the bottom of the reactor, and observed a 2 fold drop in glucose consumption and lactate production and a 3 fold drop in glutamine consumption. They did not report antibody concentration or production data. Hiilscher et. al. (1992) used the combination of airlift for suspension and a single cone for separation of the mouse-mouse hybridoma XR6-G10-B3, and found specific antibody production constant but about a four fold drop in uptake rates of glucose and glutamine and production of lactate.
There have been no studies on the density effects on specific uptake rates of amino acids. However, comparison of amino acid uptake rates at different growth rates have been made by Hiller et. al. (1991, 1993) for the mouse hybridoma X-D. They fixed growth rate by controlling dilution rate in continuous culture and in perfusion culture. Comparison of the specific amino acid uptake rates of fast growth versus low growth rates also shows similar trends as observed from low density to high density. A comparison of bioreactor conditions was made by Biintenmeyer et. al. (1991). They found that the uptake rates of the hybridoma VIN2 was faster in chemostat culture than in batch, presumably because the growth rate was faster. They also observed that the total uptake rates of the GL3 hybridoma were lower at a steady state in a perfusion culture (with cell harvest) than in batch. They did not investigate the transient behavior in perfusion culture. Common to all of these studies, the growth rate declined as the cell density increased.
E. Goals of Research
This research aimed at two questions posed by the reversible phenomena. First, "What is the cause of the decrease in antibody production at high cell density?". Second, "What do cells do with the high rate of amino acids taken-up at low density?"
This thesis sets forth three theories regarding the cause of the observed down regulation of protein production and then addresses each theory:
* nutrient limitation
* cell-to-cell contact inhibition * diffusible inhibitor
In summary, I have found as a result of this work that the cause is a combination of diffusible inhibitors. Lactate and ammonia can account for about two-thirds of the observed inhibition. A third diffusible inhibitor of a small molecular weight (less than 10 kDa) exists, though its identity is unknown.
The inhibition of the antibody protein production is coincident with the decrease in amino acid uptake. Tyo (1991) concluded that cells are taking up amino acids at low density at a rate exceeding requirements for protein and nucleotides. This thesis investigates the utilization of amino acids at different densities. I present evidence that this low-density "excess" is used primarily for lipid synthesis.
II. Experimental Techniques
A. Cell Culture
Cell Line
The cell line chosen for this research was a Sp2/0 transfectoma called C46 which produces a chimeric (mouse/human) antibody of the class IgGiK (Shaw et. al., 1988b). A high producing sub-clone designated CLC LT 14 (Tsuruda, 1990) was selected. Experiments were performed with the sub-clone, and these cells will be referred to as CLC cells. The specific antibody production rate in batch culture is about .2 pg/cell-h and the final antibody concentrations reaches 10-15 gg/ml.
The antibody protein was cloned from a combination of mouse and human genomic genes. The antibody binding portion, the variable region, was cloned from mouse (murine) sequences from a mouse hybridoma (Herlyn et. al., 1979). The murine variable region binds to a cell surface antigen of colon carcinoma cells (Sun et. al. 1987). The murine antibody was tested in phase I and II clinical trials with some success for reducing tumors, but the foreign antibody elicited an immune response (Sears et. al., 1982; Sears et. al. 1985). The constant region portions were cloned from human sequences, with the class one IgG chosen for its cytotoxic characteristics (Shaw et. al., 1988a). The non-secreting hybridoma Sp2/0 was transfected with two genes, one for the chimeric heavy chain and one for the chimeric light chain. The chimeric antibody did not cause an allergic reaction in patients and circulated in the body longer than the mouse counterpart (LoBuglio et. al., 1989). Other cell lines secreting chimeric antibodies towards tumor associated antigens, such as the human common acute lymphocytic leukemia antigen, have been constructed by the same genetic engineering methods (Morrison and Oi, 1989).
Stock Culture
Cells were grown in Dulbecco's Modified Eagle's Medium (Gibco, Grand Island, New York or JRH Biosciences, Lenexa, KS) supplemented to final concentrations of 2 mM pyruvate, 6 mM glutamine, 50 jiM 3-mercaptoethanol (called DMEM*) and 4% heat treated, fetal bovine serum (FBS) (Hyclone, Logan, UT). Stock cultures were maintained in exponential growth in 75 cm2 T-flask culture by passaging every 2-3 days. Cultures were grown at 37 OC in a humidified incubator with CO2 maintained at 8%. Cell culture
Bioreactor Design
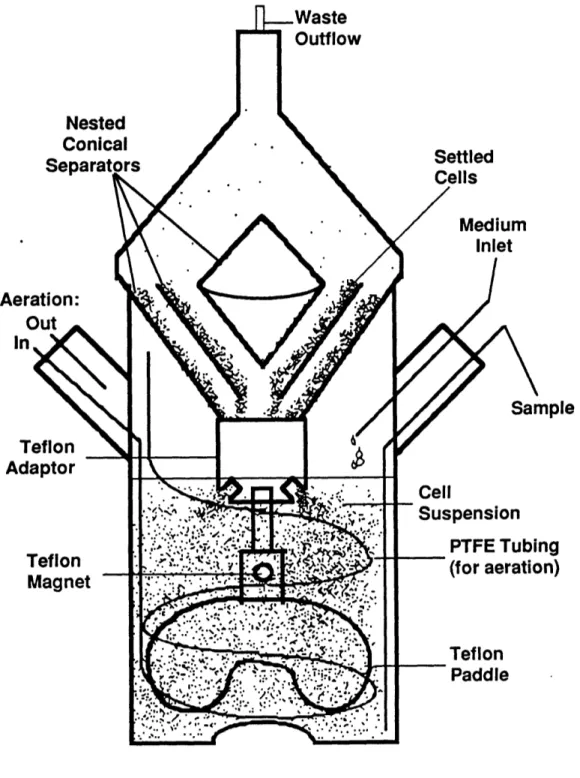
A perfusion system was designed in order to study the effects of high cell density. The bioreactor design is shown in Figure 2. A 250 ml microcarrier flask with two side arms was modified. Fresh media was pumped continuously at one port, and spent media with some cells are removed through the top of a novel conical cell separator (Tyo, 1991). The culture was stirred with a magnetic blade suspended from the cell separator. Humidified air or an enriched oxygen mixture was passed through a .22 micron filter, and diffuses through a coil of porous polytetrafluoroethylene (PTFE) tubing (W.L. Gore & Associates, Elkton, MD).
The conical separator operates by inclined sedimentation in an upward flow of cells and media. The device uses no moving parts, such as pumps, which can damage cells. The separator consists of three nested glass cones enclosed by one inverted cone. The separation ratio, the concentration of cell leaving compared to the concentration of cells in the reactor, is a function of the flow rate. In the extreme case, at a flow rate of one reactor volume per hour the separator would allow all the cells to leave. In reactor conditions studied here, the flow rates were of 1 to 6 reactor volumes per day, and the cell separator retained about 95% of the cells. Maximum cell densities of 2 x10⁷ cells/ml were achieved in this 250 ml bioreactor, with perfusion rates of 3 reactor volumes per day.
Figure 2: Schematic of Perfusion Bioreactor
Ael Ir
Ac
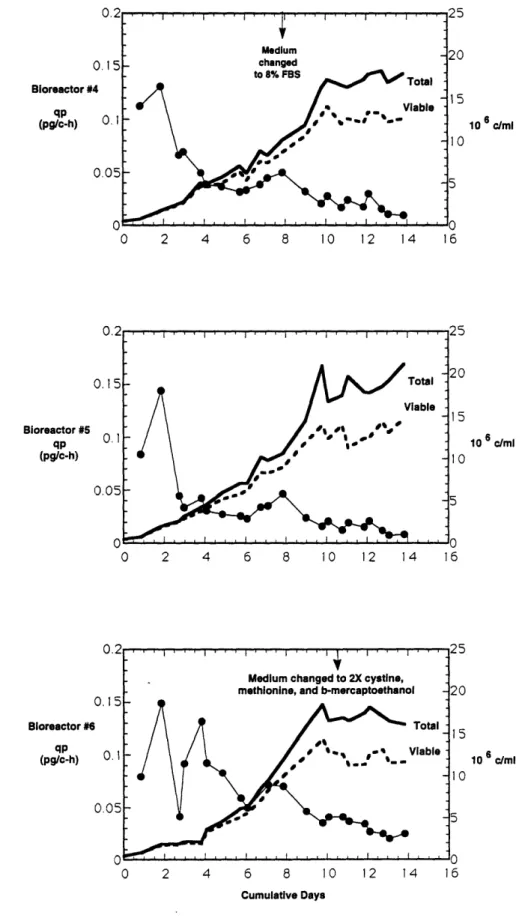
High Density Experiments
Two sets of triplicate bioreactor experiments were inoculated with about 5 x 10⁵ cells/mi. Perfusion of medium was increased from 1 to 3 volumes per day for the first 3 to 5 days.
In the first set, flow rates were increased to 6 and 9 volumes per day. Maximum total cell densities of 1-2 x10⁷ cells/ml were achieved in this 250 ml bioreactor, with perfusion rates of 3 reactor volumes per day.
Through the sampling port, sterile samples were withdrawn at least once daily. Cell density was determination with a Coulter Counter Model ZF (Coulter, Hialeah, FL) and percent viability was measured by trypan blue exclusion. Cells removed from the bioreactor were sometimes used immediately for flow cytometric analysis for antibody content or for cell cycle. Some cells were frozen as live cells for later experiments in a solution of 10% dimethylsulfoxide, 20% FBS and 70% DMEM*. Cells were removed by centrifugation at 500g, and the supernatant was frozen at -200C for subsequent metabolic studies and for measurement of excreted antibody concentration.
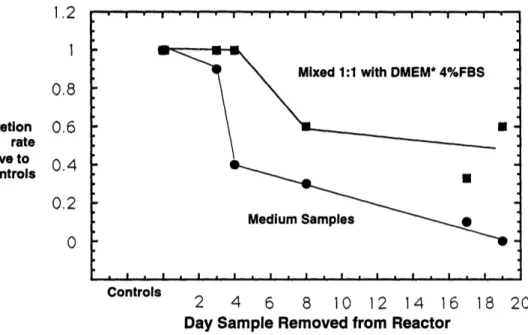
Low Density Experiments
Growth and antibody production was tested in the high density, low productivity (HDLP) media removed from the bioreactor. Experiments were performed at "low density" with cells that had been carried as stock cultures. Cells were inoculated at 2 - 5 x 10⁴ cells/ml in 24 wells plates, T-flasks or spinner cultures and permitted to grow to final density of less than 2 million cells/mi. Total or viable cell density was measured after three days. The specific antibody production rate was measured as the change in amount of antibody per cell per time interval. Amount of antibody was measured as either 1) extracellular antibody secreted into the media by ELISA or 2) intracellular antibody content by flow cytometry. Details of methods follow in analytical methods.
B.
Analytical Techniques
1. Antibody Measurements
Antibody Concentrations by ELISA
Extracellular antibody concentrations were measured with a sandwich type ELISA. Flat bottomed, 96 well microtitration plates (cat. 86-381-04) were obtained from Flow Laboratories (McClean, VA). Plates were coated with 100 l/well goat anti-human F(ab')2 fragment (Jackson Immunoresearch, West Grove, PA, cat. #109-005-097) diluted
to 10 mg/ml in .05 M sodium carbonate buffer, pH 9.8. After a two hour incubation the plates were washed with wash buffer consisting of phosphate buffered saline (PBS) with .05% Tween 20. PBS prepared with 0.2 g/l KC1, 0.2 g/l KH2PO4, 8 g/l NaCl and 1.15 g/l Na2HPO4, pH 7.1. The plates were blocked with 200 gl/well with a solution of 3% bovine serum albumin (BSA) and 1% normal goat serum in PBS. After a one hour incubation plates were rewashed. Plates were stored at 40C until samples were assayed. Samples were diluted in two fold serial dilution in complete media at room temperature. The plates were incubated for two hours and then rewashed. The second antibody was an alkaline phosphatase conjugated goat antihuman IgG (Tago, Inc. Burlington, CA, cat. #2490). The second antibody was diluted about 1:5000 in a solution of 1% BSA in PBS and added at 100 il/well. After a two hour incubation, the plates were rewashed. The substrate (Sigma, St. Louis MO, cat. #104-105) was diluted at 1 mg/ml in the following buffer: 24.5 mg MC12 in 400ml plus 48 ml diethanolamine, pH 9.8. The substrate was plated at 100 gl/well. The reaction was stopped after 30 minutes with 100 ,gl/well of 2 N NaOH. The conversion of the substrate was measured at 450 nm. Controls of human IgG (Jackson Immunoresearch, West Grove, PA, cat. #009-000-003) were run with each plate.
Intracellular Antibody Distributions by Flow Cytometry
Intracellular antibody content was determined by staining permeabilized cells with a fluorescent tagged antibody. Live cell samples of 2-4x 10⁶ cells were washed three times with PBS to remove extracellular antibody. All centrifugation steps were done at 500g, 40C for 5 minutes. The washed cells were permeabilized with 70% ethanol in PBS on ice for 30 minutes. After the incubation the cells were rewashed with PBS to remove ethanol. The permeabilized cells were stained with a fluorescein isothiocynate (FITC)
temperature incubation, the cells were washed again and placed on ice. The cells were analyzed by flow cytometry with a Coulter EPICS@ C System (Coulter, Hialeah, FL). The fluorescein tag was excited at 488 nm and emission monitored at 530 nm. The negative controls were the non-secreting parental cell line, Sp2/0.
Conversion of the log mean fluorescent value reported by the EPICS@ C System to linear means was accomplished by the method of Schmid et. al. (1988). Since the EPICS@ C System collects data in 256 channels, a theoretical base number is calculated as below:
theoretical base = 1000 (1/256) = 1.02735
The linear mean of a sample then equals:
linear mean = 1.02735 (channel # of log mean).
A cut off for the percent positive staining cells are set so that 1% of the positive controls are "negative staining". Antibody content equals the linear mean of the positive staining cell population multiplied by the percent of positive staining cells. Relative antibody content is normalized to the low density, fresh media control.
Intracellular Antibody Concentrations
Cellular antibody content was also determined by lysing cells by the procedure of Meilhoc et. al. (1989) and measuring antibody content by the ELISA procedure. Cells are lysed in a low osmotic buffer (5 mM KH2PO4) and stabilized with an equal volume of high osmotic buffer (15 mM KH2PO4 with 270 mM NaCl). For the protein extraction, added to the .4 ml of lysed cells were 50 gl 1% Triton X-100 and 12 pl of 2 M CHAPS. The soluble proteins were separated by centrifugation at 13,600 g for 5 min. As done by Meilhoc et. al. (1989), the completeness of the extraction procedure was tested by assaying for antibody concentrations in higher concentrations of detergents and in
second extraction steps.
2. Cell Cycle Analysis
Cell cycle was determined by measuring DNA content of permeabilized cells stained with a nucleotide binding dye. Cells were removed from the bioreactor, washed twice with PBS, and permeabilized with 70% ethanol for 30 minutes. The permeabilized cells were washed again with PBS and stained for DNA with 20 .tg/ml propidium iodide (Sigma, St. Louis, MO, cat. #P-4170) and 40 gg/ml RNAse (Sigma, St. Louis, MO, cat. #R-5503)
(Crissman and Steinkamp, 1982). After a 30 minute incubation period the samples were analyzed by flow cytometry with a Coulter FACStar System (Coulter, Hialeah, FL). The excitation wave length was 488 nm and the emission wave length was 590 nm. The bimodal DNA profile was fit to three populations by the program Modfit M.
3. Extracellular Metabolic Concentrations
Metabolic Concentrations by Enzymatic Assays
Extracellular concentrations of glucose, lactate, pyruvate and ammonia were determined with diagnostic kits numbered 16-UV, 828-UV, 726-UV and 170-UV, respectively (Sigma, St. Louis MO).
Amino Acid Analysis
Amino acid concentrations of bioreactor samples were determined by Tyo (1991). A brief description follows. Extracellular amino acid analysis was analyzed by HPLC. Bioreactor samples were deproteinized with 1000 MW cutoff ultrafiltration membranes (Amicon Centrifree, Beverly, MA). The amino acids were derivatized with DABS-Cl method (Change et. al., 1983) and ornithine was used as the internal standard. The samples were injected into a reverse phase column, Beckman Ultrasphere ODS at room temperature. The amino acids were eluted with an increasing gradient of acetonitrile vs. citrate buffer at pH 6.5. Peaks were detected with a Hewlett-Packard Model 1090 diode array detector.
4. Cellular Membrane Preparation
Crude membranes of either the transfectoma CLC or the parental Sp2/0 cells were isolated by differential centrifugation based on published procedures (Stallcup et. al., 1984a; Lemonnier et. al., 1978). All centrifugation steps and handling procedures were done at 0-40C. Cells were harvested from "low" density batch spinners (1-2 x10⁶ c/ml)
by 15 minute centrifugations at 500g, pooled, washed with PBS and resuspended at -108 cells/ml in Earle's Balanced Salt Solution (Gibco, Grand Island, New York). Cells were homogenized by sonication. The whole cell homogenate was centrifuged 15 minutes at 3600g and the resulting low speed pellet contained nuclei, mitochondria, etc. The low
Purification characteristics of two batches are summarized in the table below. Total membrane activity was determined with freshly prepared samples by the marker 5'nucleotidase (5'-ND Sigma kit 265 UV). Total protein content was measured by a modified Lowry method (Sigma kit P 5656). Specific 5'ND activity is expressed per mg protein. Yield is percent of total 5'-nucleotidase activity of the homogenate. Fold purification is the ratio of the specific activity of a fraction to the specific activity homogenate.
Table 2: Purification of Crude Membranes
Sample Total Specific 5'ND Yield Fold
Protein Activity Total Activity 5'ND Purification (mg) (mmol/mg-min) (mmol/min) (Percent)
Prepared from 2.3 x 10⁹ CLC cells
Homogenate 186 7.2 1341 100 1.0
Low Speed Pellet 64 3.0 196 15 0.4
Low Speed Supematant 118. 7.7 910 68 1.1
High Speed Supernatant 120 4.9 585 44 0.7
High Speed Pellet 27 11.0 296 22 1.5
Prepared from 2.3 x 10⁹ Sp2/0 cells
Homogenate 174 5.1 879 100 1.0
Low Speed Pellet 71 2.5 175 20 0.5
Low Speed Supernatant 114 6.7 762 87 1.3
High Speed Supernatant 105 3.8 400 45 0.8
High Speed Pellet 19 12.6 236 27 2.5
5. Fractionation of Inhibitors
High molecular weight components of the media from the bioreactor outlet were separated with a size exclusion column. The gel filtration media used was sephacryl S-300 (Pharmacia, Piscataway, NJ). This hydrophobic gel is of 25-75 gm particles of cross linked alkyl dextran and N,N'-methylene bisacrylamide. The S-300 gel filtration material separates globular proteins of lx104 to 1.5 x10⁶ MW. The gel was packed into a column of 2.5 x 50 cm with PBS at 4 ml/minute. The 10 ml bioreactor samples of high density, low productivity (HDLP) media were loaded on the 200 ml bed and eluted with DMEM*
'(with glutamine, pyruvate and [3-mercaptoethanol and no serum) at 2.5 ml/minute. Fractions of 10 ml were collected and sterile filtered (.2 g Millex, Millipore, Bedford, MA). Fractions were assayed for protein by adsorbance at OD 280, and concentrations of lactate, pyruvate, ammonia and antibody with enzymatic kits (Sigma, St. Louis, MO).
6. Leucine Uptake
Incorporation of leucine into protein and lipid was measured in 5 ml cultures after two or four hours at various densities. Cells were passaged at low density in fresh or high density, low productivity (HDLP) media for four days before the experiment, and then suspended in fresh or HDLP media. Cultures at densities ranging from 2x10⁴ to 3x10⁶ cells/ml were placed into 15 ml centrifuge tubes and mixed in a roller rack. Radioactive leucine (3H- 3,4,5-leucine NET-460 or 14C [U]-leucine NEC-279E, New England Nuclear) was added and time zero samples were removed to later check for the amount of hot leucine added. After the labeling period, cells were centrifuged and the supernatants were set aside. For the 3H-leucine experiments, parallel cells samples were washed with DMEM* media without serum. One sample was precipitated with 10% TCA for total protein and lipid and the other sample was extracted with chloroform: methanol for total lipid (Folch et. al., 1957). For the 14C-leucine experiments, samples were prepared in sequential steps. First cells were washed with DMEM*, and then protein and lipid were precipitated with cold 30% TCA. The lipid was separated from the protein precipitate in a series of extraction steps. The precipitate washed twice with ethanol, twice with acetone, twice ethanol-ether, (3:1, v/v) and once with ether (Bhargava et. al., 1959). The final protein precipitate was dissolved in 0.6 N NaOH and samples were scintillation counted. The lipid containing solvents were pooled into scintillation vials, dried, and scintillation fluid was added for counting.
The concentrations in the free amino acid pool were determined by HPLC analysis of the TCA soluble extracts (MIT Biopolymers Lab). This method gives information for all amino acids except cystine and tryptophan. The hydrolysis and derivatization procedures results in one combined value each for a) glutamate and glutamine, and b) asparagine and aspartate. The combined values for asparagine and aspartate were below the level of
'7. Lipid and Protein per Cell
Lipid Content
For total lipid measurement, samples were extracted by the Folch method (Folch et. al., 1957). Frozen cell samples of - 5x10⁷ cells were washed with PBS to remove serum lipids and resuspended in 1 ml distilled water. To the 1 ml cell sample, 12.5 ml chloroform: methanol (2:1) was added. This mixture was sonicated and then set aside overnight. The lipid extracts were filtered through general purpose filter paper (Scheicher and Schull #595) using chloroform to rinse paper. The filtered extracts were backwashed with 4 ml 0.05% calcium chloride. The phases were separated by one 15 minutes centrifugation at 400g. The bottom organic phase was removed, dried (by speed vacuum and drying oven) and weighed to determine picograms lipid per cell.
Protein Content
Portions of the cell samples for lipid determination were set aside for protein measurement. These samples were assayed for protein content with a modified Lowry method (Sigma Assay Kit, P 5656). This procedure uses deoxycholate to solubilize proteins.
C.
Kinetic Equations
In this section, the kinetic equations for growth, product production and substrate consumption will be presented for batch, continuous, and perfusion culture. These equations are used to calculate rates of growth, death, antibody production and substrate consumption. Input values from experimental data including cell density, viability, dilution rate, and concentrations of antibody and nutrients.
:1. Growth and Death
The production of cells is a function of the growth and death rates of the cells and a function of the method of cell culture. In batch culture, the rate of change in time t of the viable cell concentration XV (viable cells/ml) equals the rate of growth minus the rate of death of cells:
-dt = IJXv - a Xv (1)
dt where:
g = specific growth rate constant (h-1)
a = specific death rate constant (h-1 )
In chemostat culture, the flow rate of fresh medium into the reactor equals the flow rate of spent medium and cells out of the reactor. The dilution rate is defined as:
D = dilution rate '-1) = Flo (mh) Reactor Volume (ml)
Therefore, the equation for the rate of change in viable cell concentration contains three terms, one each for the growth, death and removal of cells by dilution.
dXv= Xv - a Xv - DXv (2)
dt
In continuous perfusion culture, the flow rate into the reactor equals the flow rate out of the reactor, but most or all of the cells are retained in the bioreactor. With the conical cell separator (Tyo and Thilly, 1989), some of the cells exit the bioreactor. Since the cell separator is a settling device, the distribution of cells exiting the bioreactor contains a
eV = separation ratio for viable cells = XV,out/XV,in ED = separation ratio for dead cells = XD,out/XD,in
The separation ratio of viable cells eV is not equal to the separation ratio of dead cells ED in this reactor.
'The rate of change of the viable cell concentration (Xv) equals the accumulation of cells due to cell growth minus the removal of cells by death and washout. Similarly, the rate of change of the dead cell concentration XD (cells/ml) equals the accumulation of dead cells minus the removal of dead cells. The differential equations describing the rate of change of XV and XD in the perfusion bioreactors are shown below:
dXv = Xv - cxXv - (Ev Xv D) (3)
dt
dXD = XV - (ED XD D) (4)
dt
where D (h-1) is the term for the dilution or the perfusion rate. Solving the differential
equation for the viable cell concentration XV:
Xv = Xvo e(gapp -evD)At (5)
where the apparent growth rate is defined as the actual growth rate minus the death rate:
app = t - 0a (6)
Rearranging, the solution for the apparent growth rate is:
gapp = 1 InXv] + D (7)
At
Substituting the solution for XV into the differential equation of the dead cell concentration XD the solution for the death rate a is:
B( XD -XDOe-DDt)
= (8)
XVo e-DDt (eBt 1 ) where the term B is:
B = .]app + D(ED - EV). (9)
The actual growth rate is calculated from the sum of the apparent growth rate gapp and the death rate a. These equations reduce to the equations for chemostat culture when eV and ED are both set equal 1.
2. Antibody Production
The production of antibody is modeled as a function of the viable cell density. In batch culture, assuming there is no degradation of antibody, the equation describing the rate of
change in antibody concentration is:
dAb = qp XV dt (10)
The specific rate of production qp (pg/cell-h) is assumed to be constant during the time interval measured. Solving for the specific production rate:
= Abt -Abo ] IXvt
.pXvt
XVo]
[V/
(lv)
During exponential growth, the viability is high (XV = 95% X) and the specific production rate qp may be calculated from the total cell density X.
With this bioreactor design the secreted antibody protein is homogeneously mixed in the reactor and the concentration inside the reactor equals the concentration exiting the reactor. The equations describing antibody production are the same for continuous chemostat and continuous perfusion culture. The differential equation for antibody concentration Ab (g/ml) is a function of the production by viable cells and the removal
by dilution.
dAb = qp Xv - DAb (12)
Solving for the specific rate of production qp (pg/cell - hr) gives:
qp XVt - Xvo [XVo]P In[ jXv (13)
where the volumetric antibody production rate Qp is:
Qp = D[Ab - AboeDt] (14)