Publisher’s version / Version de l'éditeur:
Vous avez des questions? Nous pouvons vous aider. Pour communiquer directement avec un auteur, consultez la première page de la revue dans laquelle son article a été publié afin de trouver ses coordonnées. Si vous n’arrivez pas à les repérer, communiquez avec nous à PublicationsArchive-ArchivesPublications@nrc-cnrc.gc.ca.
Questions? Contact the NRC Publications Archive team at
PublicationsArchive-ArchivesPublications@nrc-cnrc.gc.ca. If you wish to email the authors directly, please see the first page of the publication for their contact information.
https://publications-cnrc.canada.ca/fra/droits
L’accès à ce site Web et l’utilisation de son contenu sont assujettis aux conditions présentées dans le site LISEZ CES CONDITIONS ATTENTIVEMENT AVANT D’UTILISER CE SITE WEB.
7th International Symposium on Utilization of High-Strength/High-Performance
Concrete [Proceedings], pp. 135-154, 2005-06-01
READ THESE TERMS AND CONDITIONS CAREFULLY BEFORE USING THIS WEBSITE. https://nrc-publications.canada.ca/eng/copyright
NRC Publications Archive Record / Notice des Archives des publications du CNRC : https://nrc-publications.canada.ca/eng/view/object/?id=6e585645-9f7c-4b62-9c51-485c72ca0148 https://publications-cnrc.canada.ca/fra/voir/objet/?id=6e585645-9f7c-4b62-9c51-485c72ca0148
NRC Publications Archive
Archives des publications du CNRC
This publication could be one of several versions: author’s original, accepted manuscript or the publisher’s version. / La version de cette publication peut être l’une des suivantes : la version prépublication de l’auteur, la version acceptée du manuscrit ou la version de l’éditeur.
Access and use of this website and the material on it are subject to the Terms and Conditions set forth at
The Maturity approach for predicting different properties of
high-performance concrete
The Maturity approach for predicting different
properties of high-performance concrete
Zhang, J.; Cusson, D.; Mitchell, L.; Hoogeveen, T.;
Margeson, J.
NRCC-46293
A version of this document is published in / Une version de ce document se trouve dans :
7
thInternational Symposium on the Utilization of High-Strength/High-Performance
Concrete, Washington, D.C., June 20-24, 2005, pp. 135-154
The Maturity Approach for Predicting Different
Properties of High-Performance Concrete
Jieying Zhang, Daniel Cusson, Lyndon Mitchell,
Ted Hoogeveen, and Jim Margeson
Synopsis: The prediction of concrete properties using computer modeling is becoming widely used, and many models utilize the concept of maturity. The original maturity concept was developed empirically from the study of the temperature effect on the compressive strength of normal-strength concrete. The use of the maturity concept for estimating the development of properties other than compressive strength has not yet been sufficiently validated with experimental data, especially for high-performance concrete.
This paper presents a study of the maturity method for predicting the development of key properties of high-performance concrete, such as compressive strength, splitting tensile strength, modulus of elasticity, and level of cement hydration. The derivation of the maturity method is explained and experimental evidence, collected under different temperature conditions, is presented and discussed. The results were used to study the activation energy, which is a governing parameter of the Arrhenius maturity formulation, for predicting the key properties of high-performance concrete. Recognizing the need for a more accurate determination of the activation energy for each concrete property, a new practical approach for calculating the Arrhenius maturity index is proposed.
Keywords: activation energy; compressive strength; high-performance concrete; level of hydration; maturity; modulus of elasticity; temperature function; tensile strength
ACI member Dr. Jieying Zhang is a Research Associate at the National Research Council Canada (NRC), Ottawa, Ontario, K1A 0R6. She received her Ph.D. at the University of California at Berkeley. Her research interests include construction materials, non-destructive methods and modeling, and corrosion of reinforcement in concrete structures.
ACI member Dr. Daniel Cusson is a Research Officer at the NRC. He is a member of the ACI 363 Committee on High-Strength Concrete. His research interests include early-age structural behaviour of high-performance concrete, and long-term field performance and durability of rehabilitated concrete bridges.
Dr. Lyndon Mitchell is a Research Officer at the NRC with interests in cement chemistry and concrete science. He is a member of the Canadian Action Plan 2000 Committee on climate change issues. These interests are coupled with responsibilities for maintaining the X-Ray and microscopy laboratories.
Mr. Ted Hoogeveen is a Technical Officer at the NRC. His expertise includes structural testing of reinforced concrete and remote monitoring of concrete structures.
Mr. Jim Margeson is a Technical Officer at the NRC, specializing in material science and material characterization, with an emphasis on microanalysis and microstructural evaluation.
INTRODUCTION
High-performance concrete (HPC) is increasingly used in the construction of buildings, bridges and parking garages. This is due to its improved engineering properties, such as strength, stiffness and durability. However, a major concern with HPC is self-desiccation and the consequent autogeneous shrinkage at early-ages, because concrete may crack if the shrinkage is restrained. To promote the use of HPC in structures, more research is required to understand, improve and predict the early age behavior of HPC. Early age properties of concrete are significantly influenced by the curing temperature and moisture conditions. Consequently, the maturity concept seems to be an ideal method for
predicting the development of different properties of HPC with time. Due to its simplicity and the apparent relationship with cement hydration, the maturity method has been used to predict the compressive strength of normal-strength concrete for decades (Malhotra 1974 a & b). The feasibility of the maturity method for predicting a host of concrete properties, other than compressive strength, has been subject to debate, initiated by a lack of scientific consensus on the relationship between maturity, hydration kinetics,
microstructure, and property development.
An examination of the maturity method will provide an insight into how it was formulated, its physical meaning, what assumptions were made, and therefore more fundamental understanding of its capabilities and limitations. The underlying physical
chemistry behind the parameters used in the maturity method (e.g. rate constant and activation energy) needs to be understood further before the maturity concept can be more widely accepted. This will guide modelers and field engineers in the correct use of the maturity concept, increasing the accuracy of the predictions. Experimental validation of the maturity method is also necessary to increase understanding, and hence its predictive power. For example, Carino and Tank (1992) reported that different water-cement ratios (w/c) and formulations of water-cementitious materials could fundamentally change the rate constant (or temperature function), based on their experimental study of normal-strength concrete with w/c ratios of 0.45 and 0.6. There is no systematic study, however, on how the temperature function varies with the mix design and how it varies with each property of a same mix design. Compared with normal concrete, the cement hydration of HPC probably has different temperature sensitivities. For instance, if there is less water to transmit/radiate the heat to the environment, the concrete may become warmer, and more heat may affect the hydration kinetics, and hence the maturity. This study consisted of both a theoretical and experimental examination of the maturity method. The theoretical study identified the temperature function as the key variable. An experimental study of HPC properties such as compressive strength, tensile strength, elastic modulus, and cement hydration, was undertaken to provide additional experimental evidence from concrete samples cured at different temperatures under sealed conditions (no moisture exchange with ambient environment). This paper presents the first series of results of an investigation aimed at answering the following specific questions:
1) Is the temperature function (or activation energy) the same for all properties of HPC? 2) Is there a generic approach to using the maturity method for all concrete properties?
REVIEW OF FORMULATIONS OF THE MATURITY METHOD
The maturity method is a technique that was developed by using the temperature history of concrete to formulate an index that predicts the development of its compressive strength. The variables for the maturity calculation are the rate constant and activation energy. These two terms are most commonly associated with physical chemistry. A brief description of their original derivation is useful in order to discuss their application in concrete.
Temperature Function and Activation Energy
In physical chemistry, the rate law deals with chemical reaction kinetics (rate), which is observed as being proportional to the reactant concentration [A], raised to some power β (Atkins 1986), for instance:
[1]
[
]
k
(
T
)
[
A
]
f
(
T
)
g
([
A
])
dt
A
d
×
=
×
=
−
βwhere k is the rate constant at temperature T, represented by a general function of temperature f(T), and g([A]) is a general function of the reactant concentration for the
term [A]β . Many chemical reactions are observed to have a rate constant that increases exponentially with temperature, following the Arrhenius law (Atkins 1986):
[2a]
k
(
T
)
=
a
×
exp
−Ea/RT [2b]ln(
k
)
=
ln(
a
)
−
E
a/
RT
where a is a constant, Ea is the activation energy, and R is the universal gas constant
(8.314 J K-1 mol-1). A plot of ln(k) versus 1/T, known as the Arrhenius plot, will result in a straight line with a slope of -Ea/R and an intercept of ln(a). It shows that the activation
energy is a parameter that controls the temperature dependence of the rate constant; an increase in Ea will decrease the reaction rate exponentially.
The rate constant is not a reaction rate, however, at a given degree of reaction, it is proportional to the reaction rate (Eq. 1). Therefore, the Arrhenius plot of the reaction rate (at a given degree of reaction [A]) also yields the same slope of -Ea/R because:
[3] ln(kT1×
[ ]
A )−ln(kT2×[ ]
A )=ln(kT1)−ln(kT2)β β
The reaction rate and the rate constant are often confused. To avoid such confusion, the rate constant is referred to as the temperature function in this paper.
It is important to note that not all chemical reactions follow the Arrhenius equation (Eq. 2). For concrete materials, the chemical reactions during cement hydration are complex, as is the development of concrete properties. The temperature functions for cement hydration and specific properties of concrete are not well understood, and a true
Arrhenius behavior is only expected from single-phase reactions. Cement consists of four main chemical phases, each reacting with water at different rates. Each of these four phases has different activation energies and hydrate over different time scales. Consequently, when measuring the activation energy of cement, one is measuring a compound value. There are two approaches to deal with non-Arrhenius reactions: 1) For non-Arrhenius chemical reactions, an apparent Ea can still be defined in the same
manner as Arrhenius-like reactions, which allows one to compare the temperature sensitivities. The obtained Ea would vary with temperature as follows:
[4]
R
T
T
T
k
T
k
E
a)
/
1
/
1
(
)
(
ln(
)
(
ln(
1 2 2 1 T T1 2−
−
=
→2) In many cases, the temperature function may also vary with the degree of reaction [A]. An apparent Ea can be still calculated from reaction rates at given degrees of reaction.
This approach was used by Kjellsen and Detwiler (1992) and Kada-Benameur et al. (2000): [5]
[ ]
(
) (
)
] [ 1 2 2 ] [ 1 ] [ ) / 1 / 1 ( ) ( ln ) ( ln ) ( A A A a R T T T Rate T Rate A E − − =Formulation of the Maturity Method
Early development – The maturity method grew out of studies on temperature and time effects on the compressive strength of normal-strength concrete. Its early progress was documented in a critical review by Malhotra (1974, a and b). A significant development came with the formulation of the Nurse-Saul maturity function as a progressive strength index (Saul 1951):
[6]
M
(
t
)
=
Σ
(
T
a−
T
o)
×
∆
t
where M(t) is the temperature-time factor (ºC-hours), ∆t is the time interval (hours), Ta is
the average concrete temperature (ºC) during the time interval, and To is the datum
temperature (ºC) below which the strength of concrete will cease to develop (Plowman 1956). The capabilities and limitations of the Nurse-Saul maturity function have been studied in great details. One drawback was its lack of physical meaning, being a simple mathematical combination of temperature and time.
Cement hydration – Freiesleben-Hansen and Pederson (1977) provided insights into the physical meaning of maturity. They conceptually modeled the rate of cement hydration (α) using functions of temperature and degree of hydration, in analogy with a pure chemical reaction (compare Eq. 7 with Eq. 1):
[7]
g
(
)
f
(
T
)
dt
d
T×
=
α
α
In this model, the effect of degree of hydration, g(α), and the effect of temperature, f(T), are assumed to affect the rate of hydration separately. This assumption led to an important starting point: the degree of hydration is correlated to the integral of its temperature function over time:
[8]
∫
=
∫
t odt
t
T
f
g
d
0))
(
(
)
(
αα
α
Their second contribution was to generalize all the previously formulated maturity indexes as the integral of a temperature function over time proportioned by a constant, with the only difference being the format of f(T):
[9]
τ
d
τ
T
f
T
f
t
M
t ref∫
=
0(
)
))
(
(
)
(
where Tref is a reference temperature, and Τ is the actual temperature. As a result, this
defined maturity (Eq.9) is directly correlated with the degree of hydration (Eq. 8). They further proposed to use the Arrhenius temperature function as f(T) for cement hydration and consequently, the maturity definition became as follows:
[10]
( )
dt t T T R E t M t ref a ∫ ⎟⎟ ⎠ ⎞ ⎜ ⎜ ⎝ ⎛ ⎟⎟ ⎠ ⎞ ⎜⎜ ⎝ ⎛ + − + = 0 273 1 273 1 exp ) (This Arrhenius maturity function (or equivalent age) has been most widely accepted, however, the previous definition of maturity as the integral of the temperature function of cement hydration (Eq. 9) did not receive as much attention. This definition (Eq. 9) provided the physical meaning to maturity, and it also allowed to formulate new maturity indices using more precise temperature functions as the understanding of cement
hydration proceeds. Several temperature functions exist today and were summarized recently by Jensen and Hansen (1999), however, only the linear Nurse-Saul function (Eq. 6) and the Arrhenius function (Eq. 10) are widely accepted and adopted by ASTM and RILEM specifications.
Compressive strength – Carino and colleagues (Carino and Lew 1983; Carino 1984; Carino and Tank 1992) used the temperature function to calculate the maturity with regard to the compressive strength only. Instead of using the conceptual hydration rate model, they proposed deriving the temperature function directly from a hyperbolic compressive strength development model (Carino 1984), as seen in Eq.11. [11]
)
(
)
(
1
)
(
)
(
)
(
o o ut
t
T
K
t
t
T
K
S
t
S
−
×
+
−
×
=
where S(t) is the compressive strength at time t, K(T) is the initial slope of the compressive strength as a function of temperature, to is the time at which the strength
development begins, and Su is the ultimate compressive strength.
Their formulation included two important steps, as follows:
1) The temperature function is defined from the initial slope of the relative strength (S/Su)
curve at t = to. The temperature function is established by obtaining the initial slopes at
different temperatures.
2) The activation energy of compressive strength is calculated by using the Arrhenius plot of the obtained temperature function, as if the compressive strength was a chemical reaction. ASTM 1074 adopted this procedure to determine Ea of a concrete mix.
Note that once a model, other than the above hyperbolic model, is able to correlate precisely the strength and time, it can also be used to determine the initial slope in the first step. Our further derivation of Eq. 11 confirmed that K(T) in this model is indeed the temperature function (compare Eq. 12 with Eq.1):
[12] ( ) ( ) (1 ( ))2 ( ) ( ( )) u u u S t S g T K S t S T K S t S dt d = × − = ×
The above derivation reveals an important fact about the hyperbolic model. The rate of the relative compressive strength development consists of two separate functions of temperature and relative strength, which makes the activation energy independent of strength development (see Eq. 3). If this K(T), whether it has Arrhenius behavior or not,
is used in Eq. 9 to define the maturity, the defined maturity can be used to predict the relative strength at any given time, as shown by the following derivation:
[13] u u S S t t St S S t S d dt T K t M u ) ( 1 ) ( ) 1 ( ) ( ) ( / 0 2 0 − = ∫ − = ∫ ∝ ξ ξ
Equation 13 confirms mechanistically the experimental observations made by Carino and Tanks (1992) that that a successful application of the maturity method lied in precise identification of the temperature function for a given concrete mix design.
In summary, their contribution was to establish a procedure for calculating the maturity specifically for the compressive strength, which pointed to a direct correlation between maturity and the temperature function (Eq. 13). This approach could potentially be extended to formulate the maturity of other concrete properties, as long as the temperature function is representative of the property of interest.
Other concrete properties – The recent years have witnessed great efforts to generalize the maturity method for other concrete properties, seen as setting time (Turcry et al. 2002; Pinto and Hover 1999), autogeneous shrinkage (Jensen and Hansen 1999, Turcry et al. 2002), thermal expansion (Laplante and Boulay 1994), fracture energy (Yu and Ansari 1996), bond strength (Delatte et al. 2000), and the degree of hydration (Kjellsen and Detwiler 1992; Kada-Benameur et al. 2000; Pane and Hansen 2002). A generalized maturity definition for a given property (P) can be also defined as the integral of its temperature function f(T) as shown in Eq. 9, assuming that f(T) can be modeled from the development rate of that property (Jensen and Hansen 1999):
[14]
g
(
P
)
f
(
T
)
dt
dP
T×
=
where g( P) is a function of property P. Given the fact that the maturity approach was initially formulated for compressive strength, there is a need to validate the approach to accurately quantify other properties. Although the developments of compressive strength and other concrete properties depend on cement hydration, the temperature function for each property is not necessarily similar to that of cement hydration. Equation 14 gives an clear message: there may not be a single maturity index for all properties of one concrete; the maturity for each property should be formulated by its own temperature function. In practice, however, most work assumed an Arrhenius temperature function, in which the activation energy is the sole parameter. The literature does provide information for the values of Ea, but such information is contradictory. Examples are:
• Kada-Benameur et al. (2000) showed that cement hydration measured by calorimetry is Arrhenius only at early ages (for less than 50% degree of hydration);
• Kjellsen and Detwiler (1992) and Pane and Hansen (2002) reported that Ea for
cement hydration measured by evaporable water reduces with increasing hydration. • Schindler (2004) reported by analyzing data from the literature that the hydration
EXPERIMENTAL PROGRAM
The aim of this study was to investigate the link between maturity and the development of different properties of HPC. The experimental program was designed:
1. To examine the activation energy for each property studied, namely, compressive strength, tensile strength, modulus of elasticity, and degree of hydration; and 2. To develop a realistic maturity procedure for the prediction of the development of
these properties for HPC.
Mixture Proportions
High-performance concrete was designed with ASTM Type I cement, a w/c ratio of 0.34, and a cement-sand-aggregate ratio of 1:2:2. The detailed mixture proportions are
provided in Table 1, which also shows the slump, air content, density of the concrete measured after casting, and the compressive strength measured at 7 days.
Preparation of Specimens and Testing for Mechanical Properties
All concrete samples were made from the same batch to minimize variability. After finishing, the samples were sealed with plastic covers to prevent moisture exchange. All samples were stored at ambient room temperature (25°C) until the concrete was strong enough for demolding (3 hours after setting). After demolding, the samples were placed into the 3 environmental chambers with temperatures previously set to 10°C, 25°C and 40°C. This procedure was undertaken to ensure that the onset of strength development was similar for all samples. This was also considered to be closer to real practice, in which effort is often made to maintain the curing temperature for a certain time after casting. If the samples had been placed in the temperature chambers immediately after mixing instead, the rate of cement hydration and the microstructure of concrete under different curing temperatures would have been different before the strength started to develop, which would have rendered the comparisons more difficult.
The compressive strength (ASTM C39) and modulus of elasticity (ASTM C469) were tested on 2 replicates, and the splitting tensile strength (ASTM C496) on 3 replicates, at the ages of 1, 2, 4, 7, and 28 days, for each of the 3 curing temperatures. If the difference between one replicate and the average of the replicates exceeded 10%, a supplementary sample was tested. The temperatures in the environmental chambers and the temperatures in the concrete samples, measured with embedded thermocouples, were monitored continuously from the time of casting to the time of testing.
Preparation of Specimens and Testing for Level of Hydration
The samples for the determination of cement hydration as a function of time were prepared separately. A cement paste with a w/c ratio identical to that of the concrete formulation shown in Table 1 was used in order to compare the activation energy for
hydration with that of each mechanical property. The paste samples were cured at the 3 specified temperatures until they were analyzed by combined TGA/DTA (Thermo-Gravimetric Analysis/Differential Thermal Analysis). The results obtained were used to evaluate the level of hydration expressed as a percentage of Ca(OH)2 formed over time.
The tests were performed with a Q600 SDT thermal analyzer and the samples were heated from room temperature to 80°C at a rate of 10°C/minute held isothermally for 1 hour then heated to 1050°C at a rate of 10°C/minute under a dry nitrogen atmosphere. The cement hydration model was simplified as seen in Eq. 15, and quantitative TGA measurements were taken on the cement hydrates (C-S-H) and Ca(OH)2 to evaluate the
progress of the hydration reaction of the ordinary Portland cement (OPC): [15] OPC + 2H2O = C-S-H + Ca(OH)2
RESULTS AND DISCUSSIONS
Measured Properties as Function of Time
Figure 1 presents the temperatures monitored for the 3 groups of cylinders and the respective ambient temperatures during the first day of testing. Figures 2 to 5 provide the results for the compressive strength, splitting tensile strength, modulus of elasticity, and level of cement hydration measured at the 3 curing temperatures. The effect of curing temperature on a given property can readily be observed: the higher the temperature, the faster the properties develop, due to the cement hydration reactions progressing faster. The measured data shown in Figures 2 to 5 were used in regression analyses to model the properties as functions of time. Since the early-age development of HPC properties are of prime interest to this study, the analyses presented in this paper focus mainly on the results measured during the first 7 days of testing, in order to obtain a more accurate regression for that period of interest; however some selected 28-day results are presented as supplementary information. The following exponential equation was used to describe the development of each mechanical property:
[16] ⎥ ⎥ ⎦ ⎤ ⎢ ⎢ ⎣ ⎡ ⎟ ⎟ ⎠ ⎞ ⎜ ⎜ ⎝ ⎛ ⎟ ⎠ ⎞ ⎜ ⎝ ⎛ − = d B t A f t f( ) 7 exp 1 7
where f(t) is a given property as a function of time, f7d is the property value at 7 days,
t is the time, and A and B are constants, obtained from the regression analyses for each
property and curing temperature, are given in Figures 2 to 5. With respect to modeling, one can observe in Figure 2, 3 or 4 that, once the cylinders are installed in their respective environments (3 hours after setting), the single curve (for 25°C) splits into 3 different ones, corresponding to the curing temperatures of 10, 25 and 40°C.
Determination of Activation Energy at Different Levels of a Property
Values of activation energy were determined with Eq. 5 by calculating the development rates of a given property, for each curing temperature at specified values of that property
during its development. In the present paper, this calculation procedure will be referred to as the Slope Method, and the ratio Ea/R (in Eq. 5) will be referred to as the activation
energy factor. For example, the calculation procedure for the activation energy factor of the compressive strength at 16 MPa (which was 30% of the 7-day strength) is presented in Figure 6. In this example, the activation energy factors (or slopes) were determined for 3 different temperature ranges: 10-25°C only, 25-40°C only, and 10-25-40°C. For comparison purposes, a single activation energy value for each property was also calculated following the ASTM 1074 method, in which the activation energy is
determined from the initial development rate only (i.e. for the time at which the samples were put in the environmental chambers).
Figures 7 to 10 present activation energy factors obtained for compressive strength, tensile strength, elastic modulus, and cement hydration as a function of their respective development level. In each of the four figures, the curve in the middle of the group (identified by 10-25-40°C) is based on development rates calculated for the 3
temperatures, and the two other curves are based on rates calculated for 2 temperatures only (i.e. for the 10-25°C range or the 25-40°C range).
From the 3-temperature results, one can see that Ea/R factors varied from 2256K to
4278K for compressive strength, from 3763K to 7781K for tensile strength, from 7145-8435 for modulus of elasticity, and from 3845K to 9239K for level of hydration (e.g. amount of Ca(OH)2 formed). It is clear that different properties have different range of Ea/R values. These results also show the Ea/R values are not constant and increase
gradually with time (or development). This is consistent with the changing physical chemistry of the cement phases during hydration. As the faster reacting phases are used up, the average Ea of the remaining unhydrated material is dominated by the slower
reacting phases of higher Ea.
Further comparison of Ea/R values at different temperature ranges can address the
question of whether the assumed behavior is truly Arrhenius or not, as discussed earlier. Compare the 3-temperature results with the two temperature results from Figures 7 to 10, it is evident that the activation energy factor for a given property is perhaps temperature dependent. Especially for splitting tensile strength, a poor Arrhenius behavior for the full temperature range of 10-40°C is identified by a large difference between the curves for the 10-25°C range and 25-40°C range. In the case of compressive strength (Fig. 7), slightly higher Ea/R values were found for the colder range (10-40°C) for strengths below
35 MPa, and the opposite trend was found for strengths above 35 MPa.
Carino and Tank (1992) reported initial development rate values and activation energy factors for the compressive strength of 6 types of water-cured concretes with w/c ratios of 0.45 and 0.60 under temperatures of 10, 20 and 40°C. Their data were further analyzed in this paper to examine further the temperature dependence of the activation energy. The data and analysis results are shown in Table 2 with Ea/R factors calculated for the curing
temperature ranges of 10-20°C and 20-40°C. It is interesting to note that the 6 concrete types had larger Ea/R values in the warmer range (20-40°C) than in the colder range
observations made previously from the data shown in Figure 7. This difference may be caused by several reasons: (i) different curing conditions, (i) different w/c ratios, and (iii) different concrete additives or admixtures. However, these results together do convey important information on the activation energy:
1) The activation energy may be different for different temperature ranges for a given property;
2) A given property does not have a constant value of activation energy during its development in time; and
3) Different properties of the same concrete have different values of activation energy.
Determination of Maturity Function for Property Prediction
The usefulness of the maturity index (e.g. equivalent age or time-temperature factor) requires a “unique” correlation, independent of curing temperatures, between the maturity and property of interest when other curing conditions, such as moisture movement, are kept constant. Given the fact that the equivalent age (Eq. 10) is the most accepted maturity index for compressive strength, the proper selection of the activation energy is a necessary step to achieve a unique correlation. As discussed above, contrary to the conventional practice in which Ea is taken as a constant value, the activation energy
varies with property development (or time) and is different for each concrete property. Ideally, Ea used in Eq. 10 should be a function of time, for theoretical consideration.
Figure 11 shows the development of compressive strength as a function of maturity calculated with such varying Ea (see figure 7 for the 10-25-40°C temperature range). The
high degree of correlation with the experimental data confirms the effectiveness of the prediction method. However, it is not simple or practical to determine experimentally a varying activation energy factor for the calculation of maturity. A new approach is proposed to solve this apparent conflict between the theoretical requirement and practical limitation. It is outlined in the following section.
Best-Fit Maturity Approach
A Best-Fit Method is proposed to determine an activation energy factor (or a general parameter) to be used in the equivalent age (or a general maturity) formulation, in order to obtain a best-fit correlation between the experimental data for a given property and the calculated maturity at different temperatures.
The steps for finding a unique best-fit Ea/R factor for a given property are summarized
below:
(1) Establish the best-fit relationship for the given property as a function of time, using Eq. 16 and the data measured at the reference temperature only (for example 25°C); (2) Calculate the maturity of the property with Eq. 10, using the data measured for the 3
(3) Predict the property for the 3 temperatures as a function of maturity (instead of time), using the best-fit relationship established in step (1);
(4) Calculate the prediction error (i.e. the mean relative difference between pairs of predicted and measured values), using the data for the 3 temperatures; and
(5) Solve for the value of activation energy factor that gives the smallest prediction error, by repeating steps 2 to 5 using the updated value of the activation energy factor. As a result, the 3 curves of the property measured as a function of time under different temperatures will collapse into one single curve as a function of maturity. Note that a similar approach was used independently by Waller et al. (2004).
The fundamental assumption behind the Best-Fit Method is in fact the “reverse” of the main assumption behind the conventional maturity concept. It is assumed in the conventional maturity concept (Saul 1951) that a given concrete cured under different temperature histories, which has achieved the same maturity, will reach the same strength (or level of a given property). It implies that, in practice, the maturity index is formulated first (not subject to adjustment), and then the correlation between maturity and the property development is established, assuming this correlation is unique for different temperatures. The Best-fit Method, however, assumes that a given concrete cured under different temperature histories, which has developed to the same level of a given property, will have the same maturity for that property. Based on this “reversed” assumption, a maturity index that provides a unique correlation with the property development can be established. The ultimate goal of the Best-fit Method is to obtain a unique maturity-property correlation for a given property of a concrete. It is achieved by using a mathematical approach that has no need for pre- assumed or pre-defined
parameters such as Ea/R, with the exception of relying on the Arrhenius maturity index to
calculate the maturity like in the conventional method.
Figures 12-15 illustrate the relationship between each property and its maturity formulated by the Best-Fit Method (constant Ea/R). As can be seen, each property was
well correlated to its maturity for concrete cured at different temperatures. Table 3 lists the activation energy factors and mean prediction errors (in absolute values) for the given properties using different methods, namely the ASTM calculation method (initial slope), the Slope method (varying Ea/R) and the Best-Fit method (unique Ea/R). It can be seen in
general that maturity is more accurately estimated when the Best-Fit method is used over the ASTM method.
In order to stress further the point that different properties may have different activation energy factors, the factor obtained by the Best-Fit Method for compressive strength was used to estimate the other properties as functions of maturity. The higher prediction errors found clearly showed that the activation energy factor found for compressive strength may not be best for predicting tensile strength or modulus of elasticity.
CONCLUSIONS
This study has shown that thorough experimental procedures and careful determination of the activation energy are required to calculate the maturity index. It is further suggested that:
• Different properties of the same high-performance concrete mix design have different values of activation energy (or temperature sensitivities);
• A given property does not have a constant value of activation energy over time; • Activation energy factors differ at different temperature ranges (i.e. 10-20°C versus
20-40°C).
These findings suggest that the maturity index calculated for one property should not be used to accurately predict other properties of the same concrete. This statement makes the conventional use of the Arrhenius maturity index, calculated with pre-defined activation energy, less dependable. To address this issue a Best-Fit method for calculating the Arrhenius maturity index was proposed. Using this new approach, the determination of a unique and accurate correlation between maturity and the concrete property of interest was found.
REFERENCES
Atkins, P. W., Physical chemistry, 3rd edition, Oxford University Press, 1986. Carino, N. J., "The Maturity Method: Theory and Application," Journal of Cement,
Concrete, and Aggregates, 6 (2), 1984, pp. 61-73.
Carino, N. J. and Lew, H. S., “ Temperature Effect on Strength-Maturity Relations of Mortar,” ACI Material Journal, 80 (3), 1983, pp. 177-182.
Carino, N. J and Tank, R. C., “ Maturity Functions for Concrete Made with Various Cements and Admixtures,” ACI Material Journal, 89 (2), 1992, pp.188-196. Delatte, N. J, Williamson, M. S., and Fowler D.W., “ Bond strength development with
maturity of high-early-strength bonded concrete overlays,” ACI Material Journal, 97, 2000, pp. 201-207.
Freiesleben-Hansen, P. and Pedersen E. J., “ Maturity Computer for Controlled Curing and Hardening of Concrete,” Nordic Concrete Research, 1, 1977, pp. 21-25. Jensen O. M. and Hansen P. F., “ Influence of temperature on autogeneous deformation
and relative humidity change in hardening cement paste,” Cement and Concrete
Research,” 29 (4), 1999, pp.567-575.
Kada-Benameur, H., Wirquin, E., and Duthoit, B., “ Determination of apparent activation energy of concrete by isothermal calorimetry,” Cement and Concrete Research,” 30 (2), 2000, pp.301-305.
Kjellsen, K. O. and Detwiler, R. J., “Reaction kinetics of Portland cement mortars hydrated at different temperatures,” Cement and Concrete Research,” 22 (2), 1999, pp.112-120.
Laplante, P. and Boulay, C. E. “Evolution of the thermal expansion coefficient of concrete as a function of its maturity at very early ages,” Materials and Structures, 27 (174), 1994, pp.596-605.
Malhotra, V. M., “Maturity concept and estimation of concrete strength: a review- 1,”
Indian Concrete Journal, April 1997, pp.122-127.
Malhotra, V. M., “Maturity concept and estimation of concrete strength: a review- 2,”
Indian Concrete Journal, May 1997, pp.155-159.
Pane, I., and Hansen, W., “Concrete hydration and mechanical properties under nonisothermal conditions,” ACI material Journal, 99 (6), 2002, pp. 534-542 Pinto, R. C. A., and Hover, K. C., “Application of maturity approach to setting time,”
ACI Material Journal, 96 (6), 1999, pp.686-691.
Plowman, J. M., “ Maturity and the strength of concrete,” Magazine of Concrete, March, 1956, pp. 13-22.
Saul, A. G. A., “Principles underlying the steam curing of concrete at atmosphere pressure”, Magazine of Concrete Research, March 1951, pp.127-140.
Schindler, A. K.,“ Effect of Temperature on Hydration of Cementitious Material,” ACI
Material Journal, 101 (1), 2004, pp.72-80.
Turcry, P., Loukili, A., Barcelo, L., and Casabonne, J. M., “Can the maturity concept be used to separate the autogeneous shrinkage and thermal deformation of a cement paste at early age?” Cement and Concrete Research, 32 (9) 2002, pp.1443-1450. Waller V., d'Aloïa L., Cussigh F., and Lecrux S., “ Using the maturity method in concrete
cracking control at early ages.” Cement and Concrete Composite, 26 (5), 2004, pp. 589-599.
Yu, B.J., and Ansari F., “Method and theory for nondestructive determination of fracture energy in concrete structure,” ACI structural journal, 93 (5), 1996, pp.1-10.
TABLES AND FIGURES
Table 1 – Concrete mix design (w/c=0.34).
Constituents Proportions Properties
Stone (20 mm max.) Sand
Cement (ASTM Type 1) Water
Superplasticizer (Disal, solid)
125.0 kg 125.0 kg 62.5 kg 21.3 kg 2.1 kg Slump Air content Density Compressive strength at 7 days 185 mm 4 % 2452 kg/m3 50 MPa
Table 2 – Activation energy factors calculated from original data of Carino and Tank (1992). W/C=0.45 W/C=0.60 Cement Type KT (1/day) 10-20°C (K) 20-40°C (K) Difference KT (1/day) 10-20°C (K) 20-40°C (K) Difference 0.202 0.212 0.401 4969 0.336 3204 Type I 2.673 9218 86% 1.482 7419 132% 0.205 0.153 0.351 3598 0.287 4361 Type II 1.641 7938 121% 0.911 5613 29% 0.523 0.508 0.844 3620 0.832 3575 Type III 3.313 6030 67% 3.204 6244 75% 0.231 0.176 0.623 7190 0.291 3978 Type I + 20% fly ash 0.868 1573 -78% 0.642 3557 -11% 0.131 0.057 0.194 3106 0.113 5176 Type I + 50% slag 0.902 6335 104% 0.599 7523 45% 0.381 0.249 0.659 4334 0.397 3690 Type I + accelerator 2.689 5796 34% 2.004 7116 93% 0.206 0.153 0.367 4568 0.286 4732 Type I + retarder 1.117 4685 3% 0.835 4622 -2%
Table 3 – Activation energy factors calculated with different methods.
Compressive Strength Tensile Strength Modulus of Elasticity Level of Hydration Maturity Method Ea/R (K) Error (MPa) Ea/R (K) Error (MPa) Ea/R (K) Error (MPa) Ea/R (K) Error (%) Constant Ea (ASTM) 2910 1.09 4714 0.15 4217 804 n/a n/a Varying Ea (Slope method) 2256-4278 1.09 3763-7781 0.17 7145-8435 615 3845-9239 1.8 Best-Fit Ea (Proposed) 3133 1.06 6351 0.13 6215 541 4183 0.4
0 10 20 30 40 50 0 4 8 12 16 20 24
Time after setting (day)
T emp er at u re ( °C ) Specified T = 40°C Specified T = 25°C Specified T = 10°C Concrete Environmental chamber
Time when samples were placed in curing chambers
Figure 1 – Temperature in concrete samples and environmental chambers.
0 10 20 30 40 50 60 0 2 4 6 8
Time after setting (day)
C o m p r. s tr engt h ( M Pa ) Best-fit data: A10 = 0.297 A25 = 0.232 A40 = 0.213 B = 0.50 10°C 40°C 25°C Best-fit curve Measured data
Figure 2 – Compressive strength measured for 3 curing temperatures.
0 1 2 3 4 5 0 2 4 6 8
Time after setting (day)
T ens il e s tr engt h ( M P a) Best-fit data: A10 = 0.065 A25 = 0.027 A40 = 0.019 B = 1.00 10°C 40°C 25°C Best-fit curve Measured data
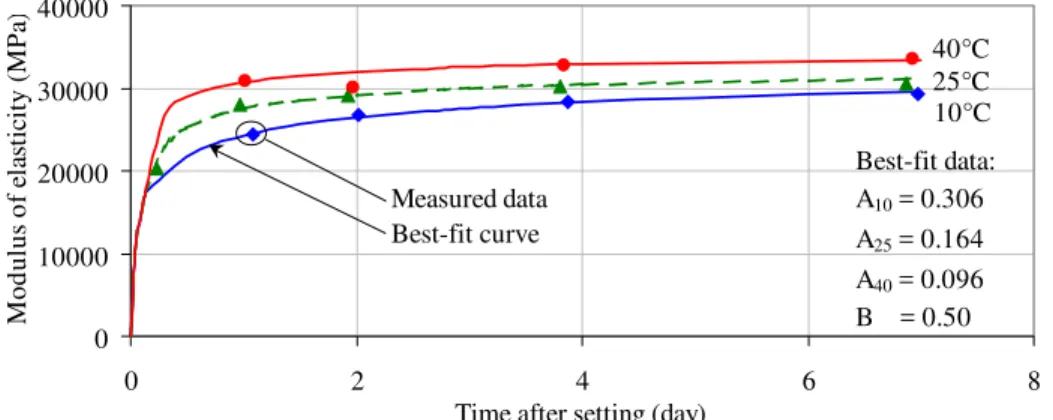
0 10000 20000 30000 40000 0 2 4 6
Time after setting (day)
M o d u lu s o f el ast ici ty ( M P a 8 ) Best-fit data: A10 = 0.306 A25 = 0.164 A40 = 0.096 B = 0.50 10°C 40°C 25°C Best-fit curve Measured data
Figure 4 – Modulus of elasticity measured for 3 curing temperatures.
0 3 6 9 12 0 2 4 6
Time after casting (day)
H y d ra ti o n le v el (% C a (O H ) 2 ) Best-fit data: A10 = 0.026 A25 = 0.006 A40 = 0.002 B = 2.00 10°C 40°C 25°C Best-fit curve Measured data 8 Figure 5 – Level of hydration measured for 3 curing temperatures.
3.50 3.75 4.00 4.25 4.50 0.0031 0.0032 0.0033 0.0034 0.0035 0.0036 1 / Temperature (1/K) Ln (K ) Ea/R = 2256 K for 10-25-40°C (R2 = 95%)
Data for compressive strength of 16 MPa
Ea/R = 1469 K
for 25-40°C
Ea/R = 3212 K
for 10-25°C
0 3000 6000 9000 12000 10 20 30 40 50
Compressive strength (MPa)
A ct iv at io n en er g y f act o r (K )
Constant value found with ASTM method for 10-25-40°C
10-25-40°C 10-25°C 25-40°C
Figure 7 – Activation energy factors for compressive strength.
0 3000 6000 9000 12000 0 1 2 3 4
Tensile strength (MPa)
A ct iva ti on e ne rg y fa ct or ( K 5 )
Constant value found with ASTM method for 10-25-40°C
10-25-40°C 10-25°C
25-40°C
Figure 8 – Activation energy factors for splitting tensile strength.
0 3000 6000 9000 12000 15000 20000 25000 30000
Modulus of elasticity (MPa)
A ct iv at io n en er g y f act or ( K )
Constant value found with ASTM method for 10-25-40°C 10-25-40°C
10-25°C 25-40°C
0 3000 6000 9000 12000 0 3 6 9
Hydration level (% of Ca(OH)2)
A ct ivat io n en er g y f act or ( K 12 ) 10-25-40°C 10-25°C 25-40°C
Figure 10 – Activation energy factors for level of hydration.
0 10 20 30 40 50 60 0 7 14 21 28 Maturity (day) Co m p r. s tre n g th ( M P a)
Estimated compressive strength Measured data for the 3 temperatures
Figure 11 – Compressive strength as a function of maturity (Slope Method).
0 10 20 30 40 50 60 0 7 14 21 28 Maturity (day) Co m p r. st re n g th ( M P a)
Estimated compressive strength Measured data for the 3 temperatures
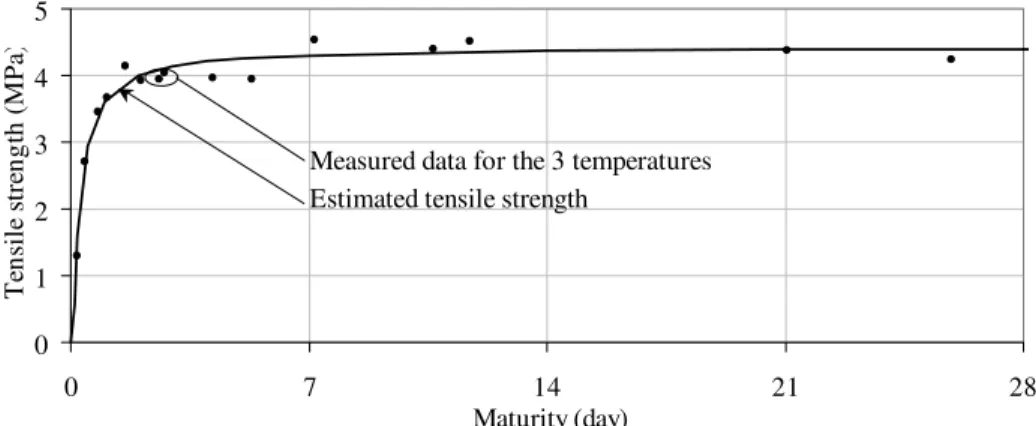
0 1 2 3 4 5 0 7 14 21 28 Maturity (day) T ens il e s tr engt h (M P a)
Estimated tensile strength
Measured data for the 3 temperatures
Figure 13 – Splitting tensile strength as a function of maturity (Best-Fit Method).
0 10000 20000 30000 40000 0 7 14 21 28 Maturity (day) M o d u lu s o f e la sti city (M P a)
Estimated modulus of elasticity Measured data for the 3 temperatures
Figure 14 – Modulus of elasticity as a function of maturity (Best-Fit Method).
0 3 6 9 12 0 7 14 21 28 Maturity (day) H y dr at io n l evel ( % of C a( O H ) 2 )
Estimated level of hydration Measured data for the 3 temperatures