Publisher’s version / Version de l'éditeur:
Vous avez des questions? Nous pouvons vous aider. Pour communiquer directement avec un auteur, consultez la première page de la revue dans laquelle son article a été publié afin de trouver ses coordonnées. Si vous n’arrivez Questions? Contact the NRC Publications Archive team at
PublicationsArchive-ArchivesPublications@nrc-cnrc.gc.ca. If you wish to email the authors directly, please see the first page of the publication for their contact information.
https://publications-cnrc.canada.ca/fra/droits
L’accès à ce site Web et l’utilisation de son contenu sont assujettis aux conditions présentées dans le site
LISEZ CES CONDITIONS ATTENTIVEMENT AVANT D’UTILISER CE SITE WEB.
Research Report (National Research Council of Canada. Institute for Research in
Construction), 2010-03-08
READ THESE TERMS AND CONDITIONS CAREFULLY BEFORE USING THIS WEBSITE.
https://nrc-publications.canada.ca/eng/copyright
NRC Publications Archive Record / Notice des Archives des publications du CNRC :
https://nrc-publications.canada.ca/eng/view/object/?id=2d5fdbde-31c9-41a4-a536-f4636db50978 https://publications-cnrc.canada.ca/fra/voir/objet/?id=2d5fdbde-31c9-41a4-a536-f4636db50978
NRC Publications Archive
Archives des publications du CNRC
For the publisher’s version, please access the DOI link below./ Pour consulter la version de l’éditeur, utilisez le lien DOI ci-dessous.
https://doi.org/10.4224/20374739
Access and use of this website and the material on it are subject to the Terms and Conditions set forth at
Numerical and experimental investigations of fire behavior due to
polyurethane foam and wood cribs in a medium-sized residential room
http://www.nrc-cnrc.gc.ca/irc
N um e ric a l a nd e x pe rim e nt a l inve st iga t ions of fire be ha vior due t o
polyure t ha ne foa m a nd w ood c ribs in a m e dium -size d re side nt ia l
room
I R C - R R - 2 9 1
S a b e r , H . H . ; K a s h e f , A . ; B w a l y a , A . C . ;
L o u g h e e d , G . D .
M a r c h 2 0 1 0
The material in this document is covered by the provisions of the Copyright Act, by Canadian laws, policies, regulations and international agreements. Such provisions serve to identify the information source and, in specific instances, to prohibit reproduction of materials without written permission. For more information visit http://laws.justice.gc.ca/en/showtdm/cs/C-42
Les renseignements dans ce document sont protégés par la Loi sur le droit d'auteur, par les lois, les politiques et les règlements du Canada et des accords internationaux. Ces dispositions permettent d'identifier la source de l'information et, dans certains cas, d'interdire la copie de documents sans permission écrite. Pour obtenir de plus amples renseignements : http://lois.justice.gc.ca/fr/showtdm/cs/C-42
Numerical and Experimental Investigations of Fire
Behavior of Polyurethane Foam and Wood Cribs in a
Medium-Sized Residential Room
By
Hamed H. Saber, Ahmed Kashef, Alex Bwalya, and Gary Lougheed
Research Report # RR-291
Date: March 8, 2010
84 Pages
Institute for Research in Construction
Fire Research Program
PREFACE
This report presents the comparisons of numerical predictions with the measurements of the heat release rate and temperatures of a fire experiment in a medium-sized
residential room. The objective of this study was to benchmark the Fire Dynamics Simulator (FDS) version 5 by comparing its predictions with experimental data. Also, the report focuses on investigating the melting phenomenon due to burning polyurethane foams and its effect on the fire growth and spread.
The Characterization of Fires in Multi-Suite Residential Dwellings (CFMRD) project is a four-year collaborative undertaking with industries, provincial governments and city authorities that was initiated by NRC-IRC in 2006 to study fires in low-rise multi-suite residential dwellings of light-frame construction. The main objectives of this project are to: a) address the lack of realistic characterized fire types, known as design fires, which are required to aid the development of methods for achieving performance-based solutions to fire problems, and b) further the understanding of how fires in residential buildings sometimes cause fatalities and substantial property losses, as revealed by fire statistics.
The CFMRD project focuses on fires in dwelling units, such as apartments, semi-detached houses, duplex houses, townhouses or row houses, secondary suites and residential care facilities as these fires have a potentially greater impact on adjacent suites.
The main tasks/deliverables of the project are:
1. To conduct fire experiments to characterize fires originating in various living spaces within multi-suite dwellings.
2. To conduct numerical simulations of various fire scenarios in order to interpolate and extend the data beyond that obtained in the experimental studies.
3. To produce a set of realistic design fires for multi-suite dwellings from the experimental data.
4. To develop an analytical method that can be used to calculate design fires for multi-suite dwellings.
The research approach employed by the project utilizes literature reviews, surveys to determine typical configurations and combustibles, computer simulations and fire
experiments. A well-instrumented test facility, equipped with a calorimeter, will be used to conduct medium- and full-scale fire experiments in order to determine the combustion characteristics of typical household furnishings found in living spaces that have a high incidence of fires, individually in a single room and collectively in realistically furnished and well-instrumented simulated residential rooms. Numerical modelling of fire development, using suitable fire models, will be conducted at various stages to assist in the design and instrumentation of the full-scale fire experiments as well as to study the effect of various parameters, such as the ventilation conditions, fire load and room geometries, and fire load density on the development of the fire.
Characterization of Fires in Multi-Suite Residential
Dwellings (CFMRD)
NRC-IRC gratefully acknowledges the financial and technical support of the Project Consortium, which consists of representatives from the following participating organizations:
Canadian Automatic Sprinkler Association
Canadian Concrete Masonry Producers Association
Canadian Council of Furniture Manufacturers
Canadian Wood Council
City of Calgary
FPInnovations - Forintek Division
Gypsum Association
Masonry Worx
Ontario Ministry of Municipal Affairs and Housing
Régie du Bâtiment du Québec
Canadian Codes Centre
Ontario Ministry of Community Safety and Correctional Services (Office of the Fire Marshall)
ACKNOWLEDGMENT
The authors acknowledge the contribution of all of the members of the technical and advisory groups of the project at the NRC-IRC Fire Research Program: Eric Gibbs, Bruce Taber, Sasa Muradori and Joseph Su.
Numerical and Experimental Investigations of Fire
Behavior of Polyurethane Foam and Wood Cribs in a
Medium-Sized Residential Room
ByHamed H. Saber, Ahmed Kashef, Alex Bwalya, and Gary Lougheed
ABSTRACT
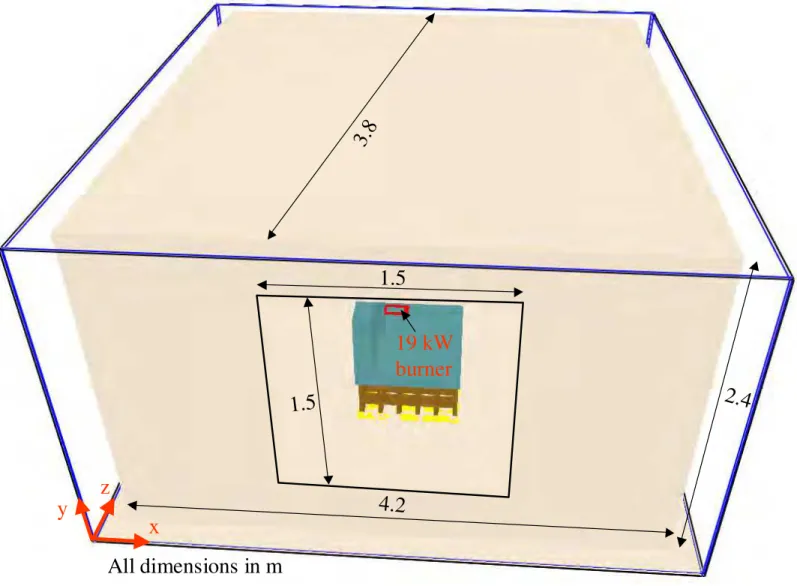
This work is a part of a project concerning the characteristics of fires in various rooms in low-rise residential dwellings of light-frame construction. In this work, a commissioning fire test was conducted in a room of a size 4.2 m long, 3.8 m wide, and 2.4 m high. The room had a square window of size of 1.5 m. The fuel package that was used consisted of a mock-up sofa and two wood cribs underneath it. The mock-up sofa was constructed entirely out of flexible polyurethane foam. The two wood cribs provided additional fuel load to sustain a fully developed fire. The fuel package was located at the center of the room. The heat release rate and temperatures at different locations in the room were measured. A full description of the test facility and the experimental results were documented in a separate report [7].
In this report, literature reviews for the thermal properties and kinetic parameters of polyurethane foams were conducted. The melting phenomenon of the polyurethane foam and its effect on the fire growth and spread were discussed. The Computational Fluid Dynamics (CFD) technique using the Fire Dynamics Simulator (FDS) version 5 was used to conduct numerical simulations for the commissioning fire test.
Comparisons of measurements of heat release rate and temperatures at different location in the room against numerical results were conducted. Results showed that the comparisons of numerical predictions for the Heat Release Rate (HRR), and
temperatures at different elevations above the floor with measurements were reasonably good.
Table of Contents
Preface ... ii
Acknowledgment ... iv
Abstract ... v
1.
Introduction ... 1
Kinetic Parameters ... 12.
Polyurethane Foams ... 4
Review of Thermal Properties and Kinetic Parameters of Polyurethane Foams ... 5
Thermal Properties of Polyurethane Foams ... 5
Kinetic Parameters of Polyurethane Foams ... 7
Melting and Boiling Phenomena of Polyurethane Foams ... 9
Absorption Coefficient of Solids or Liquids ... 13
3.
Observations on the Burning Behavior of PUF and Wood
Cribs 15
4.
Parametric Analyses to Investigate the Effect of Liquid
Pool Fire on Fire Spread and Growth ... 21
Plume Height of Liquid Pool Fire for Different Types of Polyurethane Foams ... 24
5.
CFD Simulation Using FDS ... 28
Boundary Conditions and Assumptions ... 30
Modeling the Melting Phenomenon of Polyurethane Foam ... 30
Modeling Approach – A for Melting Phenomenon ... 31
Modeling Approach – B for Melting Phenomenon ... 34
6.
Results and Discussions ... 36
Heat Release Rate (HRR) ... 36
Temperature Distributions in the Room ... 42
7.
Summary and Conclusion ... 50
8.
References ... 51
List of Figures
Figure 2-1 Melting mass flux from sample of Size of 25 mm x 25 mm for various
polyurethane foams at three incident radiant heat fluxes [3] ... 12
Figure 2-2 Dependence of the fraction of incident radiation on absorption coefficient, κ 13 Figure 2-3 Fraction of incident radiation at different depths of full density thermoplastics [3] ... 14
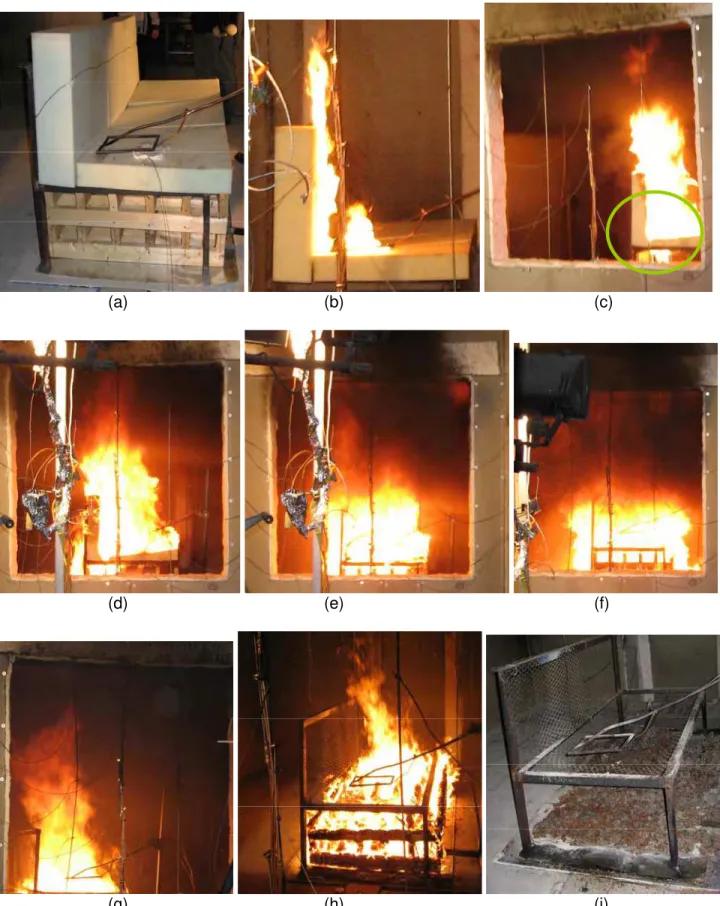
Figure 3-1 Snapshots for the fire behaviour during burning the fire load (sofa and two wood cribs underneath it) in the different fire stages ... 17
Figure 3-2 Enlargement of the snapshot in Figure 3-1c showing melt sliding downwards and liquid pool fire ... 18
Figure 3-3 Horizontal catch surfaces of the melt on the floor and wood ... 19
Figure 4-1 Forming unconfined liquid pool fire due to melting the polyurethane sofa ... 21
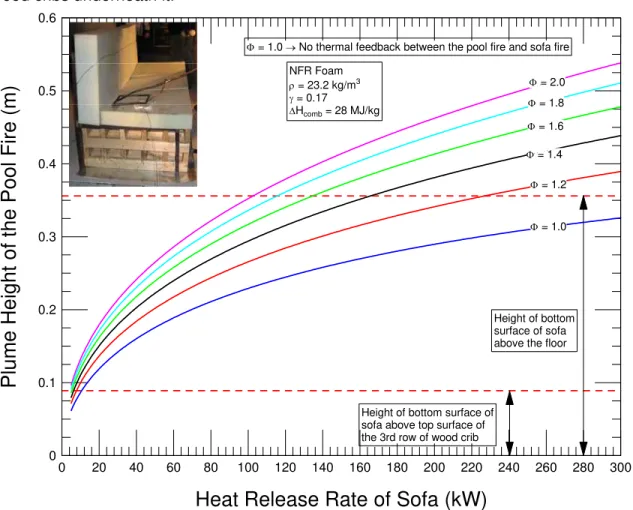
Figure 4-2 Dependence of the plume height of the liquid pool fire on the HRR of a sofa made of NFR polyurethane foam ... 25
Figure 4-3 Dependence of the plume height of the liquid pool fire on the HRR of a sofa made of different types of polyurethane foams ... 27
Figure 5-1 Room size with fuel package located at its center ... 28
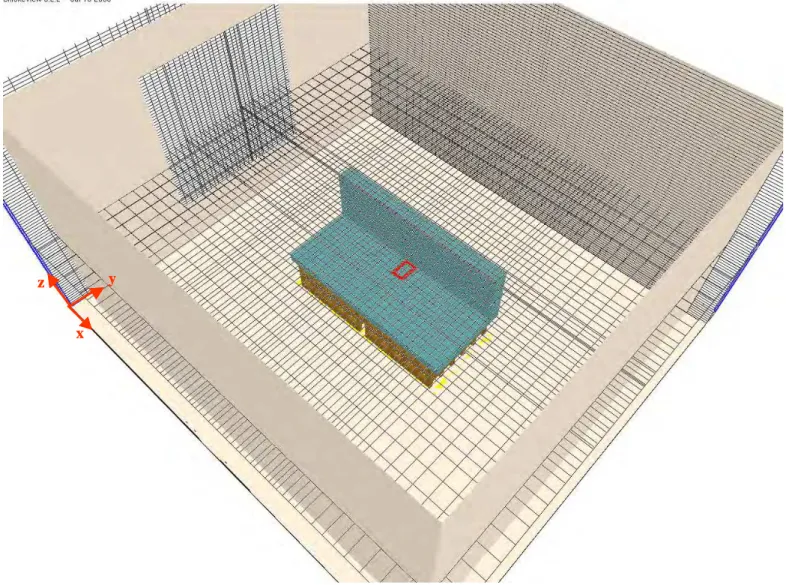
Figure 5-2 Stretched mesh in the x- and y-directions to capture the important phenomena ... 29
Figure 5-3 Flame spread on the polyurethane sofa using Approach – A ... 33
Figure 5-4 Flame spread on the polyurethane sofa using Approach – B ... 35
Figure 6-1 Floor catch surface for the melt forming liquid pool fire ... 36
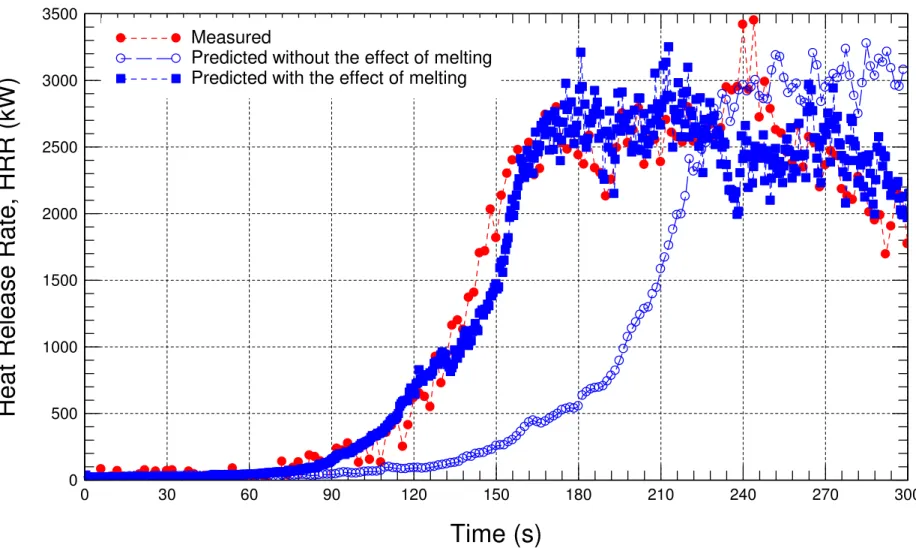
Figure 6-2 Comparison of the measured HRR with the predicted HRR in the case of no pool fire underneath the sofa. ... 39
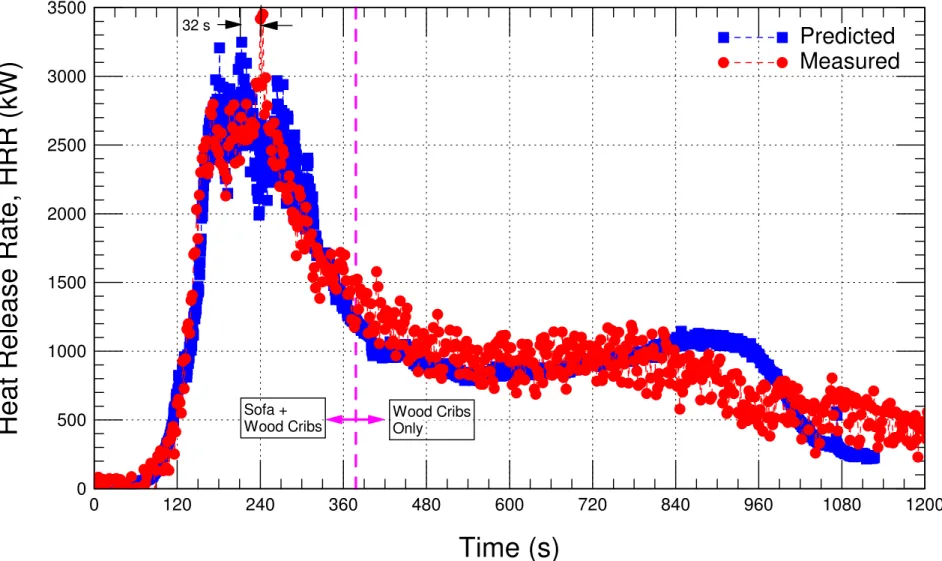
Figure 6-3 Comparison of the measured HRR with the predicted HRR ... 40
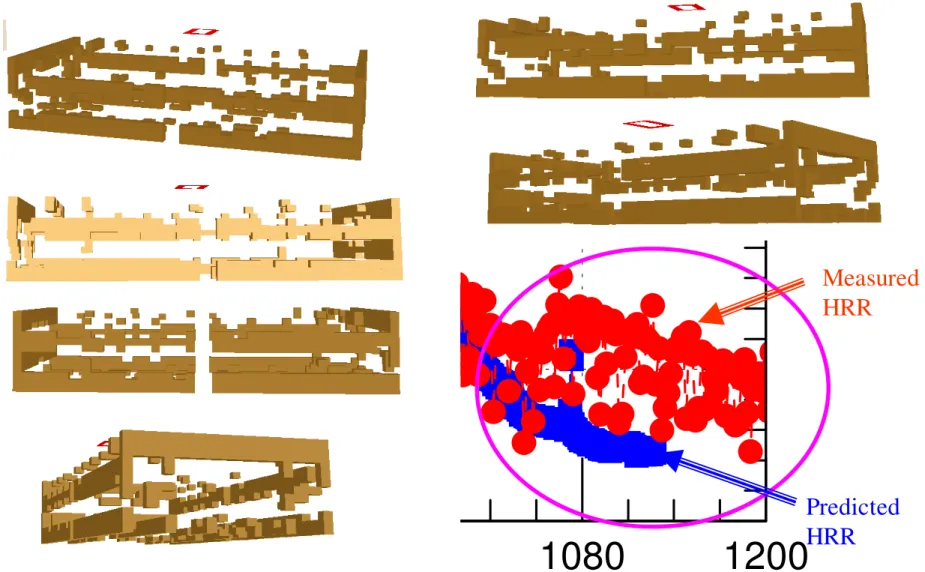
Figure 6-4 Status of the wood cribs at the end of simulation (time = 1130 s). ... 41
Figure 6-5 Locations of the TC trees. ... 42
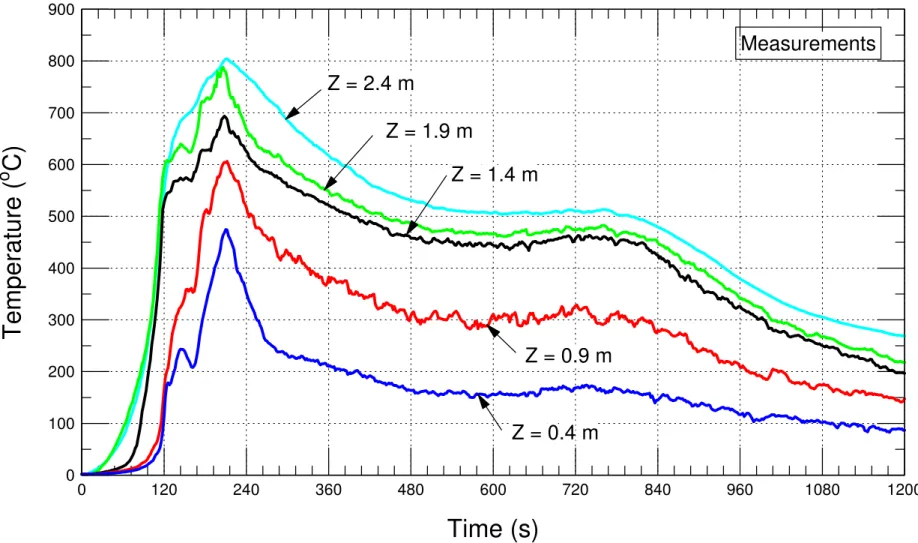
Figure 6-6 Average measured temperatures of the four trees (trees 1 – 4) at different elevations from the floor ... 44
Figure 6-7 Comparison between measured and predicted average temperatures of the four trees (trees 1 – 4) at Z = 0.4 m ... 45
Figure 6-8 Comparison between measured and predicted average temperatures of the four trees (trees 1 – 4) at Z = 0.9 m ... 46
Figure 6-9 Comparison between measured and predicted average temperatures of the four trees (trees 1 – 4) at Z = 1.4 m ... 47
Figure 6-10 Comparison between measured and predicted average temperatures of the four trees (trees 1 – 4) at Z = 1.9 m ... 48
Figure 6-11 Comparison between measured and predicted average temperatures of the four trees (trees 1 – 4) at Z = 2.4 m ... 49
Figure 9-1 Measured temperatures at different elevations from the floor for TC Tree 1 . 53 Figure 9-2 Comparison between the measured and predicted temperatures at elevation from floor of 0.4 m (Tree 1) ... 54
Figure 9-3 Comparison between the measured and predicted temperatures at elevation from floor of 0.9 m (Tree 1) ... 55
Figure 9-4 Comparison between the measured and predicted temperatures at elevation from floor of 1.4 m (Tree 1) ... 56
Figure 9-5 Comparison between the measured and predicted temperatures at elevation from floor of 1.9 m (Tree 1) ... 57
Figure 9-6 Comparison between the measured and predicted temperatures at elevation from floor of 2.4 m (Tree 1) ... 58 Figure 9-7 Measured temperatures at different elevations from the floor for TC Tree 2 . 59 Figure 9-8 Comparison between the measured and predicted temperatures at elevation from floor of 0.4 m (Tree 2) ... 60 Figure 9-9 Comparison between the measured and predicted temperatures at elevation from floor of 0.9 m (Tree 2) ... 61 Figure 9-10 Comparison between the measured and predicted temperatures at elevation from floor of 1.4 m (Tree 2) ... 62 Figure 9-11 Comparison between the measured and predicted temperatures at elevation from floor of 1.9 m (Tree 2) ... 63 Figure 9-12 Comparison between the measured and predicted temperatures at elevation from floor of 2.4 m (Tree 2) ... 64 Figure 9-13 Measured temperatures at different elevations from the floor for TC Tree 3 ... 65 Figure 9-14 Comparison between the measured and predicted temperatures at elevation from floor of 0.4 m (Tree 3) ... 66 Figure 9-15 Comparison between the measured and predicted temperatures at elevation from floor of 0.9 m (Tree 3) ... 67 Figure 9-16 Comparison between the measured and predicted temperatures at elevation from floor of 1.4 m (Tree 3) ... 68 Figure 9-17 Comparison between the measured and predicted temperatures at elevation from floor of 1.9 m (Tree 3) ... 69 Figure 9-18 Comparison between the measured and predicted temperatures at elevation from floor of 2.4 m (Tree 3) ... 70 Figure 9-19 Measured temperatures at different elevations from the floor for TC Tree 4 ... 71 Figure 9-20 Comparison between the measured and predicted temperatures at elevation from floor of 0.4 m (Tree 4) ... 72 Figure 9-21 Comparison between the measured and predicted temperatures at elevation from floor of 0.9 m (Tree 4) ... 73 Figure 9-22 Comparison between the measured and predicted temperatures at elevation from floor of 1.4 m (Tree 4) ... 74 Figure 9-23 Comparison between the measured and predicted temperatures at elevation from floor of 1.9 m (Tree 4) ... 75 Figure 9-24 Comparison between the measured and predicted temperatures at elevation from floor of 2.4 m (Tree 4) ... 76
List of Tables
Table 2-1 Density and Composition of a Number of Polyurethane Foams [3] ... 5 Table 2-2 Properties of Flexible Polyurethane Foams (Ohlemiller and Shields [3]) ... 6 Table 2-3 Temperature at the 1st and 2nd peaks of weight loss rate for different
polyurethane foam at heating rate of 5 oC/min in nitrogen [3] ... 8 Table 2-4 Average melting mass flux for various polyurethane foams at different incident radiant heat flux levels [3] ... 10 Table 6-1 Comparison of the predicted and measured average peak temperatures of the four TC trees ... 43
1.
Introduction
A room fire involving furnishings is a highly complex dynamic system. The important processes in the fire spread and growth include ignition, chemical degradation, shrinkage and phase change of thermoplastic objects (e.g.
gasification, melting, dripping, and liquid evaporation), charring, suppression, and heat transfer by conduction, convection and radiation. The types, dimensions and physical properties of furnishings and their arrangements in the fire compartment, dimensions of fire compartments and the thermal properties of the boundaries, and leakage and ventilation opening(s) all affect the fire dynamics. The fire loads in residential buildings consist of different furnishings made of many different types of materials such as wood, plastics, including polyurethane foams used in chairs and mattresses, thin solid sheets used in electronic housings and vinyl house siding, as well as fibers used in carpets and clothes. Thermoplastic objects that are
particularly relevant for residential occupancies are upholstered furniture and mattresses. The residential fire statistics show that many fatal residential fires begin with upholstered furniture and bed assemblies, all of which contain a large amount flammable polyurethane foam.
Most thermoplastic materials melt at elevated temperatures, making them easy to manufacture into products with different shapes. Different types of chemical
formulations and additives are used during the manufacturing process of thermoplastic materials to produce different products with different shapes. These add significant complexities for modeling the fire spread and growth, as thermoplastic products change their shapes, and then melt at high temperatures. Fire tests performed on thermoplastic materials confirmed some of these complex behaviors [1, 2, 3]. In order to model the fire behavior that involved thermoplastic materials, a better understanding of how these materials behave under fire is needed. Additionally, knowing the thermal properties as well as the kinetic parameters of the fire loads (e.g. flexible polyurethane foam and wood cribs that were used in this study) are important to predict fire spread and growth.
Kinetic Parameters
The derivation of kinetic parameters (activation energy,
E
, pre-exponential coefficient, , and reaction order, ) for fire loads from thermogravimetric analysis (TGA) obtained under non-isothermal conditions has received considerable attention by manyinvestigators in the last 50 years. Commonly, the reaction rate is a function of kinetic parameters and surface temperature of the decomposing material. It can be calculated using a combination of Arrhenius and power functions. For example, the reaction rate,
of the ith material component undergoing its jth reaction can be given as [
A
ijr
n 4-5]:(
)
[
]
tij ij s n ij thr s s ij ij n s i s s i s ijT
T
T
E
A
t
r
, , , 0 , 0 ,,
0
max
exp
⎟⎟
−
⎠
⎞
⎜⎜
⎝
⎛
ℜ
−
⎟⎟
⎠
⎞
⎜⎜
⎝
⎛
=
⎟⎟
⎠
⎞
⎜⎜
⎝
⎛
∂
∂
=
ρ
ρ
ρ
ρ
(1) where: i s,0
s
ρ
= initial density of material layer that consists of different material components (e.g. cellulose, hemicellulose, lignin and water in case of wood),ij
A
= pre-exponential factor, ijE
= Activation energy,ℜ = universal gas constant, s
T
= surface temperature, ijthr
T
, = an optional “threshold” temperature that allows the definition of non-Arrhenius pyrolysis functions and ignition criteria,ij t
n
, = temperature exponent, and ijs
n
, = mass fraction exponent or the reaction orderGenerally, the procedure of extracting the kinetic parameters consists of three steps, namely:
1. the choice of a suitable heterogeneous reaction mechanism, 2. the calculation of the apparent kinetic parameters (
E
,A
, n), and3. testing the kinetics parameters obtained above against the experimental data at several heating rates. This step will assure that the empirical description of the decomposition process at different heating rates comparable to those during combustion is suitable for the numerical model.
The kinetic parameters should provide the best fit to the entire experimental curve at different heating rates. Rogers and Ohlemiller [6] showed that it is impossible to obtain a unique set of kinetic parameters from a single TGA curve. This non-uniqueness of kinetic parameters for a single TGA curve may help to explain the great variation of activation energy parameters reported in the literature, especially when only
E
orE
andA
are given.The thermal decomposition of solid combustible materials proceeds according to a certain mechanism. More often, the degradation mechanism is a series of complex steps made up of competitive reactions (Eq. 2), independent reactions (Eq. 3), and/or consecutive reactions (Eq. 4). Additionally, the reaction steps in these three sequences may proceed by different rates. The different types of reaction sequences can be represented as follows:
(a) Competitive reactions
reactions of number , , , ... 2 2 2 2 1 1 1 1 = = = ⎪ ⎪ ⎩ ⎪ ⎪ ⎨ ⎧ + + + → S Solid G Gas N G x S y G x S y G x S y Solid Fuel i i N N N N (2)
where,
∑
and are the sum of mass fractions of fuel solid that left un-gasified (e.g. char), and gasified, respectively.= N i i y 1
∑
∑
= = − = N i i N i i y x 1 1 1 (b) Independent reactions(
)
(
)
(
N N)
N N N NFuel
Solid
y
S
f
y
G
f
G
y
f
S
y
Solid
Fuel
f
G
y
f
S
y
Solid
Fuel
f
−
+
→
−
+
→
−
+
→
...
2 2 2 2 2 2 1 1 1 1 1 1 , and1
(3) 1=
∑
= n i if
where,
∑
, and are the sum of the mass fractions of fuel solid that left un-gasified, and gasified, respectively.= N i i
y
1(
)
∑
∑
= =−
=
−
N i i N i i iy
y
f
1 11
(c) Consecutive reactions N N N N Ny
S
x
G
S
G
x
S
y
S
G
x
S
y
Soild
Fuel
+
→
+
→
+
→
−1 2 2 2 2 1 1 1 1 1...
(4)where,
∏
and are the mass fractions of fuel solid that left un-gasified and gasified, respectively. = N i iy
1∏
=−
N i iy
11
General unique methods for extracting the decomposition mechanism from TGA curves are not available. Trial and error of possible schemes can identify the decomposition mechanism and then obtain the kinetic parameters that match the experimental data at different heating rates. The decomposition mechanism of some types of polyurethane foams can be described by a sequence of two steps of consecutive reactions (see for example, Rogers and Ohlemiller [6]). For wood, however, the decomposition
mechanism becomes more complex where the reaction steps are a combination of the three types of reactions mentioned above (Eqs. 2, 3 and 4). The general decomposition mechanism of wood can be described as:
⎪
⎪
⎪
⎪
⎪
⎪
⎪
⎪
⎪
⎩
⎪
⎪
⎪
⎪
⎪
⎪
⎪
⎪
⎪
⎨
⎧
→
→
⎩
⎨
⎧
+
−
→
→
→
⎩
⎨
⎧
+
−
→
→
→
⎩
⎨
⎧
+
−
→
→
Vapor
Water
d
Virgin Woo
Gas
Fuel
Tar
Tar
Gas
Fuel
)
1
(
Lignin
Active
Cellulose
Active
d
Virgin Woo
Gas
Fuel
Tar
Tar
Gas
Fuel
)
1
(
ose
Hemicellul
Active
ose
Hemicellul
Active
d
Virgin Woo
Gas
Fuel
Tar
Tar
Gas
Fuel
)
1
(
Cellulose
Active
Cellulose
Active
d
Virgin Woo
w w l l l l h h h h c c c cy
y
x
Char
x
y
y
x
Char
x
y
y
x
Char
x
y
y
R13 R12 R11 R10 R9 R8 R7 R6 R5 R4 R3 R2 R1 (5)where: c
y
, , and are the mass fractions of Cellulose, Hemicellulose, Lignin, and Water, respectively, in the Virgin Wood ( + + + = 1), and hy
y
ly
wc
y
y
hy
ly
wc
x
, and are the mass fraction of solid that left un-gasified as Char due to decomposition of the Active Cellulose, Active Hemicellulose and Active Lignin, respectively.h
x
x
lA close examination for the degradation mechanism of wood (Eq. 5) indicates that the reaction steps R1, R5, R9 and R13 are a sequence of independent reactions. Each of these reaction steps except R13 leads to two steps of a sequence of competitive reactions, followed by a one step of consecutive reaction where tar is converted to fuel gas.
2.
Polyurethane Foams
Thermoplastics materials can be divided into three groups, namely: (a) high density materials, which are commonly used in consumer electronic devices (e.g. the outer case or shell of a TV set or a computer monitor, keyboard, speakers, etc), (b) low density materials, in particular, flexible polyurethane foam, which are used in soft cushioning (e.g. upholstered furnitures, car seats, mattresses, etc), and (c) rigid foams made from polyisocyanrate systems, which include some form of polyurethane and can also be called polyurethane foam, and are used in applications where dimensional stability over 100 oC is required (e.g. pipeline insulation).
Flexible polyurethane foam (PUF) is a class of materials, based on the reaction of an isocyanate with a polyol [3]. Commercial formulations of PUFs may contain as many as eight different ingredients, including isocyanate and polyol, blowing agents, surfactants and fire retardants. The nature of the polyol can be widely varied but typically for the applications of interest, it consists of a polyether based on ethylene and/or propylene oxide. The isocyanate is typically toluene diisocyanate but may also be methylene diphenyl diisocyanate. The thermal and kinetic properties of PUFs can be widely varied by adjusting the nature and proportions of these many ingredients. All of these in turn affect the fire behavior of PUFs.
Ohlemiller and Shields [3] investigated the melting behavior of different samples of foams of widely varying fire behavior. They obtained information about the flame retardant content for these samples from the Consumer Product Safety Commission. Table 2-1 lists the limited information available on these samples. Two viscoelastic foams (K Visco Foam and L Visco Foam) shown in Table 2-1 are popular in mattress applications.
In the present study, a non-flame retarded, polyurethane foam (NFR-PUF) was used as a part of the fire load in fire tests. The PUF has a density of 32.8 kg/m3 (greater than that used in the test by Ohlemiller and Shields,
ρ
= 23.2 kg/m3). In this project, fire tests were conducted on a number of mattresses made of different types of polyurethane foams. The results of these tests showed that the fire growth and spread were different from mattress to another [8].Table 2-1 Density and Composition of a Number of Polyurethane Foams [3]
Type of PUF Density
(kg/m3) Comments
NFR Foam 23.2 Non-Flame Retarded (NFR); standard mattress quality foam
Z0 FR Foam 22.4 6 % of bromine/phosphorus flame retardant Z” FR Foam 22.4 7 % of bromine phosphorus compound + ~3 % melamine K Visco Foam 43.2 Viscoelastic foam; no flame retardants
L Visco Foam 36.8 Viscoelastic foam; no flame retardants
P FR Foam 48.1 28 % melamine + ~3 % tris dichloro isopropyl phosphate Graphited
Foam* 56.0
Contains expandable graphite; gives positive qualitative test for presence of a halogen compound; aircraft rated * Passes the Federal Aviation Administration (FAA) kerosene burner test in the context of an aircraft seat
Review of Thermal Properties and Kinetic Parameters of
Polyurethane Foams
The combustion model in FDS consists of solid phase pyrolysis and gas phase combustion. The former refers to the generation of fuel gas at a solid surface (see Eqs. 2 – 4). The latter refers to the reaction of fuel gas and oxygen using a Mixture Fraction Combustion (MFC) model. A fire load consisting of different type of solid fuels (e.g. wood cribs + polyurethane foam) results in different types of gaseous fuels. However, the MFC model allows for specifying one gaseous fuel only. Additionally, the MFC model requires the chemical formula of the fuel gas. The chemical formula for polyurethane foam used in this study is CH1.91O0.263N0.055, which is the same as that used
by Takeda and Yung [20] and Yii [21] in their modeling of polyurethane fires inside a compartment. This chemical formula is needed to estimate the mass fractions of the combustion products within the fire compartment. Note that other polyurethane foams might have different chemical formulas. In this section, a review of the thermal proprieties and kinetic parameters of polyurethane foams are presented.
Thermal Properties of Polyurethane Foams
The heat of combustion of polyurethane foam depends on its type. Recently, Ohlemiller and Shields [3] obtained the heats of combustion of different types of polyurethane foams from cone calorimeter tests at a radiant heat flux of 35 kW/m2. The range of heats of combustion was 19 – 31 MJ/kg (Table 2-2).
Yii [21] used a heat of combustion equal 28.7 MJ/kg and heat of gasification and
evaporation temperature of 2,700 KJ/kg and 327oC, respectively. The type of foam and its density were not reported [21].
A range of heat of combustion of 21.8 – 27.2 MJ/kg and auto-ignition temperature of 181oC for polyurethane foam was reported in reference [26]. The heats of combustion and auto-ignition temperatures for other types of polyurethane (polyurethane rubber,
flexane 60, Kaye & McDonald compound #600, and Kaye & McDonald compound #700) are also available in reference [26]. In this reference, the range of auto-ignition
temperatures and heats of combustion for different types of polyurethane were 181 – 287oC and 21.8 – 28.5 MJ/kg, respectively.
Branca et al. [23] measured the heat of combustion of rigid polyurethane foam (
ρ
= 38.0 kg/m3) by conducting cone calorimeter tests at two radiation intensities.. Thecommercial name of the polyurethane foam was VORACOR (polyol C549 and
isocyanate CD526 with proportion 100/110, Dow Chemical Company). The measured heat of combustion of this foam was 14.7 MJ/kg and 16.6 MJ/kg at radiation heat fluxes of 25 and 50 kW/m2, respectively.
Table 2-2 Properties of Flexible Polyurethane Foams (Ohlemiller and Shields [3])
Type of PUF Density (kg/m3) Temperature at 2% of Weight Loss* (oC) Temperature Range of Foam Collapse& (oC) Heat of Combustion Variation@ (MJ/kg) NFR 23.2 227 295-312 25-31 Z0 FR Foam 22.4 198 287-306 19-31 Z” FR Foam 22.4 191 290-309 19-31 K Visco Foam 43.2 252 280-308 24-30 L Visco Foam 36.8 254 280-330 24-30 P FR Foam 48.1 204 270-284 25-30 Graphited Foam 56.0 209 272-285# 20-25 *
These temperatures can be roughly considered as a measure of onset of foam gasification.
&
In this range of temperature, the collapsed foam started to melt.
#
Graphite foam did not melt or collapse. This temperature range corresponded to that above which the graphite granules could be seen to expand.
@
Values are obtained from cone calorimeter tests at a radiant heat flux of 35 kW/m2 Dietenberger [27] conducted cone calorimeter test according to the procedure
prescribed by ISO 5660 to derive the thermal properties of fire-retardant-treated (FRT) polyurethane foam. The sample was 100 mm x 100 mm x 23 mm thick. The foam density of 29.0 kg/m3, moisture content of 0%, and surface emissivity of 0.68 were
measured prior to testing.
Two documented methods by Janssens [28] and Dietenberger [29] were applied using time to ignition measurements to derive the thermal inertia,
k
ρ
c
, thermal diffusivity,)
/(
c
k
ρ
, and ignition temperature,T
ign. Thek
ρ
c
andT
using Janssens's procedure were 0.033 kJ2/m4K2s and 272oC, respectively. While theign
c
k
ρ
,T
ign, and)
/(
c
k
ρ
using Dietenberger’s procedure were 0.028 kJ2/m4K2s, 416 oC and 4.91x10⁻⁷ m2/s, respectively.Kinetic Parameters of Polyurethane Foams
In this subsection, the kinetic parameters for a number of polyurethane foams are summarized. Commercial flexible polyurethane foams are most often prepared from tolylene diisocyanate (TDI, 80:20 mixture of 2,4- and 2,6-isomers), a polyether polyol, water, a blowing agent, catalysts, and a surfactant [6]. The kinetic properties of the foams are highly dependent on their compositions. Non-isothermal studies on the decomposition of a flexible polyurethane (tolylene diisocyanate - propylene oxide, TDI-PPO) in dry nitrogen showed a dependence of the kinetics parameters on the molecular weight of the polyol. For example, as the molecular weight of the polyol increases from 300 to 2700, the activation energy (E) and reaction order (n) decrease from
151.7 kJ/mole and 0.72 to 108.5 kJ/mole and 0.26 [15].
Putzeys et al. [24] considered a one-step Arrhenius-type reaction of the first order for the solid-to-gas conversion in smoldering open-celled, non-flame-retardant, flexible
polyurethane foam of density 26.5 kg/m3 and porosity 0.975. The activation energy, E, and the pre-exponential factor, A, were 22.0 kJ/mole and 0.136 s-1, respectively. Rein et al. [25] extracted the kinetic parameters of polyurethane foam using Genetic Algorithms as an optimization technique. A thermogravimetric experiment in inert atmosphere (100% nitrogen) was used to study the pyrolysis of the foam at a heating rate of 10oC/min. The experimental results showed that the degradation mechanism for this type of foam could be described by two consecutive reaction-paths (Eq. 4). The first reaction took place between 230 and 320oC. The second reaction occurred between 320 and 410oC. Only one pyrolysis reaction was considered and its kinetics parameters were set as a compromise solution between the two reaction paths to approximate the thermogravimetric behavior in nitrogen as follows [25]:
Gas
Char
Foam
→
α
+
β
,where:
A = 2.0E15 s-1, E = 200.0 kJ/mole,
α
= 0.05,β
=0.95, n = 3.0 and ΔhR (heat of reaction/gasification) = 775.0 kJ/kg.Rogers and Ohlemiller [6] obtained the kinetic parameters for foam prepared from an 80:20 TDI mixture and a trifunctional polyol according to the following recipe:
propoxylated trio1 (3000 MW) Silicone surfactant (L-540), Bis-dimethylaminoethyl ether (Al), Water, Stannous octoate, and Tolylene diisocyanate (80:20 mixture of 2,4/2,6-isomers) with parts by weight of 100, 1, 0.1, 5.0, 0.30, 59.9, respectively. Two constant heating rates of 2.15 and 22.3oC/min in nitrogen were considered to obtain the kinetic parameters. The TGA curves for thermal decomposition showed that the decomposition took place in two overall steps. The first step in the thermal decomposition of the
polyurethane foam was the break-up of the urethane-urea blocks leading to collapse of the cellular structure. At the completion of this step, the cellular structure was
transformed to a tarry, viscous liquid. In the second step, the more stable polyol
segment decomposed. These two steps of the reaction mechanism are represented by a consecutive reaction sequence as following:
1 1 1 1 Solid yGas x Foam→ + , R1
with E = 217.88 kJ/mole, A = 3.4E19 min-1, x
2 2 2
1 x Residual y Gas
Solid → + , R2
with E = 163.41 kJ/mole, A = 6.8E12 min-1, x2 ~0.03, y2 = 0.97.
Rein et al. [22] obtained kinetic parameters of polyurethane foam of density of 26.4 kg/m3 using a Genetic Algorithm. Two consecutive reactions (Eq. 4) were considered as following:
Gas
Foam
Foam
→
ν
β,pβ
−
+
ν
g,p , R1with A = 2.0E11 s-1, E = 148 kJ/mole, n = 0.21,
ν
β,p = 0.70 andν
g ,p = 0.30.Gas
Char
Foam
ν
cpβν
g pββ
−
→
,+
, , R2with A = 1.585E8 s-1, E = 124 kJ/mole, n = 1.14,
ν
c,pβ = 0.05 andν
g ,pβ = 0.95.In the above global mechanism, the first pyrolysis reaction (R1) represents the scission of the polyol-isocyanate bond, and the
β
-foam corresponds to the less-volatile polyol left behind. The polyol further pyrolyzes by the consecutive reaction R2.Branca et al. [23] obtained the kinetic parameters for rigid polyurethane foam with the commercial name VORACOR (polyol C549 and isocyanate CD526 with proportion 100/110, Dow Chemical Company). The apparent density of this foam was 38.0 kg/m3. The kinetic parameters were estimated by the simultaneous evaluations of four weight loss curves measured at heating rates of 5, 10, 15 and 20oC/min in air. The degradation mechanism for this type of foam was described by three consecutive reactions (Eq. 4) as follows: 1 1 1 1 Solid Gas Foam→
α
+β
, R1with A = 2.55E12 s-1, E = 133.6 kJ/mole, n = 1.0,
α
1 = 0.94 andβ
1 = 0.06,2 2 2 2 1 Solid Gas Solid →
α
+β
, R2with A = 3.26E4 s-1, E = 81.0 kJ/mole, n = 1.0,
α
2 = 0.50 andβ
2 = 0.50,3
2
Gas
Solid
→
R3with A = 8.70E8 s-1, E = 180.0 kJ/mole, n = 1.0.
Table 2-3 Temperature at the 1st and 2nd peaks of weight loss rate for different polyurethane foam at heating rate of 5 oC/min in nitrogen [3]
Type of PUF Density (kg/m3) Temperature at 1st Mass Loss Peak Temperature at 2nd Mass Loss Peak (oC) (oC) NFR Foam 23.2 281 360 Z0 FR Foam 22.4 281 362 Z” FR Foam 22.4 283 354 K Visco Foam 43.2 277 377 L Visco Foam 36.8 292 384 P FR Foam 48.1 260 359 Graphited Foam 56.0 250 374
Recently, Ohlemiller and Shields [3] conducted a Thermogravimetric scan of the five types of polyurethane foam listed in Table 2-3 under a single heating rate of 5oC/min in nitrogen. Their results indicated that there were two principal peaks of the weight loss rate of these foams. The first peak was due to the loss of isocyanate-related moieties. While, the second peak was due to the gasification of the polyol. Table 2-3 lists the temperatures at the first and second peak mass losses. Approximately about 1/3 of mass lost was due to gasification of the isocyanate-related species and 2/3 of mass lost was due to the more thermally stable polyol. The decomposition mechanism of these foams may be presented by a sequence of two steps of consecutive reactions (Eq. 4). The kinetic parameters of these foams were not derived since the thermogravimetric scan were conducted at only one heating rate of (5oC/min).
Melting and Boiling Phenomena of Polyurethane Foams
The melt from polyurethane foam is the result of extensive polymer degradation. At elevated temperatures, some foams melt (e.g. non-flame retarded foam, NFR) and some other foams don’t melt (e.g. graphited foam) (Table 2-4). The foam is originally a cross-linked polymer where its molecular weight is effectively infinite and it cannot flow. These cross-links must be broken before any flow can occur. The cross-links take several forms and the proportions depend on the particular foam formulation. They include urethane, urea, biuret and allophanate bonds [3]. The last two types of bonds are the weakest links in the polyurethane network. The dissociation of biuret and allophanate bonds generally takes place at temperature above ~110oC and these bonds are completely dissociated at ~ 170 oC [1]. Next in terms of thermal stability are the
urethanes, closely followed by ureas, with the isocyanurate group being the most stable of these nitrogen-containing derivatives. The urethane and then the urea bonds begin to break at temperatures over 200ºC by several routes, one of which (de-polymerization) can regenerate the isocyanate and active hydroxyl group on the original polyol. The polyol itself, which typically is based on polymers of either ethylene oxide or propylene oxide (or co-polymers of both), degrades only at substantially higher temperatures, reported to be up to 375 ºC [2]. As a result of this dichotomy in ease of bond breakages (which leads to the separate weight loss peaks in the thermogravimetry measurements), one expects the “melt” from flexible polyurethane foam to be dominated by largely intact polyol [3].
A further increase of the melt temperature can cause boiling of this melt. When Ohlemiller and Shields [3] measured the viscosity of the melt at different temperatures for different types of foams (to obtain viscosity-temperature relationships) using Paar-Physica Model UDS 200 rheometer, the following observations were made:
• At lower temperatures, the melt exhibited non-Newtonian flow behavior. This flow behavior was characterized by the dependence of the shear stress to their effective melt viscosity.
• At higher temperatures, the melts became more nearly Newtonian (viscosity is independent of the shear stress).
• Breakage of urethane bonds on a cross-link generated toluene diisocyanate (TDI) that boiled at about 250 ºC. The TDI would normally tend to escape from the liquid phase; and then was consumed in the vapor phase via reaction with amines generated during the polymer degradation.
• A few bubbles were generated as the temperature increased but serious bubbling that would definitely affect the viscosity measurement was delayed to well over 300 ºC. This presumably reflected accelerating degradation of the polyol.
Another observation on the melt of polyurethane foams by Ohlemiller and Shields [3] was that the melt was frequently seen to be bubbling, especially in the flaming areas. The flow behavior of a two-phase fluid like this remains an area in need of further investigation.
In summary, due to the complexity of the composition of the melt of polyurethane foams particularly at high temperature, and based on the above observations by Ohlemiller and Shields [3], the boiling temperature of the melt is not well defined. However, in terms of the modeling point of view, the boiling temperature can be assumed to be in the range from 250 – 300oC. Note that the boiling temperature is one of the key parameters that affect the evaporation rate from the melt and then the fire spread and growth as briefly explained below.
Table 2-4 Average melting mass flux for various polyurethane foams at different incident radiant heat flux levels [3]
Type of PUF Density Mass Lost as Melt$
γ
(%)Melting Mass Flux in g/(m2.s)
(kg/m3) at 40 kW/m2 at 30 kW/m2 at 20 kW/m2 NFR Foam 23.2 17 20.0 --- --- Z0 FR Foam 22.4 35-37 45.7 38.9 --- Z” FR Foam 22.4 39-44 55.7 40.0 --- K Visco Foam 43.2 75-76 84.8 56.0 --- L Visco Foam 36.8 89 121.1 110.4 --- P FR Foam 48.1 84 140.9 98.3 58.6 Graphited Foam 56.0 0 0 0 0 $
These values were measured at incident radiant heat flux of 40 kW/m2 in air, in the case of non-flaming. It was reported that this heat flux is more relevant to what one could expect in flaming combustion [3].
The rate at which liquid fuel evaporates when burning is a function of the liquid surface temperature and the concentration of fuel vapor above the liquid surface. According to the Clausius-Clapeyron relation, the volume fraction of the fuel vapor above the liquid surface, is a function of the liquid surface temperature, , and boiling temperature,
as following: f
X
T
s bT
⎟
⎟
⎠
⎞
⎜
⎜
⎝
⎛
⎟⎟
⎠
⎞
⎜⎜
⎝
⎛
−
ℜ
−
=
b s f v fT
T
W
h
X
exp
1
1
(6) where: vf
W
= molecular weight, andℜ = universal gas constant.
In FDS version 5, the liquid fuel itself was treated as a thermally-thick solid for the purpose of calculating the heat conduction through it, and the convection of the liquid within the liquid was neglected. One of the key parameters that can affect the liquid surface temperature ( ) and in turn the evaporation rate (see Eq. 6) is the liquid absorption coefficient,
s
T
κ
(see the next subsection for more details).Table 2-4 and Figure 2-1 show the melting mass flux from a foam sample of size of 25 mm x 25 mm. In Figure 2-1, the upper graph shows the measured melting mass flux, while the lower graph shows the average melting mass flux for different polyurethane foams at different incident radiant heat fluxes. As shown in Figure 2-1, for the same incident radiant heat flux, NFR foam that is being used in standard mattresses has the lowest melting mass flux. While, both the P FR foam and L Visco foam have the highest melting mass fluxes. The melting mass flux for Z0 FR foam was approximately the same as that for Z” FR foam. The two viscoelastic foams, K Visco Foam and L Visco Foam, are becoming increasingly popular in mattress applications. The former has a lower melting mass flux than that for the latter. The third column in Table 2-4 lists the percent of mass loss as a flaming melt,
γ
, for the different types of foams at incident radiant heat flux of 40 kW/m2 in air. As will be shown in Section 4, the values ofγ
can have a significant effect on fire spread and growth.0 25 50 75 100 125 150 15 20 25 30 35 40 45
P FR Foam
L Visco Foam
K Visco Foam
Z” FR Foam
Z0 FR Foam
NFR Foam
Sample Size = 25 mm x 25 mmM
e
lting Mass Flux (g/(m
2
.s
)
0 25 50 75 100 125 150 15 20 25 30 35 40 45P FR Foam
L Visco Foam
K Visco Foam
Z” FR Foam
Z0 FR Foam
NFR Foam
Sample Size = 25 mm x 25 mmIncident Radiant Heat Flux (kW/m
2)
Aver
age M
e
lt
ing M
a
ss Flux (
g
/(
m
2.s
)
Figure 2-1 Melting mass flux from sample of Size of 25 mm x 25 mm for various polyurethane foams at three incident radiant heat fluxes [3]
Absorption Coefficient of Solids or Liquids
The radiation intensity inside a solid (or liquid) can be described as follows:
(
I
x
I
bdx
x
dI
−
−
=
(
)
)
(
κ
)
(7) x Front, Io Back, Ib Radiation Intensity, Io I(x) x Front, Io Back, Ib Radiation Intensity, Io I(x) where:x = distance from the surface of solid or liquid,
b
I
= radiation intensity at the back surface of solid or liquid, andκ
= absorption coefficient. This coefficient is a measure of the radiation absorption in a solid or liquid. Eq. (7) is subjected to the boundary condition of. The solution of this equation is given as: o
I
x
I
(
= )
0
=
] exp[ ) ( x I I I x I b o b = − ⋅ − −κ
(8) 0 0.2 0.4 0.6 0.8 1.0 10-6 10-4 10-2 100 κ = 1 m-1 κ = 10 m-1 κ = 100 m-1 κ = 1,000 m-1 κ = 10,000 m-1 κ = 100,000 m-1Distance from the surface, x (m)
Fr ac ti o n o f i n ci d ent r a d iati on at d ist anc e x m e as ur ed from the s u rface
Figure 2-2 Dependence of the fraction of incident radiation on absorption coefficient, κ A graphical presentation of Eq. (8) for different values of the absorption coefficients is shown in Figure 2-2. As shown in this figure, increasing the absorption coefficient results in the incident radiation heat flux being absorbed in a thin layer of the solid or liquid. For example, a thin layer of thickness of ~1 mm can completely absorb the
incident radiation heat flux for a material that has an absorption coefficient of 10,000 m-1 compared to a thick layer of thickness of ~10 mm for a material with an absorption coefficient of 1,000 m-1. Therefore, a liquid with a larger absorption coefficient will have a higher surface temperature than that for a liquid with smaller absorption coefficient. Consequently, the evaporation rate from a liquid surface (see Eq. 6) of a material of larger absorption coefficient is higher than that for material of lower absorption coefficient. As such, the absorption coefficient of liquid can significantly affect the burning rate.
The absorption coefficient for solids and liquids need to be determined experimentally. Recently, Ohlemiller and Shields [3] carried out a measurement of radiation penetration on full density thermoplastics (PD702N & PP6523 polypropylene resin (
ρ
= 900 kg/m3), and PS663 & PS666D polystyrene resin (ρ
= 1040 kg/m3)) in order to obtain thein-depth absorption coefficient of these materials (see Figure 2-3). These measurements were conducted using a cone calorimeter with a cone heater temperature of ~680oC that provided an incident heat flux of 30 kW/m2 to the surface of the samples. All samples were prepared by hot pressing the polymer beads.
0.2 0.4 0.6 0.8 1.0 0 1 2 3 4 5 6
PS666D polystyrene
PS663 polystyrene
PP6523 polypropylene
PD702N polypropylene
Thickness (mm)
Fr
ac
ti
on of i
n
c
ident radi
ati
o
n at i
n
c
ident depth
Figure 2-3 Fraction of incident radiation at different depths of full density thermoplastics [3]
Figure 2-3 shows the fraction of incident radiation at different depths of full density thermoplastics. As shown in this figure, the absorption curves for the two
Polyurethane foams are a class of thermoplastics with low density (
ρ
~ 18 – 60 kg/m3). As mentioned earlier, the thermal degradation of the polyurethane foams at elevated temperature resulted in forming a melt of high density. The question is “will the absorption curves of different types of melts of polyurethane foams be comparable or similar to that of full density thermoplastic shown in Figure 2-3?” Answering this question, however, requires a direct measurement of radiation penetration in the polyurethane melt using a technique similar to that used by Ohlemiller and Shields [3]. In this work, a value for the absorption coefficient for the melt of polyurethane foam close to that of full density thermoplastics was assumed.3.
Observations on the Burning Behavior of PUF and
Wood Cribs
Most thermoplastic materials (especially those that melt at elevated temperature) have extra complexity when they burn in the context of the products in which they are found. In this section, some of the complexities of the burning behavior of polyurethane foams are discussed. Figure 3-1 shows a number of snapshots at different time showing the fire behavior during the burning of a mock-up sofa (NFR-PUF) and two wood cribs underneath it in the different fire stages (ignition, growth and spread, fully-developed and decay).
A square 19 kW propane burner was used for 90 s to initiate the fire. When the burner heated a segment of the top surface of the seat cushion (virgin NFR-PUF), a portion of solid virgin foam gasified forming a fuel gas according to Arrhenius equation. The rate of the formed fuel gas depends on the kinetic properties (activation energy, pre-exponential factor, reaction order and the local surface temperature of the foam, see Eq. 1).
After ignition, the flame starts to grow and spread on the foam surface forming a larger flame, which produced by both the propane burner and burning foam. The foam cell structure that is touched by the flame (typically, portion of the top horizontal surface of the seat cushion underneath of the flame, and portion of the vertical surface of backrest) collapsed yielding a smaller volume of “melt or liquid” with high density. Both the
location of the burner and its heat release rate play an important role in the rate of fire growth and spread. For example, the rate of fire growth when the burner is placed on the top surface of the seat cushion would be different than that when the burner is placed on the vertical surface of the backrest.
As the heating continued, the local temperature of the burning foam increases resulting in forming more fuel gas due to evaporating a portion of the formed melt. The
evaporation rate from the melt depends on: (1) the melt thermal properties (boiling temperature, thermal conductivity, specific heat, molecular weight, latent heat of vaporization, and the thermal absorption coefficient) and (2) the melt surface
temperature. The total rate of forming fuel gas is mainly the sum of those produced due to (a) the direct solid – gas conversion, which depends on the foam kinetic properties, and (b) evaporation from the melt.
The non-evaporated portion of the melt accumulates on the foam cell structure at the top of the burning seat cushion, and the vertical surface of the backrest. This portion of the melt would wet the foam surface and be pulled into the foam structure by capillary
forces, disappearing below the surface of the seat cushion, and sliding on the vertical surface of the backrest. Note that the hydraulic resistance of the melt on the vertical surface of the backrest would be roughly 50% of that formed on top layer of the seat cushion. The density, surface tension coefficient and the viscosity of the melt as well as the foam porosity (i.e. pore radius, which depends on the density of the virgin foam) are the key parameters that control the penetration of the melt through the foam cell
structure. Furthermore, the local melt temperature can affect the penetration of melt through the foam (note that both the surface tension coefficient and viscosity of the melt depend on its temperature).
Recently, Ohlemiller and Shields [3] measured the melt viscosity at different
temperatures for some thermoplastic materials (full density PP6523 Polypropylene & PS666D polystyrene, and low density polyurethane foams listed in Table 2-1). They indicated that the melt viscosity,
μ
, is dependent not only on its temperature but also on the type of melt (μ
can vary by several orders of magnitude).
(a) (b) (c)
(d) (e) (f)
(g) (h) (i)
Figure 3-1 Snapshots for the fire behaviour during burning the fire load (sofa and two wood cribs underneath it) in the different fire stages
Sliding melt in
the form of liquid
rivulet
Liquid pool fire
Figure 3-2 Enlargement of the snapshot in Figure 3-1c showing melt sliding downwards and liquid pool fire
In the early stage of fire growth on the foam (liquid pool fire underneath the foam has not been formed yet), the temperature of the layer of the foam through which the melt is accumulating/penetrating is lower than the melting temperature. The temperature of the melt may decrease due to (a) the thermal equilibrium between the melt and this layer, and (b) losing heat (corresponding to the latent heat of evaporation) as a result of the surface evaporation from the melt. As such, the melt viscosity increases making it difficult for the gravity force to overcome both the capillary and viscous forces. This would cause the melt to stick in this layer of the foam as shown in Figure 3-1b until the melt droplets grow by agglomeration with their neighbors and with more droplets being formed by the local collapse of the foam surface as the heating continues to melt and gasify the foam. When the amount of the accumulated melt becomes large enough so that the gravity force can overcome both the capillary and viscous forces, the melt can run downward and eventually leave the foam forming a liquid pool fire as shown in Figure 3-2.
Based on the visual observations by Ohlemiller and Shields [3] for the melt of
polyurethane foams listed in Table 2-1, the size of melt droplets appeared to be roughly 3 mm. Additionally, when the burning surface of the foam was vertical, they observed liquid rivulets, which flowed on a very uneven surface consisting of the partially and fully collapsed foam cells (the cells in most of these foams were on the order of 0.5 mm in
diameter). These liquid rivulets were also observed on the vertical surfaces of the foam in the present test (see Figure 3-2).
800 38 11 4.4 35 6 38 114.4 800 All dimensions in mm 89
W
oo
d
Cr
ib
4throw 3rdrow 2ndrow 1strow 89 800 38 11 4.4 35 6 38 114.4 800 All dimensions in mm 89W
oo
d
Cr
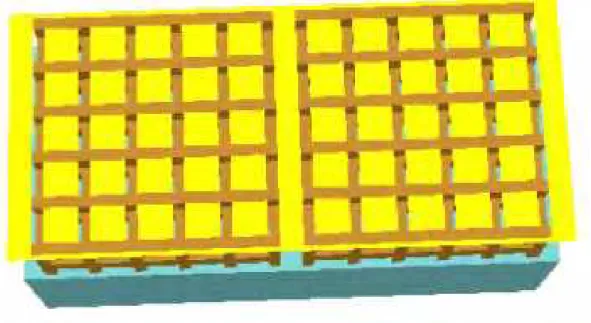
ib
4throw 3rdrow 2ndrow 1strow 89Figure 3-3 Horizontal catch surfaces of the melt on the floor and wood The melt formed during thermal degradation of the foam flows downward under the effect of gravity. Because this melt is burning, it extends the flaming zone on the solid downward onto whatever surfaces are available to catch the burning melt. As shown in Figure 3-3, the surface areas that can catch the burning melt in the present test include patches of the following:
(a) Floor area of the spacing between the wood pieces (FHA),
(b) Top surface area of the wood pieces in the 4th row of the crib (WHA1),
(c) Top surface area of the wood pieces in the 3rd row (excluding the contact areas between the 4th and 3rd rows of the crib) (WHA2), and.
(d) Side areas of all wood pieces (WVA).
Note that the surface areas FHA, WHA1 and WHA2 listed above are horizontal, while the surface areas WVA are vertical. The burning melt that collects on the surface areas FHA, WHA1 and WHA2 is mainly due to a direct dripping of the melt from the foam. However, the burning melt that collects on the surface areas WVA is due to forming liquid rivulets that flow downward under the effect of gravity on these surfaces. The burning/flaming liquid rivulets on the surfaces of the wood would heat up the wood surface. When the wood surface temperature reaches its ignition temperature, the wood becomes involved in the burning, resulting in an increase of the flaming zone.
Eventually, the rate of change of these surface areas as well as the melt flow behavior on these surfaces depends on the following:
(a) The characteristics of thermal degradation of the foam. In other words, the fraction of the foam that can be converted to liquid during burning. As shown in Table 2-4, some foam has a higher melt fraction (
γ
) than others.(b) The density, surface tension coefficient and viscosity of the melt.
(c) The equilibrium contact angle (
θ
cont) of the melt on the catch surfaces. For the same type of liquid,θ
contchanges from one surface to another. In the fire test,cont
θ
of the melt on the floor surface would be different than that on the surface of the wood. Note that the equilibrium contact angle is a measure of the wettability/ spreadability of a liquid/melt on a surface. For example, a smallerθ
cont means a melt has higher wettability than that for largerθ
cont. Additionally,θ
cont affects the flow characteristics of the melt rivulets on the wood surface and wet patches on the floor. More details about the different effects ofθ
cont on the flow behavior of liquid rivulets are available in [30, 31 and 32].(d) The evaporation rate from the surfaces of the melt. The different parameters that affect the evaporation rate are explained earlier.
(e) Thermal feedback from the burning melt on the catch surfaces. This would cause a “pre-heating” of the lower surface of the virgin foam as the thermal wave approaches the bottom boundary of the foam so that the melt can stay at a temperature high enough to pass through the hot foam layer. The parameters that can affect this thermal feedback include the emissivity and radiation view factor of the surface of the virgin foam as well as the size of the flaming zone on the catch surfaces. More details on the effect of the thermal feedback from the burning melt on the fire spread and growth is provided in the Section 4
In the later stage of fire growth, as the melting rate increases due to an increase in the flaming zone, the surface areas covered by melt on both the floor and wood increase. As such, a liquid pool fire under both the remaining portion of the foam and the wood cribs is formed. The fire plume due to the pool fire can reach the surfaces of the foam and wood close to it resulting in an increase in the melting rate on the bottom surface of the foam. In turn, this increases the size of the pool fire, resulting in a further increase of the melt flow rate to the pool (see Figure 3-1d and e). As a result, this extends the surface areas of fuel (on both the foam and wood) that are burning and thus increasing the overall heat release rate. This will potentially lead to an exponential fire growth as will be shown in Section 4.
As explained above, the flame spread on the fire load consisting of NFR-PUF sofa and two wood cribs underneath it is quite complicated. The thermoplastic materials gasify and melt at elevated temperatures. Also these materials, especially low-density class (e.g. polyurethane foams) tend to deform significantly as they burn. Thus large changes in the geometric shape of the burning object are common. These two aspects of
thermoplastics (melt and large deformation) make modeling fire growth on them, or on objects containing them, very difficult.
Some of the available fire models are based on empirical determination of the heat release rate from ignited objects, usually obtained from small-scale or medium-scale fire tests. Also, these models are based on a number of assumptions (e.g. non-moving mesh, 1-D heat conduction through all solids in the computational domain, etc). The standard finite difference and finite element methods are limited in their ability to
simulate: (a) large changes in shapes that accompany the burning of thermoplastic objects, (b) the behavior of flow of melt. A breakthrough in numerical modeling
techniques is needed. Mesh-free and mesh adaptation methods may provide the next step in modeling capability.
4.
Parametric Analyses to Investigate the Effect of
Liquid Pool Fire on Fire Spread and Growth
As indicated earlier, due to the thermal degradation of the polyurethane sofa at elevated temperatures, a flaming melt is formed and collected on the floor and wood catch
surfaces underneath the sofa. This melt forms a pool fire with the fire plume growing to the point where it reaches the bottom surface of the sofa and thus considerably
increases the melt flow rate to itself, resulting in an exponential growth in fire size. This is the situation when the catch surfaces are close to the bottom surface of the sofa. Ohlemiller and Shields [3] called a situation like this “a self-feeding pool fire”.
Pool fire with equivalent diameter = dp
Floor
Hb= Height of bottom surface of sofa above the floor
melt
Pool fire with equivalent diameter = dp
Floor
Hb= Height of bottom surface of sofa above the floor
melt
Figure 4-1 Forming unconfined liquid pool fire due to melting the polyurethane sofa Furthermore, as the pool fire plume hits the bottom surface of the sofa, it tends to regress away from the impinging pool fire plume while it feeds melt to the liquid pool. This can mitigate the self-feeding tendency to a certain degree. The self-feeding pool
![Figure 2-3 Fraction of incident radiation at different depths of full density thermoplastics [3]](https://thumb-eu.123doks.com/thumbv2/123doknet/14147917.471432/25.918.151.776.459.929/figure-fraction-incident-radiation-different-depths-density-thermoplastics.webp)