Beating the System: Accelerating Commercialization of New
Materials
by
Christopher Scott Musso
B.S., Manufacturing Engineering Technology Brigham Young University, 2000 S.M., Technology and Public Policy Massachusetts Institute of Technology, 2002
S.M., Materials Science
Massachusetts Institute of Technology, 2003 M.B.A., Sloan School of Management Massachusetts Institute of Technology, 2003
MASSACHUSETTS INSTTE
OF TECHNOLOGY
DEC 2 I 2004 LIBRARIES
Submitted to the Engineering Systems Division in Partial Fulfillment of the Requirements for the Degree of Doctor of Philosophy in Technology, Management, and Policy
at the
Massachusetts Institute of Technology February 2005
C2004 Christopher S. Musso All rights reserved.
The author hereby grants to MIT permission to reproduce and to distribute publicly paper and electronic copies of this thesis document in wholeor ip"t.'.
Signature of Author ... ,. I--p v-J ... Certified by ... Certified by ... ( ' -Engi!iensngystems Division -,J December 13, 2004
...
, ...
.
a/ Thomas W. Eagar Thomas Lord Professor of Materials Engineeringetid Engineering Systemsr) ,_ _ Thesis Supervisor
Clayton Christensen
I Robeo-and Jean Cizik P6feyaor ofBusinesdministration
HlH/ ,00( usiness School
A/
4~\
/(
V/
/'JoA{Cutcl>$rershenfield ASe rRes h cientist, avio icy Science
II / X Slf S 1 Management
Certified by ... ...
td// David
Mindell
Francis and David Dibner Associate Professor of the History of Engineering and Manufacturing Program in Science, Technology, and Society
Accepted
by
.. ...
... ....
. ...
...
...
Richard de Neufville
/ Professor of Engineering Systems
This page intentionally left blank
Beating the System: Accelerating Commercialization of New
Materials
By
Christopher Scott Musso
Submitted to the Engineering Systems Division in Partial Fulfillment of the Requirements for the Degree of Doctor of Philosophy in Technology, Management, and Policy
Abstract
Over the past century, materials have faced notoriously long delays between invention and commercialization. These delays make private investment very difficult, and can prevent good materials from reaching markets. A systematic exploration of the
commercial histories of major commodity thermoplastics was performed, which showed that these delays were attributable to technical deficiencies in materials and obstacles in the application value chains. Contrary to popular wisdom, material costs, competitive materials, and serendipity were much smaller factors in commercialization delay. The
factors that led to insertion of plastics into applications were different from the factors that led to post-insertion growth.
The major plastics showed a characteristic pattern of commercialization. First, they entered simple, small applications in which they solved new problems. They then progressed to achieve insertion in a single major application, which they continue to dominate today. Having established themselves with this application, they found insertion in a wide range of large applications.
The commercialization pattern can be explained in large part by the concept of switching costs. As knowledge of a material increases, switching costs are reduced; as value chain complexity increases, switching costs increase. The earliest applications required little understanding of plastics and had simple value chains, so switching costs were low, corresponding to fast commercialization. Later applications had more complex value chains and required much more detailed understanding of the failure modes and processing parameters of the material, corresponding to high switching costs and slow commercialization.
Materials can be deployed into many markets. By strategically selecting application markets, materials producers can significantly improve the probability that new materials will be adopted and can shorten the period of commercialization. Early markets should be selected based on the ability of the material to solve unique problems and the
simplicity of the application value chain. When market selection is not an option,
materials producers can integrate forward in the value chain to shorten commercialization times, but capital requirements are very high.
Once integrated into an application, the safest competitive position for materials is to be the lowest cost option that meets the exact needs of the application.
Thesis Supervisor: Thomas W. Eagar
Table of Contents
Abstract ... 3 Table of Contents ... 5 Table of Figures ... 9 Table of Tables ... 11 Acknowledgements ... 13Chapter 1: Beating the System ... 15
Motivation
...
... ...
15
Materials Come Early in the Value Chain ... ... 18
Materials are Difficult to Change ... 20
Materials are Versatile ... 21
Materials are Functionally Fungible ... 22
Conclusion ... 22
Chapter 2: Review and Commentary of Relevant Literature on Materials Commercialization... 25
Introduction. ... 25
Understanding the Business Side of Materials Commercialization . ... 25
The Technology Transfer Model ... ... 25
Risk Factors in New Materials ... 26
Capital Implications of the 20 Year Challenge ... 28
Traditional Materials Marketing Wisdom ... ... 29
Large Initial Markets ... 29
Substitution Based on Superior Value ... 29
A Special Focus on Lower Cost ... 31
The IMM: An Excellent Application of Traditional Materials Marketing Wisdom 32 IMM: Viability Assessment ... 32
IMM Market Assessment ... 33
IMM Value Capture Assessment ... 33
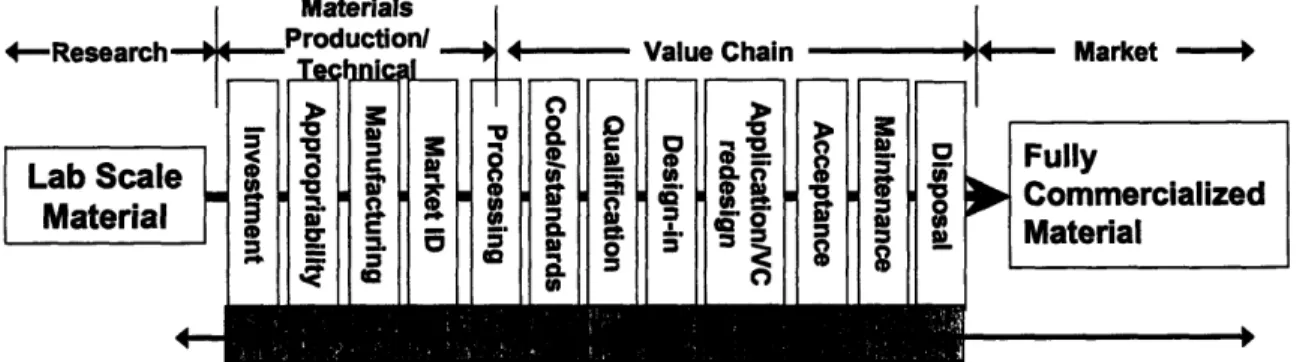
Obstacles to Commercialization of Materials ... 34
Materials Production/Technical Obstacles ... ... 35
Value Chain Obstacles ... 35
Applicable General Innovation Theories ... 38
The Dominant Design Model ... 38
Standards and Externalities ... 39
Disruptive Technologies ... 40
Conclusion ... 42
Chapter 3: The Pattern of Materials Commercialization ... 45
Introduction... 45
Plastics Industry Data ... 47
Dataset: Biggest Plastics Applications of 1998 ... ... 48
Understanding Volume in Plastics ... 49
Is Compelling Value Proposition Enough for Quick Insertion? ... 52
Uniform Quick Insertion ... 53
Did First Applications Get Big? ... 54
Correlation Between Sales and Insertion ... 54
The Enabler Phase: Establishing Credibility ... 55
Polyurethane in Foam Stuffed Tubbable Toys ... 58
Acrylic (PMMA) in Highway Reflectors ... 59
Enabler Phase Applications Establish Credibility ... 60
Platform Applications: the Path to Further Growth ... 60
HDPE Detergent Bottles ... 62
Platforms are Key to Commercial Success ... 64
The Widespread Substitution Phase: Realm of Traditional Materials Marketing ... 65
Washing Machine Agitators: a Race to the Bottom . ... 66
Conclusion ... 68
Chapter 4: Insertion Factors ... 71
Introduction... 71
Insertion Factors ... 71
Materials Serendipity ... 72
Plastics Were Too Expensive to be Attractive ... 74
Value Chain Obstacles or Technical Deficiencies Delayed Insertion ... 78
Testing the Effects of Value Chain Obstacles and Technical Deficiencies ... 80
Adding Resolution to the Commercialization Pattern ... 86
Microcool Technology, LLC" ... ... 87
Nanomagnetics" ... 90
Selectech ... 93
Conclusions and Contributions ... 97
Chapter 5: The Effects of Value Chain Complexity ... 101
Introduction ... 101
Approach... 102
Historical Data ... 102
Value Chain Complexity Measures ... 105
Results ... 110
Number of Parts ... 111
Number of Parts Affected ... 114
Difficulty of changing the value chain... 118
Triangulating Value Chain Complexity ... 120
Instrumental Variable Regression Analysis ... 123
Discussion ... 125
Value Chain Complexity Extends Insertion Times ... 125
Switching Costs Help Explain the Effects of Value Chain Complexity ... 126
Switching Costs in the Value Chain ... 128
Conclusion ... 131
Additional Resolution to the Materials Commercialization Pattern ... 132
Chapter 6: Toward Faster Commercialization of New Materials ... 135
Introduction
... ...
135
Assumption of Rationality ... 136
Switching Costs Create Rational Barriers ... 136
Reducing Value Chain Complexity ... 138
Market Selection: Reducing Nodes ... 139
Technical Decoupling: The Mimic ... 142
The Injection Principle ... 142
Increasing Understanding of a Material ... 143
The Knowledge Gap ... 143
Network Effects and Real World Applications ... 146
The Challenge of Building a Network (or how to reduce learning, liability, and handoff costs) ... 149
The Importance of Understanding ... 151
Mapping Insertion Strategies ... 152
Enablers . ... 152
Value Chain Integration ... 155
Simple Substitution ... 158
Mimic Existing Materials ... 159
Conclusion ... 161
Resolution to the Pattern of Materials Commercialization ... 162
Resolution to New Market Disruptions ... 163
Chapter 7: Lessons in Competition (Penetration Factors) ... 165
Introduction ... 165
Lesson 1: Advantage from Asymmetric Properties and Capabilities ... 165
Lesson 2: Value Chain Elements as Strategic Tools ... 169
The Challenge: Building Codes, Trade Adoption ... 170
The Solution (part 1): Standards and Design ... 172
The Solution (part 2): Building a Track Record ... 173
Lesson 3: The Lowest Cost Perfect Match ... ... 174
ABS in Pipe . ... 175
ABS in Automobiles ... 176
ABS in Refrigerators ... 176
Other ABS Examples ... 176
Conclusion ... 177
Resolution to the Insertion Strategy Map ... ... 178
Chapter 8: Walking Through the Shadow of the Valley of Death ... 181
Introduction ... 181
Government, Materials, and the Valley of Death ... 182
Government Funds Research ... 182
Government Provides Coordination and Markets for Strategic New Materials ... 183
Government Shares Risk ... 185
The Case for Enablers in Materials Policy ... ... 186
Three Options to Encourage Enablers ... ... 187
Option 1: Focus Existing Risk Share Programs on Enablers ... 187
Option 2: Create a National New Materials Clearing House ... 188
Option 3: Develop a Market for Ideas ... 192
Conclusion ... 195
Chapter 9: Changing Mindsets ... 197
Commercializing New Materials ... 197
Moving Forward ... 202
Appendices ... ... 207
Appendix A: Actual Challenges Listed in Modem Plastics ... 208
Appendix B: Pool applications and included data ... 213
Appendix C: Expert Credentials ... 219
Appendix D: Number of Parts Definitions ... 222
Appendix E: Mean Expert Ratings ... 227
Table of Figures
Figure 1.1: Generic value chain .. ... 18
Figure 1.2: Generic materials value chain ... 18
Figure 1.3: NAE materials polyhedron ... 20
Figure 2.1: Graph of production volume v. cost ... 31
Figure 2.2: Commercialization map showing obstacles ... 34
Figure 3.1: Histogram of time elapsed between introduction of new materials and their insertion in biggest applications ... 53
Figure 3.2: Mobay/Bendix bear ... ... 58
Figure 3.3: Acrylic reflectors on Michigan highway ... 59
Figure 3.4: Chiffon HDPE bottle ... ... 63
Figure 3.5: Early plastic bleach bottles ... 64
Figure 3.6: Phenolic agitator ... 66
Figure 3.7: Commercialization pattern of plastics ... 69
Figure 4.1: Insertion periods of major 1998 applications, showing cost position ... 78
Figure 4.2: Generic product value chain, showing position of material manufacturing... 79
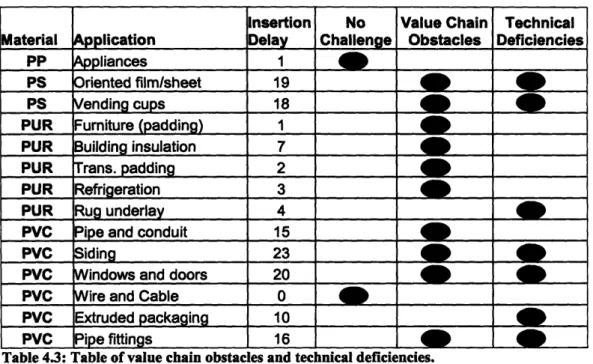
Figure 4.3: Histogram of major plastics by value chain and technical challenges ... 81
Figure 4.4: Materials commercialization pattern ... 86
Figure 4.5: Microcool Linear Metal Foam ... ... 88
Figure 4.6: Nanomagnetics apoferritin-embedded magnetic particle ... 90
Figure 4.7: Selectech plastic parking stops ... 94
Figure 4.8: Selectech EcoPlanter ... 95
Figure 4.9: Selectech SelecTile ... 96
Figure 5.1: Distribution of application pool by plastic ... 103
Figure 5.2: Distribution of application pool by application industry ... 104
Figure 5.3: Distribution of application pool by insertion time ... 104
Figure 5.4: Generic materials value chain .. ... 105
Figure 5.5: Four category display of number of parts v. insertion time ... 112
Figure 5.6: Broad category display of number of parts v. insertion time ... 112
Figure 5.7: Number of parts scatter plot ... 113
Figure 5.8: Number of parts affected v. mean insertion time (four categories) ... 115
Figure 5.9: Number of parts affected v. mean insertion time (two categories) ... 115
Figure 5.10: Scatterplot of number of parts affected. ... 117
Figure 5.11: Number of parts affected v. mean insertion time (four categories) ... 118
Figure 5.12: Number of parts affected v. mean insertion time (two categories) ... 118
Figure 5.13: Scatterplot of value chain change difficulty ... 120
Figure 5.14: Scatterplot of value chain instruments ... 121
Figure 5.15: Historical pattern of materials commercialization ... 132
Figure 6.1: Switching cost severity matrix ... ... 138
Figure 6.2: Simplified CFRP aircraft skin value chain ... 139
Figure 6.3: Simplified CFRP aircraft skin value chain ... 140
Figure 6.4: Golf shaft value chain, showing decoupling point ... 141
Figure 6.5: 1959 Delrin and brass toilet valves ... 145
Figure 6.6: Insertion Strategy Matrix for materials ... 152
Figure 6.7: Wham-O Hula Hoops and world champion hula hooper ... 154
Figure 6.9: ABS refrigerator door liner. ... 161
Figure 7.1: ABS vs. stainless steel in corrosion. ABS is shown on the left ... 167
Figure 7.2: Value chain of mainstream plumbing applications. ... 170
Figure 7.3: ABS pipe tree ... 173
Table of Tables
Table 1.1: Two different products, nearly identical value chains ... 19
Table 1.2: Two similar products, vastly different value chains ... 19
Table 2.1: Damage to an automobile fender... 27
Table 3.1: Number of categories and example categories for each major plastic ... 50
Table 3.2: Biggest applications and portion of total sales of major plastics, 1998 ... 51
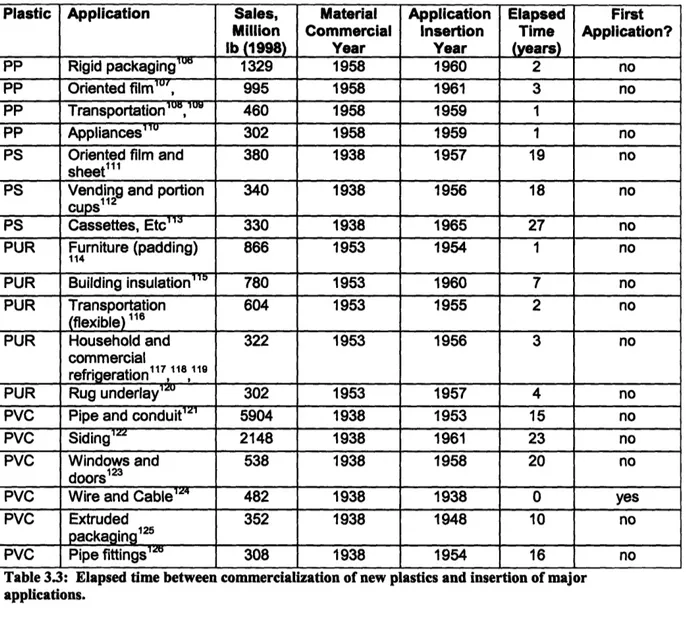
Table 3.3: Elapsed time between commercialization of new plastics and insertion ... 53
Table 3.4: Correlation matrix of insertion periods and overall sales ... 55
Table 3.5: First applications for 14 commercial plastics... 56
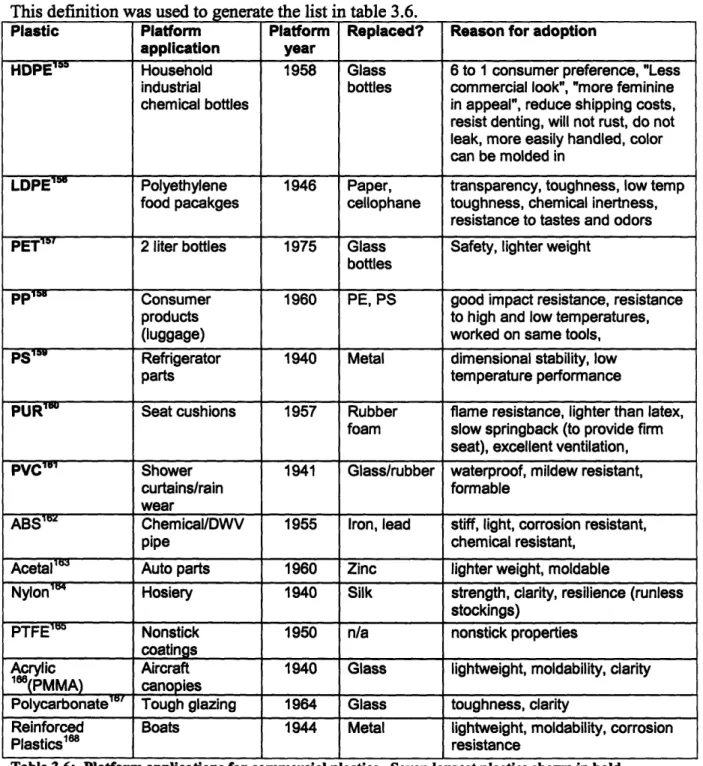
Table 3.6: Platform applications for commercial plastics... 61
Table 3.7: Goals and characteristics of phases in materials commercialization pattern.. 69
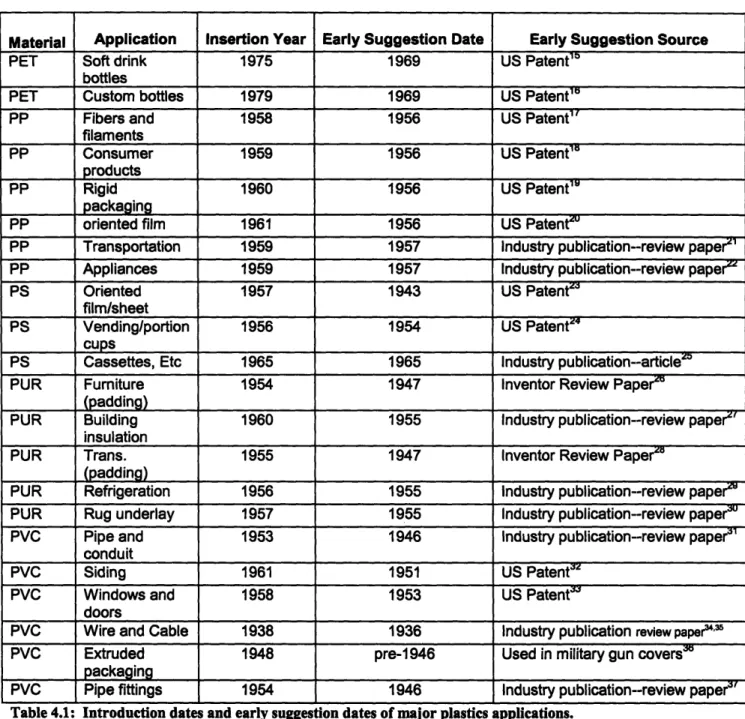
Table 4.1: Introduction dates and early suggestion dates of major plastics applications. 73 Table 4.2: Prices of new plastics compared to displaced existing materials ... 76
Table 4.3: Table of value chain obstacles and technical deficiencies ... 81
Table 4.4: Results of one sided t-tests ... 82
Table 4.5: SPSS output of regression of value chain obstacles and technical deficiencies vs. insertion time ... 83
Table 4.6: SPSS output of regression of value chain obstacles and technical deficiencies vs. elapsed time between suggestion and insertion ... 84
Table 4.7: SPSS output of regression of value chain obstacles and technical deficiencies vs. elapsed time between suggestion and insertion ... 85
Table 5.1: Scale of number of parts method ... 107
Table 5.2: Scale of number of parts affected method ... 108
Table 5.3: Scale of difficulty of change in the value chain method ... 109
Table 5.4: Summary of number of parts method categories ... 112
Table 5.5: Regression analysis of trendline shown in figure 5.7 ... 114
Table 5.6: Summary of number of parts affected instrument categories ... 116
Table 5.7: Summary of number of parts affected method categories (less hi/lo) ... 116
Table 5.8: Regression analysis of trendline shown in figure 5.10 ... 117
Table 5.9: Summary of value chain change difficulty measurement categories ... 119
Table 5.10: Summary of value chain change difficulty categories (less hi/lo) ... 119
Table 5.11: Regression analysis of trendline shown in figure 5.13 ... 120
Table 5.12: Bivariate correlation matrices of value chain instruments ... 121
Table 5.13: Trivariate regression analysis of insertion times ... 122
Table 5.14: Bivariate regression analysis using number of parts affected instrument and value chain difficulty instrument. ... 123
Table 5.15: Two stage least squares regression with number of parts affected as regressor and value chain difficulty as IV ... 124
Table 5.16: Two stage least squares regression with value chain difficulty as regressor and number of parts affected as IV ... ... 124
Acknowledgements
I feel that a cadre of people has surrounded me to help me through this process, and I find myself in awe of their commitment.
I would like to thank the Mika family and Dick Maloney of ADM Cocoa for making this endeavor possible. It would have been irresponsible for me to continue my studies without their help.
I have been blessed with an extraordinary thesis committee. I believe them to be the best in the world at what they do, and some of the smartest people I have ever met. They have all been remarkably supportive of my work, and have encouraged me when necessary. I thank Clayton Christensen for his wonderful ability to teach-he has shown me the path to solving the problem and has taught me to carefully frame it. I thank Joel Cutcher-Gershenfield for his encouragement and wonderful understanding of data and methods. I don't know what I would have done without him. I thank David Mindell for his clarity and articulation-he has forced me to tell the story better, implicitly asking me to learn the material at a deeper level. I also thank Dr. Hammer, the honorary member of my committee. He is incredibly quick to understand, and has given me great insight. Monty Alger of GE Advanced Materials has been an instrumental mentor for my thesis work. He is the first person that has tried to apply the theory, and his feedback has been invaluable. I look forward to maintaining our relationship. I also thank the engineering team at Special Metals, for being my first receptive audience.
The insights of the experts and industry friends whom I interviewed gave me great insight. Each one has earned my gratitude: Chris Magee, Paul Lagace, Chris Scott, Darran Cairns, Larry Bell, Eric Mayes, Tom Ricciardelli, Grant Bennett, and Stan Abkowitz, as well as the rest of Monty's team at GE and the team at Special Metals. My friends have been a great support. Joel Williams, Murray Duff, Doug Cannon, Brian Bowers, Lou Rassey, Rick Johnson, and Josh Halverson have acted as sounding boards
and counselors to force me to refine my ideas.
The Welding and Joining Group has been an extraordinary organization to be part of. Jeri Hill, Don Galler, Harold Larson, Burke Hunsaker, Raymundo Arroyave, Neil Jenkins, Mikal Balmforth and the other members of the group have been the best
colleagues I can imagine, and have also been fantastic friends.
Tom Eagar took a chance in helping me get admitted to MIT, and has been a peerless mentor. He has helped me grow in every way, has pushed me to improve when necessary
and humbled me when needed, and has been incredibly supportive. If there has been a single turning point in my professional life, it was Tom's decision to let me work with him. I will be forever grateful for his generosity and spirit.
I am eternally grateful for my family. My wonderful wife has never complained about the workload that has been required to complete this project, and has supported every
professional move I have made. She is my greatest cheerleader--truly a woman without guile, and I love her for it. Her kindness and intelligence have sustained me. I am also thankful for our two sons, Matthew (who was born a week before my generals) and
William (who was born a month before my defense). Along with my wife, they have brought me greater joy than I thought possible.
My parents have always wanted the best for me and have encouraged me to be the most I can be. Like Tom and my wife, they have always believed more in me than I do. I am thankful for their love and support. My dad has wanted me to do the doctorate from day one. I am happy to report that it is done.
Chapter 1: Beating the System
Motivation
The early history of man has been classified by archaeologists into three chronological ages: the Stone Age, the Bronze Age, and the Iron Agel. Each of the Ages is named according to the materials technology that was possessed by society. This is recognition of the impact of materials on the welfare, economies, and technologies of societies. Materials are the basis of manufactured good and the basis of construction. In fact, they are the basis of most technological progress.
Because of the impact of materials on technology and society, there is a great deal of research focused on creating innovative new materials. However, the track record of commercialization of these materials is quite poor. Materials experts have asserted that materials breakthroughs in the twentieth century required nearly 20 years from the time
of invention to gain widespread market acceptance2. Some applications, such as the use
of aluminum in automobile bodies, have taken much longer, despite clear advantages in materials properties. This lag can be caused by many factors, ranging from poor market education to technical obstacles to political roadblocks to financial infeasibility.
No matter the cause, a 20 year commercialization horizon is simply too long for private investment. Capitalism has proven to be the most effective means of diffusing new materials into widespread use, but it works only if entrepreneurs and corporations are willing to take the risk of commercialization3. A long commercialization period
increases this risk significantly, and also causes the present value of expected earnings to become very small. Shortening the commercialization period can be the difference between a successful new material and one that is dropped in the development stage. The research presented here is designed to respond to a simple question: how can materials be commercialized faster? This is a broad question, and the methods used to answer it have also been broad. This thesis is not designed to test a simple hypothesis, but rather to provide a roadmap for commercialization of new materials. Extensive
research has been performed to create this roadmap. More than 50 key papers from business innovation literature were reviewed; over 250 contemporaneous articles from the plastics industry were used as sources, including 65 years of annual technical, marketing, and price reviews4'5. Formal interviews or in-depth discussions were held with over 25 industry experts6.
These sources provided data for several different analyses. A core set of time series data from the history of the most successful plastics was created to identify commercialization patterns. This data was analyzed using quantitative statistical techniques such as
multivariate regression, and qualitative techniques such as expert scoring. In addition, more than 15 case studies were created (many of which are reported in this thesis) to reinforce the qualitative and quantitative analyses.
These complimentary analysis techniques combine to show that strategies exist to simplify the commercialization challenges of new materials. This thesis will show that all of the most successful plastics followed a characteristic pattern of commercialization which is counterintuitive to the traditional attitudes toward materials marketing. Most materials marketing literature has been focused on materials substitution in situations where both the attacker and the incumbent are well-understood7. In these cases, the most
important factor is the value proposition (often expressed as multi-attribute utility), which allows deep penetration into existing markets8.
This theory breaks down when applied to many new materials, where value proposition alone is not enough9. New materials are not well-understood-their design capabilities and failure modes are not fully developed. Furthermore, application manufacturers don't have experience processing them, and processing techniques are often nascent. Many parts of the value chain have to be adapted to adopt new materials; the costs and risks of
these adaptations are unknown in the case of new materials, and provide rational disincentives for adoption. These disincentives limit the speed of insertion of new materials to the market, and must be overcome no matter how appealing the value proposition of a material.
The core contribution of this thesis is quite simple: traditional materials marketing wisdom is incomplete, and mindsets must be amended to deal with commercialization of new materials. Because new materials are not well-understood, the adoption conditions they face are different from the conditions faced by existing materials. New materials will succeed much more quickly if mindsets are changed to focus on value chain management in addition to value proposition. By doing this, materials producers can reduce the uncertainty and expense faced by applications manufacturers in adopting new materials. This assertion is as applicable to today's materials as it was to the plastics of the
twentieth century, and several value chain management strategies will be presented that lead to shorter commercialization.
It is hoped that this research will be useful to materials researchers, innovators, and entrepreneurs. This thesis represents the most comprehensive analysis of
commercialization of new materials to date, but is by no means complete. It is designed to provide strategies which will be operationalized very differently in different
organizations. Within the operationalization lies opportunity for competitive advantage. While this research is directly applicable to the materials industry, it also adds to the general body of innovation theory by revealing and explaining anomalies to existing models. In addition to explaining these anomalies, it uncovers several new questions for future work.
Materials are Special
Research in other major industries has shown strategies and business models that can significantly reduce commercialization periods of new technologies. Some of these strategies and models are applicable to many industries, but many of them are industry-specific. Although some tools have been developed for understanding the introduction of new materials, there is currently no comprehensive framework for the business of the
materials industry, and the existing general frameworks offer, at best, limited applicability.
Part of the problem is that the "materials industry", per se, is a very broad classification. Many definitions exist for the word "material", ranging from "anything for which an engineering drawing does not exist"'° to "The substance or substances out of which a thing is or can be made"'' . Both of these definitions could include the chemicals, textiles, mining, basic metals, polymers, ceramics, and composites industries, to name a few. This thesis will deal with the basic materials sector, which includes a group of industries that dwell at the same point in the value chain and share many common challenges. This group includes those industries which process raw substances, such as chemicals and ores, into commercial materials which can then be converted by
manufacturers into useful products which can be sold to customers. Under these
boundaries, the mining and basic chemical industries are excluded, and the basic metals, polymers, ceramics, and composites industries remain.
It will be shown in this thesis that all of the basic materials in this group share some common elements, which make them unique as a group and profoundly impact the business conditions they face.
1. Materials come early in the value chain: As the basis of most products, materials are the first point of competitive differentiation in the product manufacturing value chain. They interact with every step in the manufacturing, distribution, maintenance, distribution, and disposal processes. Their position in the value chain facilitates commoditization, and makes introduction of major innovation very difficult.
2. Materials are difficult to change: Materials are highly complex products. Their properties are affected by raw materials (such as chemicals, ores,etc), production techniques, and secondary processes. Because of the interdependence of these factors on the properties of materials, they are very difficult to change compared to assembled products, software, or services.
3. Materials are versatile: most materials can be used in a wide variety of applications, and the properties of materials rarely "lock-in" users.
4. Materials arefiunctionally fungible: Processing steps in the value chain disguise materials, and in most cases, end users neither know nor care what a product is made of, as long as it works. Market pull is for functions, not for specific
materials. Funtional fungibility is related to versatility, but is slightly different in that it is caused by end users, whereas versatility is caused by the properties of a material.
While other industries have some of these factors, none has all. Because these factors have such impact on the business conditions that materials face and can be isolated, they make materials an interesting case study for other industries in which the factors are
present but less prevalent. It may be possible to generalize the insights that emerge from the study of materials by recognizing and reintegrating these factors into the fabric of
innovation theory. Each of these factors will now be discussed.
Materials Come Early in the Value Chain
Materials, per se, have very little value. They are worth little unless formed into a useful product and sold. In most cases, materials are produced and then sold to product
manufacturers who process them and integrate them into saleable components, parts, and systems. Understanding the activities of the product manufacturers, and the interactions of materials with those activities, is an important part of understanding the uniqueness of the materials business for two reasons. First, product manufacturers are the direct customers of the materials business. Second, product manufacturers add value to
materials so that they can be adopted by end users. Porter's value chain model is a useful tool for gaining this understanding.
The value chain model was introduced in 1985 as a tool for analyzing the competitive structure of industries and the competitive position of firms within that structure.
According to Porter, "the value chain provides a systematic way to divide a firm into its discrete activities ... to examine how the activities are grouped"'2. The model contends that there exists a generic set of value adding activities (each with a corresponding set of knowledge and equipment) that every firm undertakes in order to deliver a useful product to its customer, shown in figure 1.1:
Porter's Generic Value Chain Model
Inbound
Operations
Outbound
Marketing/
logistics Logistics Sales
Figure 1.1: Generic value chain. Each box (node) corresponds to a set of activities.
The generic model becomes more useful when adapted to describe a generic materials value chain, as shown in figure 1.2:
Materials Value Chain
Inspection of the materials value chain shows that materials manufacturing is the first of a series of value added activities, and is the first point of competitive product
differentiation (since raw materials are almost always commodity products). Although purchasing and supply techniques for raw materials can create lower costs for materials manufacturers, their lack of differentiability makes them of little consequence to other nodes of the value chain. For this reason, they will not be considered here.
Value chains are systemically interdependent but functionally independent. Each node has specific functions to perform, which require different knowledge and equipment than other nodes, yet each node is affected by decisions and activities in other nodes. The nodes are also sequential, so that the effects of the activities and decisions of early nodes cascade into later nodes. Similarly, inter-node compatibility can force decisions in later nodes to have the effect of constraining flexibility in earlier nodes. Since materials are the first point of competitive differentiation in the value chain, they play an important role in determining the structure of the other nodes. Materials form the basis for end products, and interact with all of the value creating activities-and the corresponding knowledge and capital equipment-in the chain. Once a material is chosen, each subsequent node must be designed or adapted to accommodate it, as well as to meet the needs of the end customer. As a result, two vastly different products made of the same material may have nearly identical value chains. Table 1.1 shows some of the equipment, supplies, techniques, and knowledge that are required to produce two different parts of the same material.
Value Chain Activity HDPE Hair Comb HDPE Bucket
Material HDPE HDPE
Part manufacturing Injection Molding Injection molding
Assembly none none
Distribution Truck/boat Truck/boat
Sales and marketing Retail (Wal Mart) Retail (Wal Mart)
Customer Household Household
Maintenance none none
Table 1.1: Two different products, nearly identical value chains
Likewise, two very similar products made of different materials can have vastly different value chains (as shown in tablel.2).
Value Chain Activity
Material Part manufacturing Wood Picnic table Wood Sawing, sanding PVC Picnic table PVC Injection molding
Assembly bolts, glue, nails snap together
Distribution Truck Truck/boat
Sales and marketing Retail (Wal Mart) Retail (Wal Mart)
Customer Household Household
Maintenance Stain, etc none
The position of materials in the value chain as the first point of product differentiation is unique. It has important implications for the materials business: it creates disincentives for major innovation, increases the risk associated with failure, and facilitates
commoditization. The interdependence of the value chain elements also raises the bar for switching materials, since significant costs must be incurred to change from one material to another. These switching costs will be shown to be very important factors in materials.
Materials are Difficult to Change
The relationship of materials to application value chains is not one-sided; the activities of the value chain have a profound effect on the end state of a material. This is because the properties of materials are intimately connected to the processing techniques used by application manufacturers to form them. The relationship of materials properties to processing is one of several important relationships that comprise a useful material. The performance of a material is also affected by the internal structure of the material, the quality of its raw materials, and the application itself. Figure 1.3 shows a diagram created by the Materials Advisory Board of the National Academy of Engineering which displays the factors that must be considered when developing a material.
Struotuse/ composition user needs/ traints Performance synmnesis/ processing
Figure 1.3: NAE materials polyhedron
The interconnected corners of the NAE polyhedron convey a subtle but important message: materials are very complex.
Because of the complexity of materials, materials science has always been an interdisciplinary field. Materials science has traditionally drawn on such diverse disciplines as chemistry, physics, and mechanical engineering13. It still draws on all of these fields today, but now has a much larger pool, including biology, manufacturing engineering, and even economics 14. This breadth of disciplines gives insight into the
complex interactions that take place when one (or many) of the corners of the polyhedron is altered. These complex interactions make sweeping changes of the properties of materials very difficult.
The net effect of complexity in materials is simple: it slows change. But slow change is only part of the story. There are fundamental constraints on many properties imposed by
the chemistry and thermodynamics of the constituent elements of materials. These constraints have an effect that is at least as powerful as that of complexity: they limit the envelope of properties that can be attained with a given material. Materials scientists have developed tools to understand and manipulate fundamental constraints, and have created wider ranges of properties than could be imagined decades ago, but the
constraints still exist. These constraints prevent materials from being all things to all applications.
Thus, materials are difficult to change and have fundamental limits on their properties. Materials do not have the luxury of being easily reconfigured to meet the needs of customers, meaning that market pull for introduction is an option only when the properties of a material coincide with needs of an application. This makes them very different from the assembled products which have been studied in the development of
innovation theory, because assembled products can be rearranged to meet new needsl5'1 6'17. This difference is significant, and can be expected to cause materials to
follow different patterns of commercialization than other products.
Materials are Versatile
Luckily (since they are difficult to change), most materials are quite versatile. All but the most specialized materials have properties that make them applicable to a wide range (from dozens to millions) of applications. Although product redesigns are usually required to take full advantage of materials properties, examples of materials versatility abound. Car bodies are made of steel, ABS plastic, and fiberglass. Bicycles are made of steel, carbon fiber composites, and aluminum. Even jewelry is made from many
materials, including gold, silver, titanium, and tungsten carbide. This does not mean that every material is right for every application, but most materials can be right for many applications.
The versatility of materials creates some interesting challenges in the materials business. First, there is a high degree of cross-product competition-materials may face challenges not only from other grades of the same material, but from completely different materials. This means that attacks can come from all sides: better grades of similar materials can attack by reducing cost; cheaper grades of similar materials can attack by improving properties; different materials can attack from lateral markets.
Market positions can also shift quite easily, according to changes in technology, new design specifications, or even the whims of consumers. This means that materials producers must be constantly vigilant to maintain markets. Versatility also facilitates commoditization. If two materials can easily fill the needs of an application, the
application manufacturer will naturally select the lowest cost material. The easiest way for producers to compete in this situation is to lower the price of the materials. As competitors respond, a downward spiral ensues until one competitor becomes
unprofitable. When many materials can fill the needs of an application, this pull toward the bottom becomes especially strong.
Materials are Functionally Fungible
The effects of materials versatility are exacerbated by another aspect of the materials business: functional fungibility. Most consumers neither know nor care about the exact material a part is made from, as long as that material performs its intended function within expectations of cost and reliability; thus, materials are "functionally fungible" in the eyes of consumers18. The distance in the value chain between materials and end users is quite long, and several of the intermediate nodes employ process technologies that add value to the material while simultaneously disguising its identity to the end user. This makes it very difficult for end use consumers to identify the exact materials used in a product, and parts are commonly described simply as "metal", "plastic", "wood", or
"cement".
This long-value-chain induced ignorance is a key element of the materials industry: it makes consumers insensitive to small switches in material grade and manufacturer. Free
from demands of end user loyalty, application manufacturers are free to switch materials (as long as the new material offers enough value to overcome switching costs). This freedom creates a rational incentive for materials producers to make clusters of nearly interchangeable products-wide varieties of similar grades from a wide variety of manufacturers-to compete for existing business. The same long, highly interdependent value chain that creates a rational disincentive to major materials changes creates a rational incentive for commodity competition.
The materials for which switching barriers between grades or manufacturers are very low are considered commodities. Almost every family of materials has commodity grades, and those grades generally account for the bulk of annual sales poundage. Because commodities are easily switched, and because they account for the most sales, it follows that the majority of materials changes occur in the commodity regime. Switches between
grades or manufacturers often carry very low switching costs-ranging from no costs at all to small transaction or adaptation costs in a few nodes-because they are drop-in replacements for existing products. The switches may offer slightly more utility to consumers, may lower purchase costs of materials, or may reduce costs somewhere else
in the value chain.
Conclusion
Materials are probably the most ubiquitous manufactured products in the world, and are the basis of almost all other manufactured products. They are several unique factors
about the materials business that make it interesting to study. By recognizing and
isolating these factors, it may also be possible to isolate their effects, so that insights from the materials industry can be generalized into other industries.
Materials are the first point of competitive differentiation in the value chain of most products, and have a large impact on the structure of value chains. Value chains can be
expensive to change, and provide a rational incentive for applications manufacturers to stay with incumbent materials. Materials themselves are hard to change, because they are very complex and are fundamentally limited by their structures and chemistry. They aren't easily reconfigured to meet the needs of customers. Despite being hard to change,
the properties of most materials lend themselves to a wide variety of uses. This creates an extremely competitive landscape between materials. This competition is worsened by the fact that, in most applications, end users neither know nor care about the material that
is used in an application, as long as it works'9.
While each of these factors is interesting on its own, the interaction effects of the factors are more interesting. The position of materials in the value chain and the difficulty of change in materials interact to create very high barriers for materials innovation. Novel materials often require expensive changes in value chains, and the switching costs can be insurmountable. Since materials are difficult to change, technical deficiencies of new materials can require significant resources and long periods of time to overcome-barriers that can preclude the use of a material.
On the other hand, the versatility of materials interacts with functional fungibility to create markets that are ripe for commoditization. When the properties of multiple
materials can fill the needs of an application, and consumers don't care about the material in the product, switching costs in the value chain are the only barriers preventing
application manufacturers from switching materials. By creating materials that are interchangeable with incumbents within value chains, low-cost producers can force a downward commoditization spiral.
Perhaps the most interesting interaction is between the versatility of materials and the difficulty to change them. This interaction requires that the primary tools of innovators be changed. Innovators in industries such as assembled products and software often find themselves in a market pull situation, where properties are selected to match markets. These innovators must have an acute sense of market needs-and their primary tool is to configure their products to meet those needs20. Since most materials are both versatile and difficult to change, reconfiguration of materials to fit market needs is rarely a viable option. This puts materials innovators in the opposite situation of other innovators--they are faced with technology push, in which the primary tool is market selection. Markets must be selected to match the appealing properties of a material21. If one also considers the position of materials early in the value chain, and the fact that end users often don't care about their identity, it becomes obvious that materials commercialization may be an excellent field in which to learn about the behavior of technologies in a push situation.
Chapter 2: Review and Commentary of Relevant
Literature on Materials Commercialization
Introduction
Chapter 1 discussed the some of the unique features of the materials business, with a special focus on the interaction effects of those features. This chapter will review prior work with respect to materials commercialization in order to establish a baseline for further work. It will explain traditional materials marketing wisdom and will discuss
some barriers to introducing new materials, most of which are related to value chain challenges. It will also discuss some of the limitations of general innovation with respect
to materials.
The principle driver for materials advancements has been the desire to build profits, and the principle diffusion mechanism has been free market capitalism. It is doubtful that much research and development would be performed without the promise of competitive
advantage--either military or commercial--and the associated spoils: most materials advancements would be of little value to anyone without commercialization.
Given the importance of profits in materials development, there are remarkably few papers in the technical literature about early commercialization of new materials. Most
of the references that pertain directly to new materials reflect the opinions and experience of materials experts. However, a fairly strong body of work has been built around
substitution between existing materials'. While some efforts have been made to apply the general substitution frameworks to new materials, they have met limited success. There is no prior work that shows a systematic exploration of historical successes and failures in materials commercialization.
In general, the opinions and experiences of experts and materials substitution models can be distilled to four important foundation points. First, there is a need for materials
engineers, scientists, and entrepreneurs to improve their understanding of the business realities of materials propositions. Second, a traditional materials marketing mindset exists: new materials should be launched into large-market applications where they offer a superior value proposition to incumbent materials. Third, there is a series of
systematic barriers that compound the difficulties of materials commercialization. Fourth, materials don't seem to follow the same rules as other innovations: existing innovation strategy frameworks do not completely describe them.
The purpose of this review is to reveal and expand the strengths and weaknesses of the underlying principles of the foundation points in order to provide a basis for a systematic investigation of the fundamentals of materials commercialization.
Understanding the Business Side of Materials Commercialization
The Technology Transfer ModelMost materials development in the United States is performed in government research labs, universities, or pure commercial research labs. It is often performed as basic
research, or is targeted directly toward the aerospace industry, where cost is secondary to performance2. Because of the uncertain nature of materials research, it is often funded by
the federal government or with commercial research (not product) budgets. The business of materials research could be the subject of another thesis, and will not be treated here. Instead, this scope of this chapter will begin at the point at which lab-scale prototypes of materials advancements have been built, and commercial development of the material is being determined. This is a very common situation, usually called technology transfer from research to product development. Technology transfers happen not only from government labs and universities to businesses, but also between businesses and within businesses, from research departments to product departments.
The business implications of technology transfer are substantial. Technology transfers allow businesses to broaden their research portfolios by purchasing research at a cost that is usually much lower than the actual research cost of the material, and to share potential
risk with the seller by paying future-and uncertain-royalties. Furthermore, businesses
have a much better idea of what they are buying in this situation; they can be reasonably confident that their material is not a technological loser. Both of these factors make technology transfer seem to be an attractive entry point.
Unfortunately, this model is not perfect. Materials research labs are generally concerned with materials research; they seek high performance solutions and have little incentive to develop processing methods for anything larger or better than lab scale3, and tend to suboptimize. These factors can result in materials that are polished only enough for testing and which carry learning costs that make them far too expensive to be commercially viable, regardless of their properties. They are often well understood technically, but not ready for "prime-time" markets. Materials businesses and product manufacturers must undertake the difficult and expensive tasks of reducing
manufacturing costs and refining the materials to meet practical market needs. Once these tasks are complete, materials ventures face a risky future, since there is no guarantee that their products will be accepted by the market4.
Risk Factors in New Materials
In a recent report, the National Research Council declared that: "two sets of
perceptions-the desire for timely incorporation of change, and caution in the face of its possible effects-create a significant tension between those charged with the
development of new technology capabilities and those who feel accountable for the consequences of such technology incorporation"5. This statement reflects a belief that materials researchers must grasp the dozens of sources of risk faced by materials businesses if they are to succeed with commercialization. Most of these risks apply to both large and small companies, although they may have different effects. They can be generally classified into five categories, each of which will be briefly discussed.
Market/Product Risk6
There is an axiom in the business world that says market and sales forecasts are always wrong. This problem is particularly acute in the materials world, where the "technical community, in a wave of enthusiasm, systematically overestimates the value of its
discovery", and almost always overprojects the size of a potential market. Materials depend on filling needs in products, and there is no guarantee to investors that materials will find product acceptance. In order to minimize risk, "materials must find applications quickly or else lose user interest".
Even if a new material is fortunate enough to be integrated into a product, there is significant risk that the product itself will not succeed. Because materials are embedded in products, any risks that exist in the product market are amplified in the materials market. This risk can be mitigated by integrating the material into a wide range of products, which is very expensive and difficult to do in the early stages of the life of the material.
Latent Liability Risk7
Materials almost always play "mission critical" roles in applications. If a material fails, the part that is made of it will fail. Furthermore, materials issues are often very difficult or impossible to fix, requiring part replacement in the event of their failure. In many cases, such as flight critical aerospace or automotive applications, material failure can cause injury or death to users. This means that investors in a new material assume significant latent liability and warranty risk that could emerge at any time in the life of the material.
The example of an automobile fender, shown in table 2.1, is useful to illustrate the possible latent warranty costs in a material failure. Note the extent to which costs rise (and blame shifts) as the damage extends deeper into the system. Note also that a problem such as grain boundary corrosion would most likely not be limited to a single vehicle.
Damage Correction Estimated Cost ($) Who Pays? Procedure
Scratch Polish 15 Customer
Deep scratch Touch up, polish 50 Customer
Dent Dent pull, polish 150 Customer/At fault
Dent with crack Dent pull, sand, 300 Customer/At fault
weld, repaint, polish
Grain boundary Remove, scrap, 600 Manufacturer
corrosion replace, repaint,
polish
Table 2.1: Damage to an automobile fender.
Table 2.1 also offers a hint of the unknown costs that high volume manufacturers face, and why they would be reluctant to integrate unproven materials into their products.
Manufacturing Risk
Economies of scale are definitely present in materials manufacture. In fact, very few materials can be cost-effective without large-scale production. Since most materials are developed to lab scale first, there is significant risk that they will not be economically producible. Technical cost models can offer "best guess" predictions of the
manufacturing costs, but it is impossible to foresee the magnitude of learning costs that occur during manufacturing scale-up. This problem is aggravated by market risk, because it is very difficult to project the proper manufacturing capacity to build. Because of the cost of building materials processing capacity, manufacturing will be considered as a barrier later in this chapter.
Time to Market Risk
Perhaps the biggest risk that new materials face is the "20-year barrier". Most materials advancements of the 20th century required 20 years to move from research stage to full commercializations. This period is much longer than that faced by consumer products, electronics, and biomedical devices, to say nothing of software9.
The anticipation of waiting 20 years to receive payback on an investment is not
appetizing to investors because it introduces several sources of risk and severely retards the present value of cash flows. Given the pace of technology, there is significant risk that another, better solution will be introduced during that period that will displace a new material altogetherl°. That solution need not be a material, but could be a paradigm shifting design. There is also risk that market tastes will be different--imagine releasing in 1995 a new, more vibrant polyester for leisure suits that investors in 1975 thought would be a big seller!
There is also general economic and government regulation risk". Wars, recessions, regulatory changes, and even demographic changes can occur in 20 years, all of which could eliminate the potential sales of a new material.
Capital Implications of the 20 Year Challenge
Experts have found it useful to educate engineers about the economics of a 20 year lag time using present value calculations. In order to justify the risk of doing business over the diversified risk of investing in the stock market, most large companies require an internal rate of return (IRR) of at least 5% over the historical return of the S&P 50012,
15.55% over the past 10 years'3. The equation for the required return on investment is
x=P(I +r)'
where x=dollars required, P=principle invested, r=IRR (required percentage return), and t= time, in years'4. Performing this calculation shows that each dollar invested today must return $42 in 20 years. However, if the period were shortened to 5 years, only $2.54 would be required from every dollar invested.
Many engineers have wondered why, given the enormous upside potential of new materials, venture capitalists don't take more interest in new materials enterprises. The IRR calculation quickly shows the reason. Because venture capital is invested in risky
ventures, a premium of more than 10% is required over the S&P 50015. Furthermore, venture capitalists expect that 75% of their ventures will fail to make money, so they must bet on enterprises that have solid business plans and the potential to returnfour times their required IRR. Potential must exist to create annual returns of at least 100%16! This means that every venture capital dollar invested in the first stage of a new materials venture would need to return $1.05 million in 20 years! Shortening this period to 5 years has the dramatic effect of reducing the required return to $32/dollar invested.
Executives at materials companies have stated that development costs for new materials start at $10 million, and can be much higher if a material is very novel'7. Most of this investment is made before a material is ever sold. The risk and capital implications of long commercialization periods create rational disincentives for investment. Shortening the commercialization period of new materials would significantly reduce the risk involved with introduction, and would also increase the net present value of materials investments.
Traditional Materials Marketing Wisdom
The materials industry is quite old, and a general set of ideas has been developed that seems to govern business behavior; it can be "traditional materials marketing wisdom". The 20-year barrier is an example of traditional wisdom-many experts believe that it
simply takes a long time to commercialize new materials. The causes of the 20 year barrier will be considered in the next section. Some other tenets of traditional materials marketing wisdom will be discussed in this section.
Large Initial Markets
The first tenet of traditional materials marketing wisdom is simple and straightforward: initial markets must be large. Because of the size of investment needed to develop new materials, business principles dictate that returns be generated as soon as possible after commercialization. In a 1988 study, the Congressional Office of Technology Assessment showed that most producers required "a (projected) initial sales volume of $5 million to $50 million per year to justify production investment"'8. If potential markets don't meet this criterion, the risk becomes very high.
While it may be possible to identify completely new markets that reach the volumes necessary for investment, they are difficult to assess and can be very risky. If new market risk is to be avoided, the large initial market investment requirement places an interesting constraint on new materials-it practically forces them to attempt to replace incumbent materials in existing markets. In this situation, unproven materials must offer enough value to overcome the cost and risk of switching from existing materials (which already work). This sets a very high bar, because switching to uncertain materials can be very expensive. Switching costs will be considered more deeply in chapters 4-6 of this thesis.
Substitution Based on Superior Value
Most materials substitution occurs between two existing materials that are well
steel ones in automobiles, ABS for polycarbonate in computer housings, and OSB for plywood in houses. Research has shown that superior value proposition is key to
substitution between existing materials19. The importance of value proposition has become a tenet of traditional materials marketing wisdom.
Two major tools have been developed to assess the value proposition of materials, and both tools work best with established materials for which the properties are well-known.
The first tool is technical cost modeling, in which manufacturing, market, and technical
scenarios are analyzed using spreadsheet techniques20. Good technical cost models are
very effective, because they take into account all known manufacturing costs and allow sensitivity analysis of many different scenarios. Their output is a comprehensive projection of material production costs over a range of production volumes, cycle time
estimates, capital costs, and other uncertainties. They can be manipulated and used as an effective communication tool between business and materials people.
The cost data from technical cost models makes it possible to execute the second tool: multiattribute utility analysis (MAUA). MAUA is a tool designed to measure the overall value of a product to a certain set of users, and to group those users into potentially profitable market segments21. It is based on the concept that each feature of a product provides utility to a user. Each feature can be separately coded and assessed using lottery
equivalent techniques, in which potential users are asked to identify the probabilistic tipping point at which they might be willing to switch between features . Once preferences are established, all factors can be added together with scaling factors to
identify the true sources of a value proposition.
The concept is rather easy to see when expressed mathematically2 3. For any given attribute, Xi, there exists a utility U(Xi). Since materials have many potentially useful attributes, (X,X2,X3.. .), their value must be defined in terms of multiattribute utility. Once assessed, the different attributes can be combined into a weighted sum using scaling factors (k), such that
N
KU(X)
+1=
n
(Kk(Xi)U(Xi)
+1)
i=l
where K "is a normalizing parameter used to ensure consistency between the definitions of U(X) and U(Xi)"24.
Cost is considered an attribute in MAUA, so it is nominally possible to assess the cost at which a material becomes a viable alternative. When coupled to a cost model, one can obtain a rather wide prediction of the substitution potential between materials.
There are two important caveats that must be considered when applying MAUA. The first is that substitution analysis almost always requires consideration of an incumbent material and an entrant. This being the case, the utility functions are most often compared on the attributes of the incumbent. While this is a realistic comparison for most existing materials, it leaves little room for assessment of unique properties that a new material might offer since it systematically defines the new material in terms of the
aiming to commercialize a new material quickly, since the basis of commercialization for most new materials is some unique combination of properties that enables new products. The second caveat is more fundamental. MAUA is built on an intuitive, yet false, premise: that cheaper, higher performing new materials will always be accepted over
incumbent competitors. While the converse--that more expensive, lower performing materials will not be accepted over incumbent competitors-is almost certainly true, it is
important to remember that risks and switching costs must be overcome for adoption, and that credible competition can come from many sources. The chapters that follow will
show that switching costs and risks are particularly high for new materials, and that value chain elements must be managed to allow fast commercialization.
It should also be noted that proponents of MAUA do not explicitly claim that materials which appear promising will be commercialized quickly, although that indication is implicit.
A Special Focus on Lower Cost
The analytical assessment of value in multiattribute utility analysis was an important step in the understanding of materials substitution, because it explicitly recognizes the
importance of utility, not just cost. While it is likely that other experts understand that a value proposition is comprised of both utility and cost, there appears to be an underlying belief with the materials community that the best path to substitution is to offer a lower cost material. It seems that most reviews of new materials state that market insertion will
come as cost drops2 5 26 2 72 8 2 9
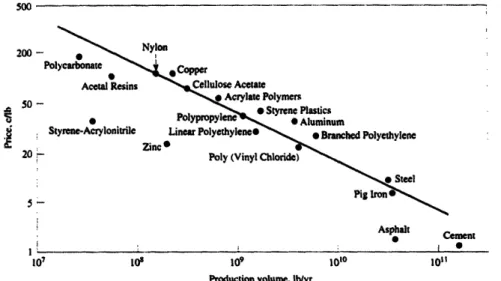
Cost clearly has an effect on the both the value proposition and the range of applications in which a material can be used (see figure 2.1), but it must be considered in context with utility. While the correlation between low cost, utility, and eventual sales volume seems clear, the correlation between low cost and quick substitution (which is implied by the clamor for lower cost) is dubious.
o500 200 -Pol 50 -Asphalt I, . : I · 17 t 1 09 100 10l
Production volume. Iblyr
Figure 2.1: Graph of production volume v. cost. Note that this graph does not take into account the relative density of materials.
We thus see that traditional materials marketing wisdom is comprised of a few core ideas. Many materials experts believe that materials simply take a long time to commercialize. When they are commercialized, they must enter large initial markets, and these markets must be conquered by replacing existing materials. The basis of replacement is superior value proposition, usually through incremental improvements of the same properties that are valued in the incumbent material. Lower cost is considered by many to be the most powerful of these properties.
The IMM: An Excellent Application of Traditional Materials Marketing Wisdom
Maine and Ashby of the University of Cambridge have developed a methodology based on technical cost modeling and multiattribute utility analysis to help materials scientists and potential commercializers make a first attempt at assessing the value of a material innovation. This tool, called the Investment Methodology for Materials (IMM), integrates common business and innovation concepts to create what could be titled "Business Plan
101 for New Materials"3 0. The IMM is extremely broad, and its novelty lies in its specific application of the concepts to materials applications. It is divided into three parts:
1. Viability Assessment 2. Market Forecasting 3. Value Capture
IMM: Viability Assessment'
The strongest section of the IMM is the viability assessment. The viability assessment uses quantitative methods to assess the technical feasibility, projected manufacturing cost, and customer utility of a material. It is essentially a tool to describe known switching costs and to compare them with expected costs and revenues of adoption. The IMM technical feasibility approach is to compare the properties of a material with those of other materials. Since many new material properties are measured, the analysis usually begins with the most remarkable properties (i.e. specific strength of CFRP or specific energy absorption of Al foams), and progresses to other properties. This step can act as a research filter: unless a new material will be dramatically less expensive than comparable solutions, its properties must demonstrate clear superiority to overcome switching costs and thus warrant further development.
Once technical feasibility is established, the next IMM step is to build a technical cost model. As in the applications cited earlier, the purpose of the technical cost model is to identify the range of materials costs that might be feasible given different market and manufacturing scenarios.
Knowing the technical properties and projected costs of a new material allows the application of multiattribute utility analysis. This analysis acts as a filter to identify potential opportunities in a known market. It does not help to identify new markets, unless multiple iterations are performed. Multiple iterations can help reveal markets, but technical and marketing intuition is still required because the market analysis tool