Publisher’s version / Version de l'éditeur:
Vous avez des questions? Nous pouvons vous aider. Pour communiquer directement avec un auteur, consultez la première page de la revue dans laquelle son article a été publié afin de trouver ses coordonnées. Si vous n’arrivez Questions? Contact the NRC Publications Archive team at
[email protected]. If you wish to email the authors directly, please see the first page of the publication for their contact information.
https://publications-cnrc.canada.ca/fra/droits
L’accès à ce site Web et l’utilisation de son contenu sont assujettis aux conditions présentées dans le site
LISEZ CES CONDITIONS ATTENTIVEMENT AVANT D’UTILISER CE SITE WEB.
Laboratory Memorandum (National Research Council of Canada. Institute for Ocean Technology); no. LM-2006-08, 2006
READ THESE TERMS AND CONDITIONS CAREFULLY BEFORE USING THIS WEBSITE. https://nrc-publications.canada.ca/eng/copyright
NRC Publications Archive Record / Notice des Archives des publications du CNRC :
https://nrc-publications.canada.ca/eng/view/object/?id=d9f4e97f-64ff-499b-9b38-655c8c1978ab https://publications-cnrc.canada.ca/fra/voir/objet/?id=d9f4e97f-64ff-499b-9b38-655c8c1978ab
NRC Publications Archive
Archives des publications du CNRC
For the publisher’s version, please access the DOI link below./ Pour consulter la version de l’éditeur, utilisez le lien DOI ci-dessous.
https://doi.org/10.4224/8895031
Access and use of this website and the material on it are subject to the Terms and Conditions set forth at
DECICE simulation of ice gouging by breakable ice ridges: a brief data report
National Research Council Canada Institute for Ocean Technology Conseil national de recherches Canada Institut des technologies oc ´eaniques
Laboratory Memorandum
LM-2006-08
DECICE Simulation of Ice Gouging by Breakable Ice
Ridges: A Brief Data Report
M. Lau
DOCUMENTATION PAGE
REPORT NUMBER
LM-2006-08
NRC REPORT NUMBER DATE
November 2006
REPORT SECURITY CLASSIFICATION
Unclassified
DISTRIBUTION
Unlimited
TITLE
DECICE SIMULATION OF ICE GOUGING BY BREAKABLE ICE RIDGES: A BRIEF DATA REPORT
AUTHOR(S)
Michael Lau
CORPORATE AUTHOR(S)/PERFORMING AGENCY(S)
Institute for Ocean Technology, National Research Council, St. John’s, NL PUBLICATION
SPONSORING AGENCY(S)
Institute for Ocean Technology, National Research Council, St. John’s, NL
IMD PROJECT NUMBER
PJ2019 and PJ2053
NRC FILE NUMBER
KEY WORDS
DECICE, Ice Gouging, Ridge, Simulation
PAGES 9, App. A-B FIGS. 3 TABLES 2 SUMMARY
The Cambridge University has sought assistance from IOT for computer simulations of the gouging process using DECICE. The objective of this project was to study the conditions in which an ice keel will break up, partially or completely, when in contact with the seabed during the process of ice gouging. The ice friction angle and the cohesion of ice were the two key parameters investigated, as they have a significant effect on the fracture of breakable ice ridges. The data obtained from DECICE aimed to establish a relationship between the fracture of ice ridges and their mechanical properties. At the writing of this memorandum, we have only completed simulations with varying ice friction, seabed inclination and trajectory angle. This memorandum documents the results of these simulations.
ADDRESS National Research Council Institute for Ocean Technology Arctic Avenue, P. O. Box 12093 St. John's, NL A1B 3T5
National Research Council Conseil national de recherches Canada Canada Institute for Ocean Institut des technologies Technology océaniques
DECICE SIMULATION OF ICE GOUGING BY BREAKABLE ICE
RIDGES:
A BRIEF DATA REPORT
LM-2006-08Michael Lau November 2006
ABSTRACT
The Cambridge University has sought assistance from IOT for computer simulations of the gouging process using DECICE. The objective of this project was to study the conditions in which an ice keel will break up, partially or completely, when in contact with the seabed during the process of ice gouging. The ice friction angle and the cohesion of ice were the two key parameters investigated, as they have a significant effect on the fracture of breakable ice ridges. The data obtained from DECICE aimed to establish a relationship between the fracture of ice ridges and their mechanical
properties.
IOT was primarily responsible for the DECICE simulations of the problem and the transfer of results obtained for analysis work. At the writing of this memorandum, we have only completed simulations with varying ice friction, seabed inclination and trajectory angle. This memorandum documents the results of these simulations.
TABLE OF CONTENTS
Abstract...i
1.0 INTRODUCTION...1
2.0 PROBLEM SET-UP ...2
3.0 RESULTS...4
4.0 DISCUSSIONS AND CONCLUSIONS...8
5.0 References...9
LIST OF TABLES Table 1: Test Matrix... 2
Table 2: Summary of pressure data ... 4
LIST OF FIGURES Figure 1: Typical initial configuration of ridge keel/sea bed system... 3
Figure 2: Typical force-time history... 7
Figure 3: Pressure development over time... 8
APPENDICES
Appendix A: Force and Moment Time Histories for Each Run Appendix B: Selected Snapshots for Each Run
DECICE SIMULATION OF ICE GOUGING
1.0 INTRODUCTION
Seabed gouging by ice is a potentially serious problem for Arctic marine pipelines and other seabed structures. Due to the influence of large deformations that extend below the gouge base, a pipeline may need to be trenched well below the maximum expected gouging depth. The cost of deep trenching is high enough to threaten to make some projects uneconomic.
The Institute for Ocean Technology (IOT), in collaboration with C-CORE and MUN, has conducted a preliminary study of the problem using DECICE, discrete element software. Details of the modeling and results were published by Lau et al (2000).
Dr. Palmer and Mr. Paul Lee of Cambridge University have sought assistance from IOT for additional computer simulations of the gouging process using DECICE. The
objective of this project was to study the conditions in which an ice keel will break up, partially or completely, when in contact with the seabed during the process of ice gouging. The ice friction angle and the cohesion of ice were the two key parameters investigated, as they have a significant effect on the fracture of breakable ice ridges. The data obtained from DECICE aimed to establish a relationship between the fracture of ice ridges and their mechanical properties.
IOT was primarily responsible for the DECICE simulations of the problem and the transfer of results obtained for analysis work. At the writing of this memorandum, we have only completed simulations with varying ice friction, seabed inclination and trajectory angle. This memorandum documents the results of these simulations.
DECICE SIMULATION OF ICE GOUGING
2.0 PROBLEM SET-UP
The DECICE model developed in the preliminary DECICE study (Lau et al, 2000) was used in this investigation. Lau et al’s paper gives details of the model. Table 1 shows the test matrix with the following standard ridge characteristics:
• Density of ice: 900kg/m3
• Density of water: 1024kg/m3
• Rigid plate boundary at sea level: ice blocks compact due to buoyancy force
• Keel width: 81m • Keel depth: 13m • Repose angle: 24o
• Ice block thickness: 0.5m • Ice block width: 1m • Number of blocks: 950
• Seabed load plate: 37.5m (Runs 2-1 to 2-5) and 75m (Runs 3-1 to 3-5)
Table 1: Test matrix Test Number (#) Seabed Inclination α (o) Cohesion c (kPa) Ice Friction µ Horizontal Velocity Vh (m/s) Vertical Velocity Vv (m/s) Trajectory Angle β (deg) 2-1 5 0 0.4 0.4 0.1 15 2-2 5 0 0.6 0.4 0.1 15 2-3 5 0 0.8 0.4 0.1 15 2-4 10 0 0.8 0.4 0.1 15 2-5 1 0 0.8 0.4 0.1 15 3-1 5 0 0.4 0.4 0.03 5 3-2 5 0 0.6 0.4 0.03 5 3-3 5 0 0.8 0.4 0.03 5 3-4 10 0 0.8 0.4 0.07 10 3-5 1 0 0.8 0.4 0.07 1 The simulations began at t = 28.2s; enough time to allow the loading plate to move
vertically to contact the ridge keel with an initial width of 7.76m, 6.96m, and 5.45m for seabed inclination angles of 5o, 10o, and 1o, respectively. This resulted in pre-stress in the keel. Once the plate was allowed to move horizontally at the start of the
stimulations, this pre-stress was rapidly released. Hence, this pre-stress is artificial and does not have any influence on subsequent contact pressure. The simulations were conducted until the load plate completely penetrated the keel base. Runs 2-1 to 2-5
DECICE SIMULATION OF ICE GOUGING
have a trajectory angle of 15 degrees, while Runs 3-1 to 3-5 have trajectory angles equal to the respective seabed inclinations. Figure 1 shows a typical initial configuration of the ridge keel/sea bed system.
DECICE SIMULATION OF ICE GOUGING
3.0 RESULTS
The required outputs were: maximum nominal pressure, pressure at peak events, pressure-time history graph, and snap shots of the different initial configurations of the ridge keel/sea bed system.
The pressure data is summarized in Table 2. A typical force-time history (Run 2-2) is shown in Figure 2. The ice forces increased with increase contact. Individual peak events can be identified in the time history. The contact force at each peak event was identified from the time histories and the corresponding contact width was then
estimated from the geometry snapshots. This information was used to compute the contact pressure.
Table 2: Summary of pressure data
Run Time (s) Fh (kN) Fv (kN) Fn (kN) (nom) Base Wnom (m) (KPa) Pnom
39.3 180 -680 120 11.72 11.76 10.20 41.7 240 -710 177 11.95 12.00 14.77 43.3 301 -1140 200 11.86 11.91 16.84 44.6 180 -770 112 11.77 11.81 9.50 49.1 609 -1850 445 11.77 11.81 37.70 2-1 49.9 490 -1970 316 11.95 12.00 26.38 35.7 120 -350 89 10.81 10.85 8.21 40.2 250 -740 185 11.51 11.55 15.97 44.4 610 -1490 478 11.95 12.00 39.83 45.5 430 -1370 309 11.95 12.00 25.76 46.6 430 -1130 330 11.95 12.00 27.50 2-2 49.3 550 -1720 398 11.60 11.64 34.18 33.5 170 -380 136 11.07 11.11 12.26 40.6 400 -1240 290 11.95 12.00 24.21 45.3 1150 -2530 925 11.60 11.64 79.45 48.2 1340 -3890 996 11.42 11.46 86.87 2-3 49.9 1890 -4570 1485 11.77 11.81 125.65 31.3 140 -410 67 9.22 9.36 7.12 35.7 450 -960 276 10.41 10.57 26.15 37.9 300 -1190 89 10.50 10.66 8.33 39.3 220 -690 97 10.01 10.16 9.53 43.3 300 -880 143 10.89 11.06 12.90 2-4 49.1 1320 -2840 807 10.63 10.79 74.74 4
DECICE SIMULATION OF ICE GOUGING
Table 2: Summary of pressure data (cont’d)
Run Time (s) Fh (kN) Fv (kN) Fn (kN) (nom) Base Wnom (m) (KPa) Pnom
38 0 230 -550 220 11 60 11 60 18 99 43.4 500 -220 496 11.16 11.16 44.45 45.1 414 -992 397 11.07 11.07 35.82 45.7 486 -956 469 11.24 11.24 41.74 46.6 341 -992 324 11.42 11.42 28.34 47.3 370 -956 353 11.46 11.46 30.82 48.2 402 -992 385 11.51 11.51 33.41 2-5 49.8 472 -1300 449 11.95 11.95 37.59 34.9 23 -48 19 6.46 6.48 2.89 37.6 59 -84 51 11.45 11.49 4.46 40.1 45 -56 39 12.46 12.51 3.16 42.6 30 -56 25 10.33 10.37 2.43 44.6 45 -56 39 8.21 8.24 4.79 52.0 273 -513 227 13.68 13.73 16.55 57.0 416 -827 342 14.19 14.24 24.03 59.0 244 -584 193 14.09 14.14 13.61 60.8 202 -470 160 13.98 14.03 11.38 62.0 216 -470 174 15.05 15.11 11.52 65.4 230 -427 192 15.96 16.02 11.98 68.9 244 -541 196 15.81 15.87 12.37 73.4 202 -456 161 14.39 14.44 11.15 79.8 430 -1070 335 12.38 12.43 26.99 81.3 316 -898 236 13.68 13.73 17.21 86.3 330 -770 262 12.92 12.97 20.19 3-1 88.8 273 -756 206 13.07 13.12 15.71 34.2 16 -33 13 6.08 6.10 2.21 36.1 29 -45 25 9.73 9.77 2.53 39.4 90 -181 74 11.55 11.59 6.39 41.1 115 -169 100 11.39 11.43 8.72 55.5 311 -638 255 16.27 16.33 15.59 59.0 201 -416 164 15.20 15.26 10.72 62.0 385 -736 319 15.65 15.71 20.34 63.5 324 -711 260 15.88 15.94 16.33 67.9 225 -452 185 16.34 16.40 11.27 69.9 250 -489 206 15.66 15.72 13.12 74.9 373 -859 297 14.64 14.70 20.18 76.4 361 -687 299 14.59 14.65 20.43 81.3 238 -489 194 14.87 14.93 12.99 3-2 86.3 299 -452 258 13.38 13.43 19.24
DECICE SIMULATION OF ICE GOUGING
Table 2: Summary of pressure data (cont’d)
Run Time (s) Fh (kN) Fv (kN) Fn (kN) (nom) Base Wnom (m) (KPa) Pnom
33 4 28 -56 23 6 95 6 98 3 30 38.6 14 -70 8 10.34 10.38 0.76 41.1 42 -84 35 12.00 12.05 2.87 44.6 126 -304 99 13.38 13.43 7.37 46.6 154 -325 125 13.38 13.43 9.31 49.6 126 -304 99 13.98 14.03 7.06 51.6 140 -360 108 14.59 14.65 7.38 55.6 234 -402 198 16.11 16.17 12.25 57.1 178 -388 144 16.01 16.07 8.93 59.1 192 -409 156 16.05 16.11 9.66 61.6 318 -566 267 15.81 15.87 16.85 64.1 395 -856 319 15.81 15.87 20.09 66.0 290 -559 240 16.57 16.63 14.44 69.5 444 -1010 354 16.11 16.17 21.91 73.5 388 -814 316 12.92 12.97 24.33 78.0 220 -402 184 13.22 13.27 13.87 80.5 206 -388 171 15.50 15.56 11.02 85.5 248 -706 186 15.00 15.06 12.32 3-3 87.5 206 -360 174 15.10 15.16 11.47 38.6 310 -776 171 13.38 13.59 12.55 41.6 853 -1500 580 13.68 13.89 41.72 43.0 672 -1500 401 15.35 15.59 25.75 46.3 1577 -2947 1041 16.11 16.36 63.65 50.1 2300 -4700 1449 19.15 19.45 74.50 53.0 3000 -5700 1965 19.15 19.45 101.03 54.7 2400 -5900 1339 19.46 19.76 67.76 57.5 3400 -7700 2011 19.15 19.45 103.43 60.2 4400 -9700 2649 19.15 19.45 136.22 62.9 5400 -12600 3130 19.15 19.45 160.96 64.6 6000 -12800 3686 19.15 19.45 189.56 65.6 5400 -12300 3182 19.15 19.45 163.64 67.9 4800 -9300 3112 18.54 18.83 165.31 3-4 69.2 3700 -7600 2324 17.63 17.90 129.82 41.2 2 -4 1.63 5.28 5.28 0.31 46.3 4 -6 3.54 5.85 5.85 0.61 49.1 5 -8 4.48 5.77 5.77 0.78 50.4 19 -38 18.33 5.47 5.47 3.35 52.9 11 -33 10.42 4.86 4.86 2.14 58.0 6 -10 5.42 3.04 3.04 1.78 60.8 11 -17 10.70 3.34 3.34 3.20 63.1 13 -23 12.60 3.65 3.65 3.45 71.9 11 -23 10.60 9.12 9.12 1.16 78.0 15 -28 14.51 5.17 5.17 2.81 3-5 82.2 31 -77 29.65 4.70 4.70 6.31 6
DECICE SIMULATION OF ICE GOUGING
Figure 2: Typical force-time history
Time histories for the forces and the moment for each run are documented in Appendix A. A selected set of snapshots for each run is given in Appendix B.
DECICE SIMULATION OF ICE GOUGING
4.0 DISCUSSIONS AND CONCLUSIONS
These series of simulations supplement the previous work (Lau et al, 2000). For background information and additional analysis, the reader should refer to Lau et al (2000). When modeling the keel as a frictional material (with zero cohesion), the
functional relationship given in Lau et al between the internal friction and the ice friction coefficient should be used.
Data documented in Table 2 is of a preliminary nature. For example, the pressure values given at times beyond t=42 for Run 3-4 were suspicious as the loading plate was substantially interacting with the fixed top plate. For the 3* series, an extra data
reduction at an earlier part of the interaction may give a better comparison with the 2* series. We will revise Table 2 accordingly.
The pressure development over time for each run is given in Figure 3. (Run 3-4 was not plotted based on the reason stated above.). The figure suggests a large influence of trajectory angle on pressure development.
Figure 3: Pressure development over time
DECICE SIMULATION OF ICE GOUGING
5.0 REFERENCES
Lau, M., Phillips, R., McKenna, R.F., and S.J. Jones, “Discrete Element Simulation of Ridge Keel Resistance during Scouring: A Preliminary Study,” Proc. 2nd Ice Scour & Arctic Marine Pipelines Workshop, Mombetsu, Hokkaido, Japan, 2000.
DECICE SIMULATION OF ICE GOUGING
Appendix A
DECICE SIMULATION OF ICE GOUGING
Figure A-1: Force-time history for run 2-1
DECICE SIMULATION OF ICE GOUGING
Figure A-3: Force-time history for run 2-3
Figure A-4: Force-time history for run 2-4
DECICE SIMULATION OF ICE GOUGING
Figure A-5: Force-time history for run 2-5
DECICE SIMULATION OF ICE GOUGING
Figure A-7: Force-time history for run 3-2
Figure A-8: Force-time history for run 3-3
DECICE SIMULATION OF ICE GOUGING
Figure A-9: Force-time history for run 3-4
DECICE SIMULATION OF ICE GOUGING
Appendix B
DECICE SIMULATION OF ICE GOUGING
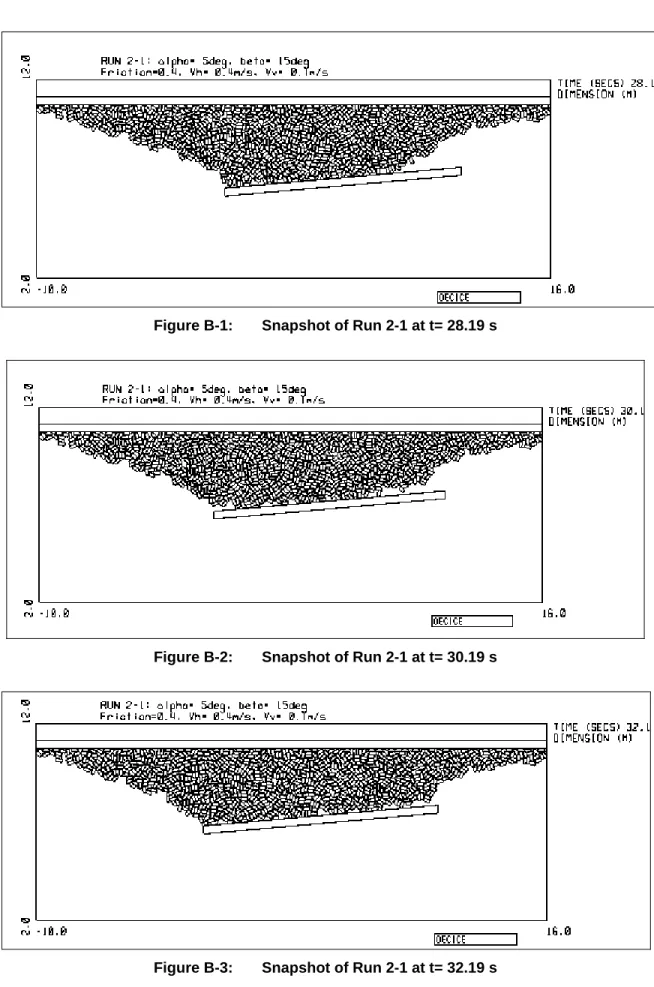
Figure B-1: Snapshot of Run 2-1 at t= 28.19 s
Figure B-2: Snapshot of Run 2-1 at t= 30.19 s
DECICE SIMULATION OF ICE GOUGING
Figure B-4: Snapshot of Run 2-1 at t= 34.19 s
Figure B-5: Snapshot of Run 2-1 at t= 36.19 s
Figure B-6: Snapshot of Run 2-1 at t= 38.19 s
- B-2
DECICE SIMULATION OF ICE GOUGING
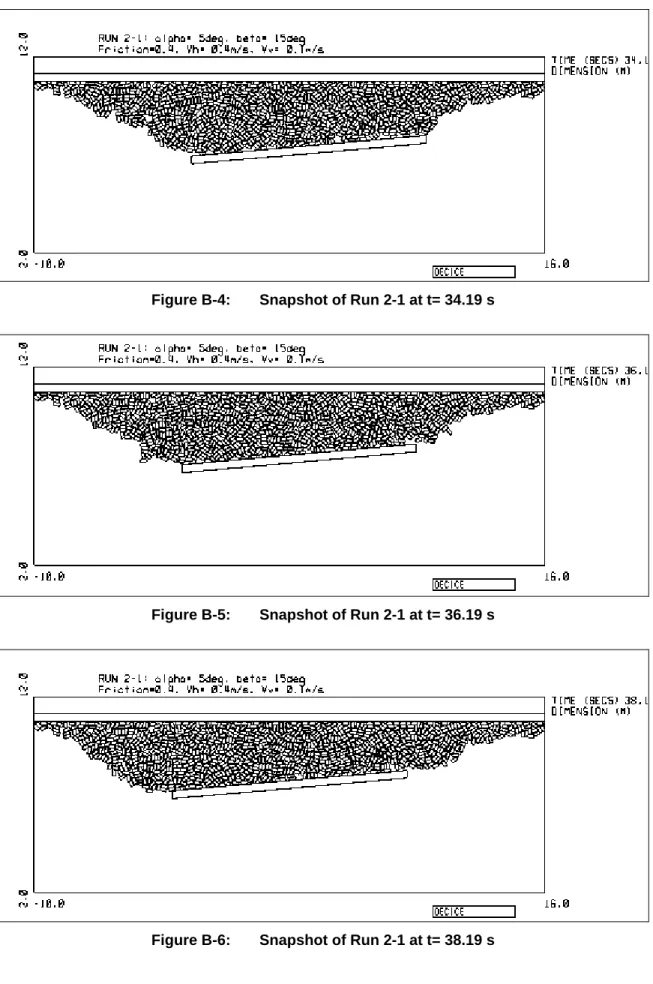
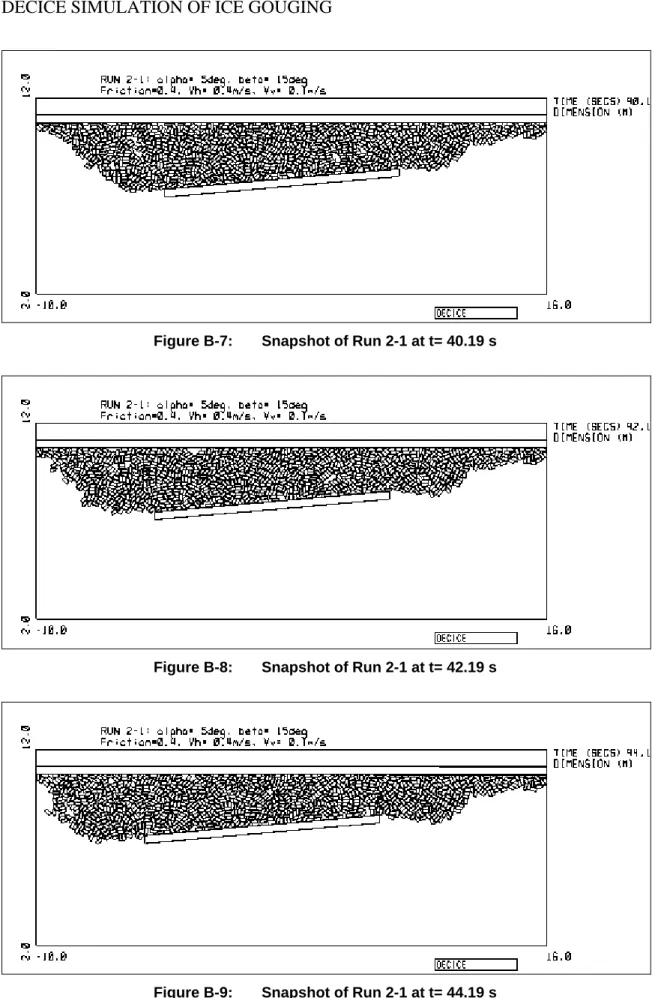
Figure B-7: Snapshot of Run 2-1 at t= 40.19 s
Figure B-8: Snapshot of Run 2-1 at t= 42.19 s
DECICE SIMULATION OF ICE GOUGING
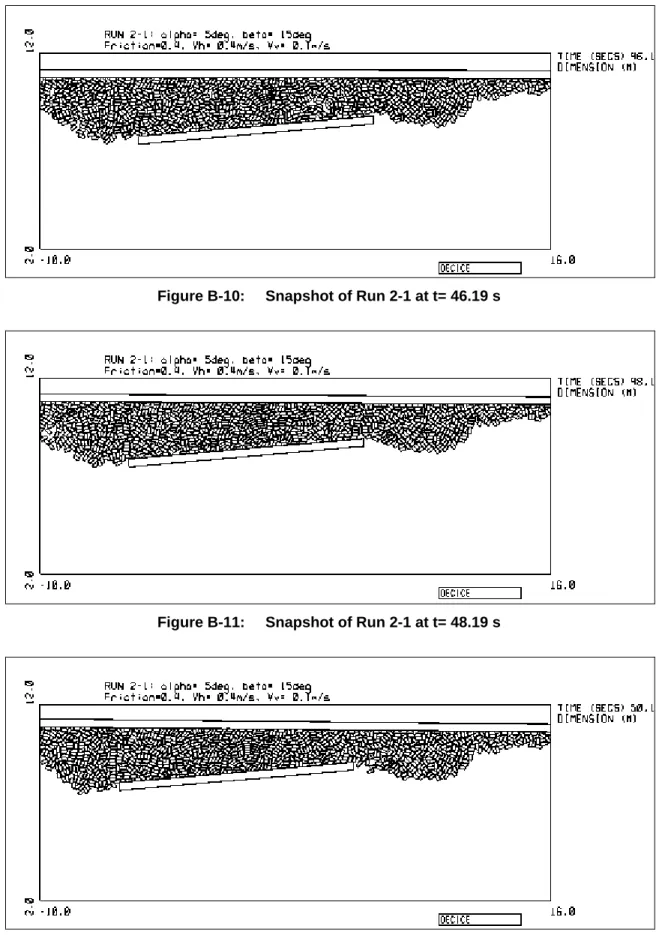
Figure B-10: Snapshot of Run 2-1 at t= 46.19 s
Figure B-11: Snapshot of Run 2-1 at t= 48.19 s
Figure B-12: Snapshot of Run 2-1 at t= 50.19 s
- B-4
DECICE SIMULATION OF ICE GOUGING
Figure B-13: Snapshot of Run 2-2 at t= 28.19 s
Figure B-14: Snapshot of Run 2-2 at t= 30.19 s
DECICE SIMULATION OF ICE GOUGING
Figure B-16: Snapshot of Run 2-2 at t= 34.19 s
Figure B-17: Snapshot of Run 2-2 at t= 36.19 s
Figure B-18: Snapshot of Run 2-2 at t= 38.19 s
- B-6
DECICE SIMULATION OF ICE GOUGING
Figure B-19: Snapshot of Run 2-2 at t= 40.19 s
Figure B-20: Snapshot of Run 2-2 at t= 42.19 s
DECICE SIMULATION OF ICE GOUGING
Figure B-22: Snapshot of Run 2-2 at t= 46.19 s
Figure B-23: Snapshot of Run 2-2 at t= 48.19 s
Figure B-24: Snapshot of Run 2-2 at t= 50.19 s
- B-8
DECICE SIMULATION OF ICE GOUGING
Figure B-25: Snapshot of Run 2-3 at t= 28.19 s
Figure B-26: Snapshot of Run 2-3 at t= 30.19 s
DECICE SIMULATION OF ICE GOUGING
Figure B-28: Snapshot of Run 2-3 at t= 34.19 s
Figure B-29: Snapshot of Run 2-3 at t= 36.19 s
Figure B-30: Snapshot of Run 2-3 at t= 38.19 s
- B-10
DECICE SIMULATION OF ICE GOUGING
Figure B-31: Snapshot of Run 2-3 at t= 40.19 s
Figure B-32: Snapshot of Run 2-3 at t= 42.19 s
DECICE SIMULATION OF ICE GOUGING
Figure B-34: Snapshot of Run 2-3 at t= 46.19 s
Figure B-35: Snapshot of Run 2-3 at t= 48.19 s
Figure B-36: Snapshot of Run 2-3 at t= 50.19 s
- B-12
DECICE SIMULATION OF ICE GOUGING
Figure B-37: Snapshot of Run 2-4 at t= 28.19 s
Figure B-38: Snapshot of Run 2-4 at t= 30.19 s
DECICE SIMULATION OF ICE GOUGING
Figure B-40: Snapshot of Run 2-4 at t= 34.19 s
Figure B-41: Snapshot of Run 2-4 at t= 36.19 s
Figure B-42: Snapshot of Run 2-4 at t= 38.19 s
- B-14
DECICE SIMULATION OF ICE GOUGING
Figure B-43: Snapshot of Run 2-4 at t= 40.19 s
Figure B-44: Snapshot of Run 2-4 at t= 42.19 s
DECICE SIMULATION OF ICE GOUGING
Figure B-46: Snapshot of Run 2-4 at t= 46.19 s
Figure B-47: Snapshot of Run 2-4 at t= 48.19 s
Figure B-48: Snapshot of Run 2-4 at t= 50.19 s
- B-16
DECICE SIMULATION OF ICE GOUGING
Figure B-49: Snapshot of Run 2-5 at t= 28.19 s
Figure B-50: Snapshot of Run 2-5 at t= 30.19 s
DECICE SIMULATION OF ICE GOUGING
Figure B-52: Snapshot of Run 2-5 at t= 34.19 s
Figure B-53: Snapshot of Run 2-5 at t= 36.19 s
Figure B-54: Snapshot of Run 2-5 at t= 38.19 s
- B-18
DECICE SIMULATION OF ICE GOUGING
Figure B-55: Snapshot of Run 2-5 at t= 40.19 s
Figure B-56: Snapshot of Run 2-5 at t= 42.19 s
DECICE SIMULATION OF ICE GOUGING
Figure B-58: Snapshot of Run 2-5 at t= 46.19 s
Figure B-59: Snapshot of Run 2-5 at t= 48.19 s
Figure B-60: Snapshot of Run 2-5 at t= 50.19 s
- B-20
DECICE SIMULATION OF ICE GOUGING
Figure B-61: Snapshot of Run 3-1 at t= 28.2 s
Figure B-62: Snapshot of Run 3-1 at t= 32.2 s
Figure B-63: Snapshot of Run 3-1 at t= 36.2 s
DECICE SIMULATION OF ICE GOUGING
Figure B-65: Snapshot of Run 3-1 at t= 44.2 s
Figure B-66: Snapshot of Run 3-1 at t= 48.2 s
Figure B-67: Snapshot of Run 3-1 at t= 52.2 s
Figure B-68: Snapshot of Run 3-1 at t= 56.2 s
- B-22
DECICE SIMULATION OF ICE GOUGING
Figure B-69: Snapshot of Run 3-1 at t= 60.2 s
Figure B-70: Snapshot of Run 3-1 at t= 64.2 s
Figure B-71: Snapshot of Run 3-1 at t= 68.2 s
DECICE SIMULATION OF ICE GOUGING
Figure B-73: Snapshot of Run 3-1 at t= 76.2 s
Figure B-74: Snapshot of Run 3-1 at t= 80.2 s
Figure B-75: Snapshot of Run 3-1 at t= 84.2 s
Figure B-76: Snapshot of Run 3-1 at t= 88.2 s
- B-24
DECICE SIMULATION OF ICE GOUGING
Figure B-77: Snapshot of Run 3-1 at t= 92.2 s
Figure B-78: Snapshot of Run 3-2 at t= 28.2 s
Figure B-79: Snapshot of Run 3-2 at t= 32.2 s
DECICE SIMULATION OF ICE GOUGING
Figure B-81: Snapshot of Run 3-2 at t= 40.2 s
Figure B-82: Snapshot of Run 3-2 at t= 44.2 s
Figure B-83: Snapshot of Run 3-2 at t= 48.2 s
Figure B-84: Snapshot of Run 3-2 at t= 52.2 s
- B-26
DECICE SIMULATION OF ICE GOUGING
Figure B-85: Snapshot of Run 3-2 at t= 56.2 s
Figure B-86: Snapshot of Run 3-2 at t= 60.2 s
Figure B-87: Snapshot of Run 3-2 at t= 64.2 s
DECICE SIMULATION OF ICE GOUGING
Figure B-89: Snapshot of Run 3-2 at t= 72.2 s
Figure B-90: Snapshot of Run 3-2 at t= 76.2 s
Figure B-91: Snapshot of Run 3-2 at t= 80.2 s
Figure B-92: Snapshot of Run 3-2 at t= 84.2 s
- B-28
DECICE SIMULATION OF ICE GOUGING
Figure B-93: Snapshot of Run 3-2 at t= 88.2 s
Figure B-94: Snapshot of Run 3-2 at t= 92.2 s
Figure B-95: Snapshot of Run 3-3 at t= 28.2 s
DECICE SIMULATION OF ICE GOUGING
Figure B-97: Snapshot of Run 3-3 at t= 36.2 s
Figure B-98: Snapshot of Run 3-3 at t= 40.2 s
Figure B-99: Snapshot of Run 3-3 at t= 44.2 s
Figure B-100: Snapshot of Run 3-3 at t= 48.2 s
- B-30
DECICE SIMULATION OF ICE GOUGING
Figure B-101: Snapshot of Run 3-3 at t= 52.2 s
Figure B-102: Snapshot of Run 3-3 at t= 56.2 s
Figure B-103: Snapshot of Run 3-3 at t= 60.2 s
DECICE SIMULATION OF ICE GOUGING
Figure B-105: Snapshot of Run 3-3 at t= 68.2 s
Figure B-106: Snapshot of Run 3-3 at t= 72.2 s
Figure B-107: Snapshot of Run 3-3 at t= 76.2 s
Figure B-108: Snapshot of Run 3-3 at t= 80.2 s
- B-32
DECICE SIMULATION OF ICE GOUGING
Figure B-109: Snapshot of Run 3-3 at t= 84.2 s
Figure B-110: Snapshot of Run 3-3 at t= 88.2 s
Figure B-111: Snapshot of Run 3-3 at t= 92.2 s
DECICE SIMULATION OF ICE GOUGING
Figure B-113: Snapshot of Run 3-4 at t= 30.2 s
Figure B-114: Snapshot of Run 3-4 at t= 32.2 s
Figure B-115: Snapshot of Run 3-4 at t= 34.2 s
Figure B-116: Snapshot of Run 3-4 at t= 36.2 s
- B-34
DECICE SIMULATION OF ICE GOUGING
Figure B-117: Snapshot of Run 3-4 at t= 38.2 s
Figure B-118: Snapshot of Run 3-4 at t= 40.2 s
Figure B-119: Snapshot of Run 3-4 at t= 42.2 s
DECICE SIMULATION OF ICE GOUGING
Figure B-121: Snapshot of Run 3-4 at t= 46.2 s
Figure B-122: Snapshot of Run 3-4 at t= 48.2 s
Figure B-123: Snapshot of Run 3-4 at t= 50.2 s
Figure B-124: Snapshot of Run 3-4 at t= 52.2 s
- B-36
DECICE SIMULATION OF ICE GOUGING
Figure B-125: Snapshot of Run 3-4 at t= 54.2 s
Figure B-126: Snapshot of Run 3-4 at t= 56.2 s
Figure B-127: Snapshot of Run 3-4 at t= 58.2 s
DECICE SIMULATION OF ICE GOUGING
Figure B-129: Snapshot of Run 3-4 at t= 62.2 s
Figure B-130: Snapshot of Run 3-4 at t= 64.2 s
Figure B-131: Snapshot of Run 3-4 at t= 66.2 s
Figure B-132: Snapshot of Run 3-4 at t= 68.2 s
- B-38
DECICE SIMULATION OF ICE GOUGING
Figure B-133: Snapshot of Run 3-4 at t= 70.2 s
Figure B-134: Snapshot of Run 3-5 at t= 28.2 s
Figure B-135: Snapshot of Run 3-5 at t= 32.2 s
DECICE SIMULATION OF ICE GOUGING
Figure B-137: Snapshot of Run 3-5 at t= 40.2 s
Figure B-138: Snapshot of Run 3-5 at t= 44.2 s
Figure B-139: Snapshot of Run 3-5 at t= 48.2 s
Figure B-140: Snapshot of Run 3-5 at t= 52.2 s
- B-40
DECICE SIMULATION OF ICE GOUGING
Figure B-141: Snapshot of Run 3-5 at t= 56.2 s
Figure B-142: Snapshot of Run 3-5 at t= 60.2 s
Figure B-143: Snapshot of Run 3-5 at t= 64.2 s
DECICE SIMULATION OF ICE GOUGING
Figure B-145: Snapshot of Run 3-5 at t= 72.2 s
Figure B-146: Snapshot of Run 3-5 at t= 76.2 s
Figure B-147: Snapshot of Run 3-5 at t= 80.2 s
Figure B-148: Snapshot of Run 3-5 at t= 84.2 s
- B-42
DECICE SIMULATION OF ICE GOUGING