HAL Id: insu-01537985
https://hal-insu.archives-ouvertes.fr/insu-01537985
Submitted on 4 Aug 2020
HAL is a multi-disciplinary open access
archive for the deposit and dissemination of
sci-entific research documents, whether they are
pub-lished or not. The documents may come from
teaching and research institutions in France or
abroad, or from public or private research centers.
L’archive ouverte pluridisciplinaire HAL, est
destinée au dépôt et à la diffusion de documents
scientifiques de niveau recherche, publiés ou non,
émanant des établissements d’enseignement et de
recherche français ou étrangers, des laboratoires
publics ou privés.
Palaeomagnetism of late precambrian-cambrian volcanics
and intrusives from the armorican massif, France
Russell Perigo, Rob van der Voo, Bernard Auvray, Norbert Bonhommet
To cite this version:
Russell Perigo, Rob van der Voo, Bernard Auvray, Norbert Bonhommet. Palaeomagnetism of late
precambrian-cambrian volcanics and intrusives from the armorican massif, France.
Geophysical
Journal International, Oxford University Press (OUP), 1983, 75 (75), pp.235-260.
�10.1111/j.1365-246X.1983.tb01922.x�. �insu-01537985�
Geophys. J. R . astr. Soc. (1983) 75,235-260
Palaeomagnetism of late Precambrian-Cambrian
volcanics
and
intrusives from the Armorican
Massif,
France
Russell Perigo and Rob van der VOO
Department of GeologicalBernard Auvray
and
Norbert Bonhommet
Centre ArmoricainSciences, The University of Michigan, Ann Arbor, Michigan 481 09, USA
d'Ettide Structurale des Socles, L.P. 466 of CMRS, Institut de Ge'ologie, Av. du Ge'ne'raral-Leclerc, 35042 Rennes- Cedex, France
Received 1983 January 14; in original form 1982 June 25
Summary. Samples of the keratophyre tuffs of Trkguier (640 ? 12 Myr) of the Upper Brioverian series, and the microgranite dykes of Loguivy (548 k 24 Myr) have been collected from the north coast of Brittany, France. The samples were progressively demagnetized with AF and, predominantly, thermal methods. Blocking temperatures, coercivities and acquisition of Isothermal Remanent Magnetization (IRM) indicate that the keratophyre remanence is variably carried in magnetite, hematite, or occasionally in both. After removal of a soft viscous component, two stable palaeomagnetic directions were found, one in magnetite, the other in hematite. The charac- teristic magnetite direction (Tb = 300-580°C) is a pre-folding primary Thermoremanent Magnetization (TRM) which after structural correction has a mean declination/inclination of 21 7.9'1-30.4". The younger hematite component has a mean in situ direction of 320.4"/+20.3".
The microgranite Natural Remanent Magnetization (NRM) intensity distri- bution is distinctly bimodal, forming high and low ( G 1.6 x A m-') intensity groups. Upon demagnetization, a single stable remanence (in magnetite) was removed between 300 and 580°C or 20 and l00mT. Two characteristic directions were found to be statistically related to the intensity groups at the 99 per cent confidence level. Low-intensity samples have a mean direction of 201.9"/+2.3' and probably resulted from a Late Devonian
- Early Carboniferous local magnetization. High intensity microgranites have a mean direction of 200"/+50.8' and this remanence is shown to be a primary TRM. Palaeopoles obtained from the two keratophyre magnetizations (magnetite 44.7"N, 116.4'E; hematite 39.5"N, 233.6'E), as well as the high intensity microgranite remanence (5.8'S, 339.9"E), show good agreement with similar age poles from the apparent polar wander path for the Armorican Massif. Comparison of these data t o recent palaeomagnetic data from southern England and Wales gives additional evidence to link that region with the Armorica plate as proposed by Van der Voo and Hagstrum et al.
236 R. Perigo et al.
Introduction
The Atlantic-bordering continents have long been of special interest to palaeomagnetists. Early researchers naturally became involved with questions concerning continental drift and
the opening of the Atlantic ocean (Runcorn 1956). As the concepts of seafloor spreading and plate tectonics became established, attention shifted to pre-Mesozoic times as the existence of older oceans (and their closures) were proposed (Wilson 1966; Hallam 1979). Within the last decade a palaeomagnetic framework has been constructed which can be used to clarify Phanerozoic and Late Proterozoic continental configurations and their relation- ships t o the various well-studied orogenic events in eastern North America and western Europe (Morel & Irving 1978; Scotese et al. 1979; Smith, Hurley & Briden 1980; Van der
Voo, Briden & Duff 1980).
The University of Michigan through a cooperative project with the University of Rennes (France) has initiated studies of the Palaeozoic palaeomagnetism of western middle Europe. The initial goal of this project was to test plate tectonic models proposed for the Late Palaeozoic Hercynian orogeny. To this end, Jones, Van der Voo & Bonhommet (1979) established Devonian and Carboniferous poles from Armorican Massif redbeds which have bearing on the placement of Late Palaeozoic continental suture zones within Hercynian Europe. To clarify pre-Hercynian continental configurations, Hagstrum et al. (1980) sampled igneous rocks (again from the Armorican Massif) with ages ranging from 640 to
546 Myr. Poles from these rocks, combined with poles from the Channel Islands (Hailwood & Garrett 1977; Duff 1978a, b, 1979a, b, 1980a) established an apparent polar wander path (apwp) for this part of Europe. This Armorican apwp is one constraint on tectonic models of orogenies such as the Cadomain, Taconic, Caledonian, Acadian and the Hercynian of Late Precambrian and Palaeozoic times which border the Atlantic realm.
Although much has been accomplished in relatively few years, the palaeomagnetic record for these times is still just emerging. Polarity ambiguities combined with rapid Precambrian apparent polar wander, dating inaccuracies and a general scarcity of palaeomagnetic data, result in apwp's with a variety of interpretations (McWilliams 1980). To overcome this problem, more high quality data must be collected to both fill gaps in and substantiate the palaeomagnetic record. This study, as part of the cooperative project, was initiated t o document the Armorican apwp further and reports palaeomagnetic results from Late Precambrian and Cambrian igneous rocks (time-scale of Van Eysinga 1975) from the 'Armorican Massif.
Two lithologies were sampled; the keratophyre tuffs of Trdguier (640 2 12 Myr) and the microgranite dykes of Loguivy (548 2 24Myr) both dated by whole rock Rb-Sr isochrons recalculated with
X
= 1.42 x 10-"yr-' from Vidal (1976). These samples were collected inthe Tregor region of Brittany, France; a region within the Domnonean structural domain of
the Armorican Massif (Figs 1 and 2 ; see Auvray, Lefort & Monnier 1976a, b; Autran er al.
1980a, b).
Since the time of deformation in the Late Precambrian Cadomian orogeny the TrCgor area has been stable except for vertical epicontinental motions (Rutten 1969; CognC 1974; Auvray 1979; Ager 1980). Even during the Hercynian orogeny, this area virtually escaped metamorphism and deformation; folding was more or less restricted to other areas caught between the basement blocks. The basement blocks themselves (such as TrCgor) were little deformed (CognC 1974; Bard er al. 1980).
Larger-scale Hercynian (post-Devonian) displacements relative to stable Europe include rotations up to 14" (Jones er af. 1979) or more (Bachtadse, Heller &Kroner 1983;Perroud 1983). These resulted from displacements along the large shear faults (see Fig. la) formed during the late stages of the Hercynian orogeny (Cognd 1974; Arthaud & Matte 1975). For
Late Precambrian- Cambrian palaeomagnetism, France 231
OOMNONEAN D O M A I N b
/
MICROGRANITE D I K E\ D O L E R I T E D Y K E
/ - - - -
Figure 1. (a) Tregor study area in Brittany, as indicated b y the arrow. ( b ) T h e Loguivy area shown enlarged with t h e microgranite dykes of this study, t h e DevonoCarboniferous dolerite dykes ( d u Trieux) and the sampling sites of the microgranites: circled numbers indicate t h e low intensity sites, boxed
numbers the host-rock sites. (c) The keratophyre tuff sampling sites shown by triangles (schematic
geological features after Auvray et al. 1976a; (a) after Cogne 1974).
SCHEMATIC CROSS SECTION THROUGH THE BASEMENT HORST OF T R ~ G O R
NNW SSE T R ~ G O R R O I S T R ~ G U I E R - S P I L I T E S D E P A I M P O L
a
DOLLRITE DU TRIEUX FAULT L ~ Z A R D R I E U X TUFS K t R A T O P H Y R l Q U E S D E T R f G U l E R R H Y O L I T E S D E L ~ Z A R D R I E ~ X F A U L T MICROGRANITE M O N Z O N I T I P U E DE L A U N A Y M I C R O G R A N I T E OE LOGUIVY A N D O T H E R B A S E M E N T U N I T S O F T H E 0-
I 2 3 K M T R ~ G O R HORSTFigure 2. Schematic crosssection through the Tregor horst passing through Paimpol and Loguivy and
extending NW (out of t h e map area of Fig. 1) t o Les HCaux. (A) Belt of PlourivoPlouCzec with Cambro-
Ordovician redbeds and volcanics unconformably overlying sedimentary formation of the Upper
Brioverian (Jones et al. 1979). (B) Belt of Treguier-Paimpol, with rhyolites unconformably overlying
schists, greywackes, spilites and keratophyre tuffs of t h e Upper Brioverian. (C) Basement of TrCgor
horst, consisting of a granitic-granodioritic complex, including slices of Pentevrian gneiss and important systems of microgranite and dolerite dykes. (D) Immergent northern flank of t h e Tregor horst with rhyolites unconformably overlying spilites and tuffs of t h e Brioverian, separated from Eocene and
Devonian sediments to the north b y faults (after fig. 5 from Auvray ei al. 1976b. and fig. 15 from
Hagstrum ef al. 1980).
23 8
this study the rotations are less important since all of the palaeomagnetic samples are from the same structural domain; only the relative sequence of poles is of interest here. The relative stability of this region of the Armorican Massif makes it particularly well suited for pre-Hercynian palaeomagnetic studies in middle Europe (Roche 1980).
R. Perigo et al.
Geology, sampling and results
K E R A T O P H Y R E T U F F S O F T R ~ G U I E R
The keratophyre tuffs are exposed in an ENE-trending monocline bordered on the north by the Treguier-Uzardrieux fault of the TrCgor basement horst (Figs 1 and 2). The kerato- phyres belong to a volcanoclastic ensemble of the Upper Brioverian series. Also included in this series are the spilites of Paimpol (640 Myr) sampled for palaeomagnetism by Hagstrum
ef al. (1980), which overlie the keratophyre tuffs. The sedimentary, volcanic, intrusive and
metamorphic characteristics of the Brioverian series here has led to the interpretation of the Domnonean domain as a Late Precambrian (c. 670-580 Myr) island arc complex (Auvray, Charlot & Vidal 1980; Cogr?e &Wright 1980; Roach 1980).
About 160 samples of keratophyre tuffs were collected at 19 sites (eight sites near Treguier and 11 sites near Porz Even in the east, Fig. Ic). Nearly all of the keratophyre samples were collected in the field as drilled cores by A. Dubos and N. Bonhommet (Rennes) and 11. Van der Voo. These cores were oriented by both a magnetic and a solar compass to within errors of +2".
All keratophyre Natural Renianent Mag!ietization (NRM) and demagnetization measure- ments reported here were carried out at the University of Michigan. Samples were measured on one of two magnetometers. In measuring the weaker samples an ScT 1%-inch access cryogenic magnetometer was utilized. The magnetization of the stronger samples was measured with a Schonstedt SSM-IA spinner magnetometer. NRM intensities range from to nearly 1 A m-', having a large skewness (Fig. 3). The reasons for this distribution of intensities will be discussed in more detail later. A laboratory viscosity test (see Perigo 1982 for details) showed the keratophyres to be, overall, fairly viscous; 70 per cent of the samples had viscous components > 2 0 per cent of their NRM intensity. However, certain sites showed essentially no viscous effects. Consequently, NRM directions were often close to a present-day field direction (pdf) but some grouped to the WNW or ESE with moderate to low inclinations.
All samples were stepwise demagnetized using thermal, and t o a much lesser degree, alternating field (AF) methods. Thermal demagnetization was completed using a Schonstedt
"
i
100
Figure 3. Histogram of the NRM intensity of thc keratophyrc tuffs of Trkguier. T h c shading indicates the portion of the distribution contributed by samples containing only magnetite.
Late ~ecambrian- ~ m b r i a n ~ a ~ a e ~ m a ~ n e r i s m , France 239 Thermal Demagnetizer or a non-magnetic furnace maintained in a field-free space by Helmholtz coils and a Schonstedt HCM-3 Triaxial Coil Control Magnetometer feedback system. This feedback system was capable of maintaining a field of 5-10nT or less. AF demagnetization up t o 1 0 0 m T was accomplished through a Schonstedt GSD-1 A C
demagnetizer, The demagnetization data were plotted using Zijderveld (1967) diagrams. Linear sections (trajectories) of these diagrams, defined by at least four points, were used to resolve the various magnetic components of the samples through vector subtraction. Coercivities for most of the keratophyre tuffs were too high for AF demagnetization. Nevertheless, directions obtained from samples with both AF and thermal demagneti- zations on duplicate specimen were in good agreement.
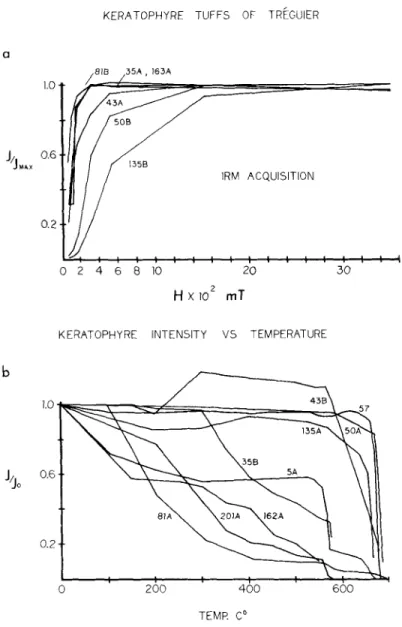
NRM stability and intensity, coercivities, blocking temperatures and Isothermal Remanent Magnetization (IRM) acquisition all indicate that the keratophyre samples can be put into three groups depending on the mineralogy of their magnetic carrier(s). These groups do not on the whole display any geographical preference but are interspersed throughout the sampling area. It was also found that the magnetic directions obtained through demagnetization did not show any correlation with geographical provenance.
Group 1 samples have lower NRM stability (more viscous behaviour) and generally lower NRM intensities; they may have coercivities within the practical range for AF demagneti- zation ( G 100 mT), have blocking temperatures generally less than 580"C, and are rapidly saturated (5300mT) in IRM acquisition (see samples 35, 162, 163; Fig. 4a, b). These characteristics are compatible with a remanence carried in magnetite (McElhinny 1973). Polished thin sections in reflected light reveal a few large (1 50-250 pin), often euhedral, essentially unaltered magnetite crystals. More important are aggregates of small (2-5 pm), euhedral magnetite inclusions in chloritized amphibole (see Auvray et aE. 1976b). Also found are euhedral ilmenite crystals, altered to leucoxene, with 'ghost' lattice work remain- ing from exsolution laminae. Small (2-5 pni) magnetite? grains are often preserved within this lattice work. Although hematite pigment is common, more substantial masses are rare.
Group 2 samples have very high NRM stability and intensities; they have coercivities beyond the range of the AF demagnetizer (> lOOmT), have very high blocking temperatures with most of the intensity eliminated between 650 and 680"C, and saturate gradually in IRM acquisition (see samples 50, 135: Fig. 4a, b). These characteristics suggest that hematite is the magnetic carrier in these samples. Thin sections contain abundant grains and aggregates
of hematite. The large (c. 200pm) magnetite crystals (as well as the finer grains) seen in the group 1 samples are here strongly altered t o hematite. Hematite is often found as rims or
skeleton aggregates of grains around, or in, the altered remains of iron-rich minerals. Often only a hematite outline is all that clearly remains of such minerals. Aligned streaks of bright red translucent hematite are preferentially found within the large feldspar phenocrysts while a duller hematite pigment is abundant in veins throughout these samples.
Group 3 combines characteristics of both groups 1 and 2 to varying degrees. Blocking temperatures span a broad range with sharp drops in intensity near 580 as well as 680°C.
IRM acquisition curves may be very similar to those of group 1 samples or they may show
intermediate behaviour between group 1 and group 2 curves (see samples 4 3 , 8 1 ; Fig. 4a, b). Thin sections also display characteristics intermediate to groups 1 and 2 samples. For these reasons a combination of magnetite and hematite is proposed as the magnetic carriers in group 3 samples.
The demagnetization diagrams of group 1 (magnetite) samples tend to have a soft compo- nent with a direction often, but not always, close to that of the pdf. This component is removed around 300°C or 20 mT. The magnetization of most of these samples then decays univectorially towards the origin (Fig. 5a and c), sometimes with a large portion of the
240 R. Perigo et al. KERATOPHYRE TUFFS OF T R ~ G U I E R a 1.0 0.6 ' / J M IRM ACQUISITION 0.2 0 2 4 6 8 10 20 3 0 H X I O ' mT
KERATOPHYRE INTENSITY V 5 TEMPERATURE
b
1.0 0.6 0.2 0 200 400 600 TEMP C aFigure 4. Magnetic properties of the keratophyre tuffs of Trcguier. (a) IRM acquisition curves. ( b )
Intensity versus temperature curves during thermal demagnetization of the NRM.
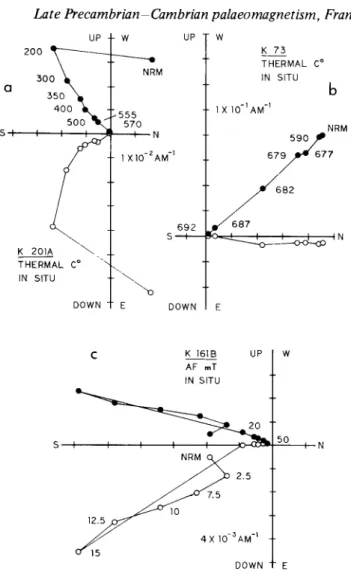
intensity of this stable component being removed within a few degrees of 580°C. This component, in situ, is to the SW with shallow to intermediate downward inclinations; we will call this the characteristic magnetite magnetization. Only one group 1 site (#98) has blocking temperatures so low as to preclude isolation of this characteristic direction.
Demagnetization of group 2 (hematite) samples display univectorial decay with a characteristic 'hematite' direction with in siru NW declinations and usually shallow to moderate downward inclinations (Fig. 5b). However, directions antipodal to this NW and down direction are also found in a few sites. Hematite-bearing samples occasionally showed upward, rather than downward directions, but they are always north-westerly in declination.
Diagrams of group 3 samples (magnetite and hematite) naturally show aspects of both group 1 and group 2 behaviour. Group 3 , or 'mixed', samples usually are multivectorial in
Late Precambrian-Cambrian palaeomagnetism, France UP
+
w UP T W 24 1 DOWNt
E DOWNI
E C AF mT IN SlTU t N DOWNt
EFigure 5. Orthogonal demagnetization projections (Zijderveld 1967) of the keratophyre tuffs of TrBguier. Solid circles represent projections o n to the horizontal plane; open circles those on the north-
south vertical plane. (a) Group ( 1 ) magnetite sample. (b) Group (2) hematite sample. (c) Group (1)
sample with A F demagnetization.
nature. However, occasionally after removing a soft component there is univectorial decay to the origin with blocking temperatures from 300 to 680°C. These samples show the characteristic hematite declination (to the NW or SE in situ) but, as mentioned previously, there are suggestions of the presence of some magnetite. If magnetite in these samples carries a magnetization different from that of the hematite, then it is apparently restricted to the large soft components removed by 300°C (see sample 81, Figs 4a, b and 6).
Mixed sites may contain up to three or four components. One of these is always the hematite direction held in the highest blocking temperatures. Often associated with this is a component contained in lower blocking temperatures sometimes reaching 580°C similar to the characteristic magnetite directions of group 1 (Fig. 6c: 200-565°C). Less frequently a third component appears to be present in lower blocking temperatures (250-400°C) with directions like those of the magnetite, but with somewhat steeper downward inclinations (Fig. 6b). Because this third component is intermediate between the soft pdf direction and
242 UP W !200y565 IN SlTU NRM S I : I N s : K > C THERMAL C" B X 10-3AM" 680 R. Perigo et al. UP 1 w NRM --2oo 150
jl
005:)--
6 6 5 6 5 5 : 4N U P 1 wthe characteristic magnetite direction, it can be assumed that this is not a real ancient magnetization, but rather that it results from simultaneous removal of the other two components.
Thus from the demagnetization diagrams three directions of magnetization are apparent:
(1) a characteristic magnetite in situ direction to the SW and of variable inclination (as well as antipodal directions), ( 2 ) a hematite direction (in situ) to the NW and generally down (or antipodal directions) and (3) a low-temperature, 'soft' and often northerly, direction with steep positive inclinations, thought to be of recent viscous origin.
The structural trends at the keratophyre sampling sites are quite consistent with generally ENE strikes and dips steeply to the south (Table 1). This, combined with the fact that not
Late Precambrian- Cambrian palaeomagnetism, France 243
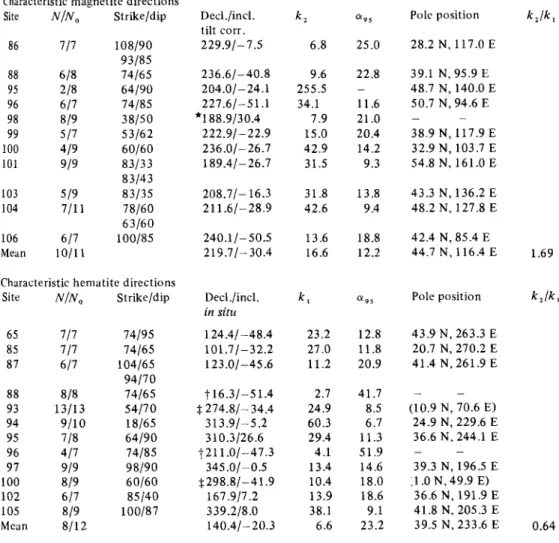
Table 1. Site means and group means of the keratophyre tuffs of TrBguier.
Characteristic magnetite directions
Site N f N , Strikeldip 86 88 95 96 98 99 100 101 103 104 106 Mean 108190 93/85 74/65 64/90 74/85 3 815 0 53/62 60160 83/33 83/43 83/35 78/60 63/60 l00/85
Characteristic hematite directions
Site N f N , Strikeldip 65 717 85 7 17 87 617 88 818 93 13/13 94 9/10 95 718 96 417 97 919 100 819 102 617 105 8 I 9 Mean 8/12 74/95 74/65 104165 94/70 74/65 54/70 18/65 64/90 74/85 98/90 60160 85/40 100/87 Decl./incl. tilt c o n . 229.91- 7.5 236.61-40.8 204.01-24.1 227.61-51.1 *188.9/30.4 222.91-22.9 236.01-26.7 189.41- 26.7 208.7/- 16.3 2 1 1.61-28.9 240.11-50.5 219.71-30.4 Decl./incl. in situ 1 24.41 -48.4 101.71-32.2 123.01-45.6
t
16 3 - 5 1.4 $274.81-34.4 3 10.3126.6 3 1 3.91-5.2 t211.0/-47.3 345 .O/-0.5 $298.81-41.9 167.917.2 339.218.0 140.41-20.3 k2 6.8 9.6 255.5 34.1 7.9 15.0 42.9 31.5 31.8 42.6 13.6 16.6 k , 23.2 27 .O 11.2 2.7 24.9 60.3 29.4 4.1 13.4 10.4 13.9 38.1 6.6 % s 25.0 22.8 11.6 21.o
20.4 14.2 9.3 13.8 9.4 18.8 12.2 - 0 1 9 s 12.8 11.8 20.9 41.7 8.5 6.7 11.3 51.9 14.6 18.0 18.6 9.1 23.2 Polc position k J k , 28.2 N, 117.0 E 39.1 N, 95.9 E 48.7 N , 140.0 E 50.7 N , 94.6 E 38.9 N, 117.9 E 32.9 N , 103.7 E 54.8 N, 161.0 E - - 43.3 N, 136.2 E 48.2 N. 127.8 E 42.4 N , 85.4 E 44.7 N , 116.4 E 1.69 Pole position k , / k , 43.9 N , 263.3 E 20.7 N , 270.2 E 41.4 N. 261.9 E - - (10.9 N , 70.6 E) 24.9 N, 229.6 E 36.6 N , 244.1 E 39.3 N , 196.5 E :1 .O N, 49.9 E) 36.6 N , 191.9 E 41.8 N, 205.3 E 39.5 N, 233.6 E 0.64 - -N / N , is the ratio of samples (sites used to compute t h e mean to t h e total number of samples (sites)
analysed; k , and k , arc the Fisher precision parameters before and after correction for t h e tilt of t h e
strata, respectively; olgs is t h e semi-angle of the cone of confidence at the 95 per cent probability level;
indicates sites not included in the mean because of low blocking temperatures,
t
because o f low preci-sion parameters. $ because these directions are anomalous.
* .
all of the magnetizations are seen at each site, makes statistically significant fold tests difficult to achieve (McElhinny 1964). However, it is possible to determine preferences as to whether the two characteristic directions represent pre- or post-folding magnetizations.
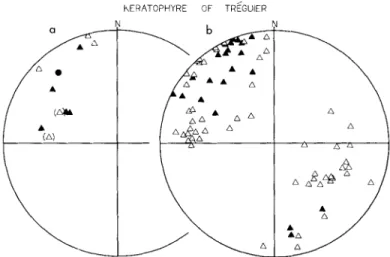
The characteristic magnetite directions (Fig. 7) cluster better after a tilt correction
[ k , / k , =1.69, where k l ( k , ) is the precision parameter before (after) a tilt correction] but
not at a statistically significant level. Further evidence supporting a pre-folding age for the characteristic magnetite directions will be found under the discussion of the resulting palaeopole.
The hematite directions are usually closely grouped within sites but show a large between- site scatter (Table 1). Site-mean directions are found in a band rather than a Fisher (1953)
244 R. Perigo et al.
~ E R A T O P H Y R E OF TR~GUIER
Figure 7. Characteristic site-mean and sample directions of t h e keratophyre magnetite magnetization after
tilt correction in e q u a l a e a projection. Closed (open) symbols indicate projections o n t o t h e lower (upper) hemisphere. (a) Site-mean directions (triangles) and group-mean direction (circle). (b) Charac- teristic sample directions.
distribution (Fig. 8). We did not see evidence in any samples for superposition of two unresolved components carried by hematite, which would explain this streak. Perhaps this distribution could be explained by different times of hematite growth during structural deformation or at times of large apparent polar wander (as will be discussed further in a later section), but this remains rather speculative. The hematite directions show a better precision in situ (k,/kl = 0.64). Again this is not statistically significant at the 95 per cent confidence level, but a post-folding age of the magnetization appears most plausible as will be discussed later. Four of the site means appear anomalous; two of these show such disper- sion that they are essentially random and have been discarded (sites 88 and 96). However, the other two sites (93 and 100) are well constrained and show WNW declinations, but with
hERATOPHYRE OF TREGUIER
Figure 8. Characteristic sample directions and site-means of the keratophyre hematite magnetization,
in sifu, equal-area projection (as in Fig. 7). (a) Site-mean directions (triangles) with excluded westerly anomalous sites in parentheses, and group-mean direction (circle). (b) Characteristic sample directions.
Late Precambrian-Gzmbrian palaeomagnetism, France 245 moderate to steep upward inclinations (Figs 6c and 8). These westerly and upward directions
are statistically different from the characteristic hematite directions at the 95 per cent confidence level (McElhinny 1973). For this reason they were not used to calculate the hematite mean direction and pole even though they had little effect on the outcome. These westerly 'anomalous' sites are not unique to the keratophyre tuffs, since they are also seen in the host rock into which the microgranite dykes intruded. These directions will be discussed further in the next section.
M I C R O G R A N I T E D Y K E S O F L O G U I V Y
About 130 palaeomagnetic samples were collected at 16 sites from the microgranite dykes especially abundant near Loguivy (Figs l b and 2). These dykes are often 15-20m thick, trend ENE, have chilled margins and intrude the middle Brioverian monzonitic microgranite of Launay (Auvray et al. 1976a, b). These host rocks were also sampled (eight sites, 53 samples) to provide a stability test. Due to the highly silicic nature of both microgranites, drilling in the field was impractical. Oriented handsamples (k4") were drilled (2.5 cm diameter) in the laboratory at the University of Rennes and cores were cut to 2.2 cm lengths.
NRM measurements and a viscosity test were completed by A. Dubos in Rennes using a
PDP-8 computer-assisted Schonstedt DSM-1 A magnetometer. Nearly 70 per cent of the microgranite samples had viscous components > 10 per cent of their NRM intensities. The NRM intensities range from to 1 Am-' and show a distinctly bimodal distribution (Fig. 9). The samples fall into a low ( G 1 . 6 ~ 10-2Am-') or a high (> 1 . 6 ~ 10-*A m-') NRM intensity group. Unexpectedly, these intensity groups were found to be related to the magnetic directions seen in the microgranites.
Progressive AF and, predominantly, thermal demagnetization were completed on the microgranites at the University of Michigan. Thermal methods were found to isolate the characteristic directions more clearly. Zijderveld demagnetization diagrams usually show a soft random or pdf direction removed by 300°C or 20 mT, and a subsequent decay towards the origin (Fig. 10). Intensities during demagnetization are reduced to near-noise levels around the Curie point of magnetite (c. 580°C). Only very rarely will a stable component remain in blocking temperatures up to 680°C indicative of a magnetization carried by
I
20
&?
MICROGRANITE NRM INTENSITY
J, X AM-' LOG SCALE
Figure 9. Histogram showing the bimodal NRM intensity of the Trigor rnicrogranites.
2 46 -- R. Perigo et al. IN T E up
t
NRM" , i W b
35:y
M 5 THERMAL 10- . Z A M - l DOWN C AF mT IN SlTU M l 8 l A THERMAL C" I N SlTU SlTU 8 x AM-'Figure 10. Demagnetization diagrams (as in Fig. 5 ) of t h e microgranite dykes of Loguivy. (a) High NRM
intensity sample with the characteristic moderately steep inclination. (b) Low NRM intensity sample with
t h e shallow characteristic inclination. (c) AF demagnetization of a high-intensity sample with a 'soft'
reversely magnetized direction below 20 mT.
hematite. IRM acquisition also indicates magnetite as the principal magnetic carrier (Fig. 1 la).
Two groups of stable magnetic directions are found in the microgranite dykes; they are included in Table 2. The low NRM intensity group characteristically has SSW declinations with very shallow up or down inclinations (Figs 10b and 12a). The high intensity group also shows SSW declinations but with moderate to steep downward inclinations (Figs 10a and 12b). These two directions are clearly distinct and statistically related to the NRM intensity groups at the 99 per cent confidence level.
The microgranite dykes are very similar to the host rock they intrude. The visible difference lies in the presence of amphibole in the monozonitic microgranite of Launay host
Late Precambrian- Cambrian palaeomagnetism, France T R ~ G O R MICROGRANITES a
J;1-1‘1--,
IRM ACQUISITION 0 2 4 6 8 1 0 2 0 3 0 H X 10‘ mT 247J/J,
INTENSITY V S AF 0 20 40 6 0 80 100 AF mT C J!J, 300 400 500 600 TEMP. CoFigure 11. Magnetic properties of the Trtgor microgranites. High-intensity samples are represented by
solid lines for the dykes, dashed for t h e host rocks. Low intensity sample curves are marked with circles
for the dykes and triangles for the host rocks. (a) IRM acquisition of high intensity d y k e samples. (b)
Intensity versus At: demagnetization of NRM. ( c ) Intensity versus temperature in thermal demagneti-
zation of NRM.
rocks and its absence in the microgranite dykes (Auvray et al. 1976b). The dykes are distin- guished in the field primarily by differential weathering that leaves them protruding as low walls above the host rock. The collection of host-rock samples showed demagnetization behaviour much like that of the microgranite dykes but with three characteristic directions. One site (#89) and two samples from site 76 have low NRM intensities and the low intensity characteristic direction. The remaining sites (all with high NRM intensities) have either the characteristic high-intensity dyke direction (sites 69 and 66), or have the characteristic ‘host-rock’ direction with WNW declinations and inclinations that vary between sites but are usually down (Fig. 12b). One host-rock site (#go) records both polarities of this direction, while two sites (76 and 77) show the ‘anomalous’ upward keratophyre hematite direction. Those host-rock sites showing the two characteristic dyke directions have been included in
248 R. Perigo et al.
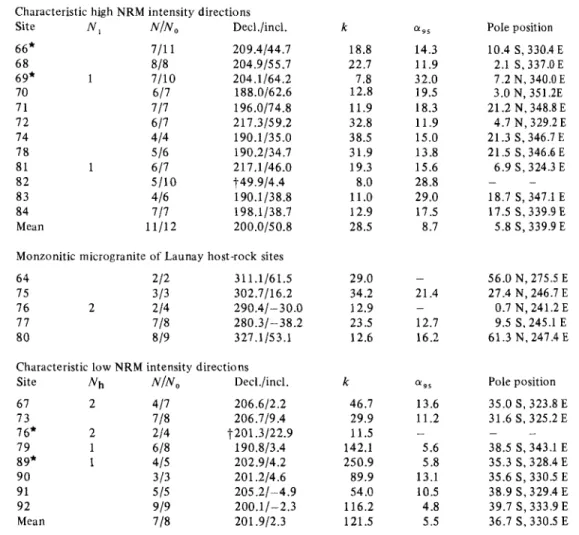
Table 2. Sites means and group means of t h e Trkgor microgranites.
Characteristic high NRM intensity directions
Site N , NINn Decl./incl.
66* 68 69* 70 71 72 74 78 81 82 83 84 Mean 711 1 1 1/10 818 617 717 617 4 14 5 16 1 617 5/10 416 717 11/12 209.4144.7 204.9155.7 204.1164.2 188.0162.6 196.0174.8 217.3159.2 190.1/35.0 190.2134.7 2 17.1146.0 149.914.4 190.1 138.8 198.1138.7 200.0/50.8 Monzonitic microgranite of Launay host-rock sites
64 212 3 11.1161.5
7 5 313 302.7116.2
76 2 2 14 290.41- 30.0
77 718 280.31-38.2
80 8 19 327.1153.1
Characteristic low NRM intensity directions
Site N h N / N o Decl./incl. 67 73 7 6* 79 89* 90 91 92 Mean 206.612.2 206.719.4 $201.3122.9 190.813.4 202.914.2 201.214.6 2 0 5 2 - 4 . 9 200.11- 2.3 201.912.3 k 18.8 22.7 7.8 12.8 11.9 32.8 38.5 31.9 19.3 8.0 11.0 12.9 28.5 29.0 34.2 12.9 23.5 12.6 k 46.7 29.9 11.5 142.1 250.9 89.9 54 .O 116.2 121.5 a 9 5 14.3 11.9 32.0 19.5 18.3 11.9 15.0 13.8 15.6 28.8 29.0 17.5 8.7 - 21.4 12.7 16.2 - a 9 5 13.6 11.2 5.6 5.8 13.1 10.5 4.8 5.5 - Pole position 10.4 S, 330.4 E 2.1 S, 337.0 E 7.2 N, 340.0 E 3.0 N, 351.2E 21.2 N , 348.8 E 4.7 N, 329.2 E 21.3 S, 346.7 E 21.5 S , 346.6 E 6.9 S , 324.3 E 18.7 S, 347.1 E 17.5 S, 339.9 E 5.8 S , 339.9 E - - 56.0 N, 275.5 E 27.4 N, 246.7 E 0.7 N, 241.2 E 9.5 S, 245.1 E 61.3 N, 247.4 E Pole position 35.0 S, 323.8 E 31.6 S , 325.2 E 38.5 S, 343.1 E 35.3 S, 328.4 E 35.6 S, 330.5 E 38.9 S, 329.4 E 39.7 S , 333.9 E 36.7 S, 330.5 E - -
N , ( N h ) is the number of low (high) NRM intensity samples (with the corresponding characteristic
direction); N / N o is the ratio of samples (sites) used to compute t h e mean to t h e total number of samples
(sites) analysed; k is the Fisher precision parameter; a g s is the semi-angle of the cone of confidence at the
95 per cent probability level; indicates a remagnetized host-rock site;
t
indicates sites not included inthe mcan because of low N / N n ratio or low precision.
the low and high intensity group listings of Table 2 . The various magnetic directions of the dykes and the host rocks imply certain constraints on their order of magnetization which will be addressed under the discussion of the microgranite poles.
A few microgranite sites (like site 7 6 mentioned above) show both high and low NRM
intensity samples with their related directions. Other than the small sampling of site 76,
these sites are predominantly of one intensity group, either high or low, with only one or two samples of the alternate group. The number of samples at each site with intensities of the alternate group are indicated in Table 2 .
The low intensity characteristic directions are closely grouped both within and between sites (group-mean precision parameter k = 121.5). No polarity reversals are seen. The mean declination/inclination of the low intensity group is 201.9"/2.3" (Fig. 12a).
Late Precambrian-Chmbrian palaeomagnetism, France
T R ~ G O R MICROGRANITES
249
Figure 12. Characteristic site-mean directions of t h e TrCgor microgranites in equal-area projection (as in
Fig. 7). (a) Low NRM intensity dyke (triangles) and host-rock (squares) sites with excluded host rock
site 7 6 in parenthesis. (b) High NRM intensity dyke and host-rock sites indicated as above with d y k e and
host rock group mean (circle); present-day field direction is shown b y a cross.
In contrast, the microgranite high-intensity directions show more scatter both between and within sites than the low intensity group, and the high intensity directions show polarity reversals; occasionally even within the same sample (Fig. 10c). Also the decay of the high intensity remanence during demagnetization differs from that of the low intensity group (Fig. 1 l b , c). Low intensity samples have little relative intensity decay at temperatures below 200°C. At higher temperatures the remanence decays at a fairly constant rate as the Curie temperature of magnetite is approached. High intensity samples on the other hand, have large relative intensity drops at temperatures below 200°C and the remanence decay rate varies greatly at different temperatures. The normalized intensity decays rapidly at lower temperatures; then reaches a 'plateau' at intermediate levels, and finally decays rapidly again at temperatures >500°C. Combined with the much steeper high intensity mean direction (200°/50.8"), the above traits indicate a fundamental difference between the two microgranite dyke magnetizations.
Discussion of results
Precambrian palaeomagnetic data on the whole are particularly vulnerable to remagneti- zation due to their great age and often complex histories. The keratophyre tuffs illustrate this fact since their two magnetizations indicate at least one period of partial remagneti- zation. For this reason each magnetization must be critically evaluated on its own merits and on its relationships to other magnetizations, within the same sample, site, formation, or from other rocks of similar age. The goal is to determine the true or relative age of the magnetizations or, short of this, to indicate possible alternative ages.
The characteristic magnetite direction in the keratophyre tuffs gives an in situ pole posi- tion (30.1 O S , 320.7"E) near Devonian and Carboniferous poles from Europe. However,
several considerations, including the fold test, argue for a Late Precambrian age. The keratophyres are believed to have been folded and metamorphosed (low greenschist facies) during the second phase of the Cadomian orogeny between 600 and 580Myr (Cogne &
Wright 1980). Basal conglomerate beds in neighbouring basins indicate that Cadomian
I1
250 R. Perigo et al.
activity (late epiorogenic stage) continued into Cambrian times (the Assyntian orogeny of the Bohemian Massif), after which the north Armorican region experienced only modest vertical motions until Devonian times (CognC 1974; Ager 1980; CognC & Wright 1980; Matthews, Chauvel & Robardet 1980). Thus a pre-folding magnetization implies at least a Cambrian age and probably older. Combined evidence from magnetic behaviour and thin sections concur with a pre-folding if not primary acquisition of the magnetite magneti- zation. The very high blocking temperatures contrasted to the low degree of metamorphism suggests that these rocks probably have not been exposed to thermal conditions that would result in remagnetization (Pullaiah et al. 1975). Also the unaltered, euhedral magnetite crystals have textural relations which suggest an age at least equal to that of the Late Precambrian metamorphic event. Thus a primary thermal remanent magnetization (TRM) acquired around 640 Myr ago seems the logical origin for the characteristic magnetite remanence. Moreover, the tilt corrected pole (44.7'N, 11 6.4'E, ag5 = 12.2') is statistically identical to the pole from the overlying spilites of Paimpol (Table 3 , Fig. 13a); we recall that Hagstrum et al. (1980) showed that the spilites, where in contact with cross-cutting microgranite dykes, were locally remagnetized during the Cambrian-latest Precambrian. Since other spilite sites appeared not to be remagnetized, this is a strong argument for a Precambrian age of the spilite magnetization, and by inference, for the characteristic magnetite magnetization of the keratophyre tuffs as well.
The hematite component in the keratophyres is more enigmatic. Poles and antipoles of this component, both in situ and tilt corrected, are not similar to any Late Palaeozoic and younger poles from Europe. However, both hematite poles are similar t o other poles from the Armorican Massif of latest Precambrian age (Fig. 13a). The hematite in situ pole (KHI in Fig. 13a) is close to poles from the Channel Islands and from the TrCgor area (Hailwood & Garrett 1977; Hagstrum et al. 1980), while the tilt-corrected pole (KHB)isvery close to the pole for post-tectonic microgranite dykes which intrude the spilites of Paimpol (Hagstrum et al. 1980). A post-tectonic interpretation of the hematite component is most reasonable considering the relatively mild nature of Cambrian and post-Cambrian tectonics; hence we argue that the pole based on a pre-folding age of the hematite magnetization (KHB in Fig. 13a) is most improbable as also suggested by the fold test.
The nature of the hematite component, as shown by the distribution of the keratophyre NRM intensity, suggests that it was added to (and occasionally overwhelmed) a primary magnetite component. The hematite and mixed samples have NRM intensities generally an order of magnitude greater than the magnetite samples (Fig. 3). Many of the mixed samples have magnetite components with the same intensity as that of samples containing only magnetite. Since the hematite remanence is often seen in the same sample with a (probably) primary magnetite component, and considering the extremely rare occurrence of primary hematite in igneous rocks (Carmichael, Turner & Verhoogen 1974), a secondary chemical remanent magnetization (CRM) is indicated for the hematite component. The alteration of magnetite to hematite seen in reflected-light microscopy supports this. Of the two logical events that may have affected the keratophyre tuffs, the first (an early alteration of a parent material to form the hematite) is most unlikely since the hematite direction is so much different from that of the older magnetite. The second, and more probable event, is asso- ciated with the late stages of the Cadomian
I1
orogenic phase (600-580Myr) and would make the hematite magnetization essentially post-folding but perhaps dispersed somewhat by terminal CadomianI1
(Assyntian) deformation.The microgranite low NRM intensity pole (36.7"S, 330.5'E, 0 1= ~5.5') is very close to ~
'Hercynian' poles for Late Devonian to Carboniferous times (Jones et al. 1979; Briden & Duff 1981 ; Bachtadse et al. 1983; Perroud, Bonhommet & Robardet 1982). Upon exami-
Late Precambrian- Cambrian palaeomagnetism, France 25 1 nation of the microgranite dyke site locations, it was found that five of the six sites, which are dominated by low intensity samples, are closely associated with mappable dolerite dykes (Dolerite du Trieux, Figs l b and 2). Conversely, high NRM intensity sites tend to be removed from these dykes. The dolerite dykes are thought to be of Middle to Late Palaeozoic age, and preliminary palaeomagnetic measurements by the authors have yielded a mean palaeomagnetic declination/inclination of 21 2"/+10" for half a dozen dykes. The similarity of the low NRM intensity microgranite directions to the directions of the dolerite dykes that cut them indicates a local remagnetization, probably in Late Devonian to Carboniferous times. Because of the large drop in NRM intensity, a chemical remagneti- zation is indicated.
Textural evidence from microgranite thin sections seems to record this event. The TrCgor microgranites consist primarily of large, well-formed phenocrysts in a glassy groundmass (Fig. 14a, b; see also Auvray el al. 1976b). Thin sections of both high and low-intensity samples, from dykes and host rock alike, contain features (spherulites, micropegmatitic veins) which indicate devitrification of the groundmass. Texturally, the dyke and host rocks are similar if of the same intensity group; the differences appear between the low and high- intensity samples.
High-intensity samples commonly have large (c. 200 pm) and smaller (c. 10 pm) euhedral, essentially unaltered, magnetite crystals, the smaller usually in amphibole (when present) or in restricted areas of the groundmass. The magnetite-containing groundmass is a 'salt and pepper' mosaic of crystolites (c. 3 p n ; see Fig. 14a). Some samples have large spherulites
(c. 700 pm), often sprouting from phenocrysts and coalescing into large masses, which are devoid of magnetite as are local areas of large blocky crystals.
Low intensity samples lack the large euhedral magnetite crystals, and smaller grains tend to be altered to hematite. However, some tiny opaque grains, perhaps magnetite, appear as inclusions, often in chlorite. The groundmass of the low-intensity samples is a jagged mosaic of 100 pn grains with a felty appearance caused by a diffuse fibrous-like intergrowth within and between grains; here 'salt and pepper' groundmass and large spherulites are absent (Fig. 14b).
The different groundmass textures, and the apparent removal and/or alteration of magnetite in low intensity samples, is likely the result of local devitrification or limited recrystallization initiated by the intrusion of the dolerite dykes. The difference in the NRM intensity, and in the intensity decay curves already mentioned, is ostensibly related to the different amount and/or grain size distributions of magnetic material resultant of this recrystallization.
Since the microgranite dykes (and the monzonitic host rock) are only locally remag- netized by the 'Hercynian' dolerite dykes, the high NRM intensity magnetization must be older than Devono-Carboniferous. The pole for the high intensity samples (5.8"S, 339.9"E, ag5 = 8.7") plots very close to Cambrian poles from the Armorican Massif (Fig. 13a). but this location is also on the early Palaeozoic European apwp between Ordovician and Siluro- Devonian poles (Briden & Duff 1981).
However, because of the preliminary results for the host rocks intruded by the micro- granite dykes, more can be said about the age limits on the high NRM intensity dyke magnetization. The five sites from the monzonitic microgranites of Launay with the characteristic host-rock WNW declinations, are very similar to the Late Precambrian
(580-560 Myr) directions for the Armorican Massif discussed previously. Yet two host-rock sites were apparently thermally remagnetized by the intrusion of the microgranite dykes. This indicates that the characteristic host-rock remanence is at the very least older than the age of the microgranite dyke remanence, since any region-wide remagnetization after intru-
Table 3. Eocambrian-Cambrian pole positions from Europe (650-500 My:). Symbol Rock unit Age Armorican Massif, France KMB SP SQ, KHI pp, pp2 PP, GK, SQ 2 GK2 JD MI PS MH MR CA JV NWG SWG SEG RB RM Keratophyre, Treguier (magnetite) Spilites, Paimpol Diorite, St Quay Keratophyre, Treguier (hematite) St Peter Port Gabbro, in situ St Peter Port Gabbro, dip con. Bordeaux Diorite contact in PP Jersey C-Dolerite dykes Gabbro, Keralain Diorite St Quay, secondary Microgranite dykes and contacts Gabbro Keraiain, secondary Granite, Porz-Scarff Microgranite, Loguivy (high inten.) Mainland rhyolites Carteret redbeds Jersey volcanics North-west Granite, Jersey South-west Granite, Jersey South-east Granite, Jersey Redbeds, Zone Bocaine Redbeds, Syncline of May 640i 12 640t 12 583 i 40 580-570? 660-570 660-570 660-570 Pre- €/€? Pre- €/€? Pre- €/€? 557 i 16 548 f 24 546 i 8 €1 522 i 16 4801 553? 509? € €U 6 20 -5 40 573-510 Pole position Control Reliability 44"S, 296"E 34"S, 297"E 34"S, 319"E 39"N, 234"E 14"N, 237"E 13"N, 224"E 13"N, 263"E 26"N, 248"E 31"N, 268"E 38"N, 262"E 16"N, 310"E 8"N, 325"E 9"N, 343"E 6"S, 348"E 16"S, 343"E 49"N, 327"E 52"N, 323"E 73"N, 353"E 74"N, 356"E 77"N, 337"E 9"N, 45"E 23"S, 15"E Reference This study Hagstrum et al. (1980) Hagstrum et al. (1 980) This study Hailwood & Garrett (1977) Hailwood & Garrett (1977) Hailwood &Garrett (1977) Duff (197813) Hagstrum et al. (1980) Hagstrum eta/. (1980) Hagstrum et al. (1980) Hagstrum et al. (1 980) Hagstrum et al. (1980) This study Hagstrum et al. (1980) Van der Voo &Morris (1982) Duff (1978b) Duff (1978b) Duff (1978b) Duff (1978b) Jones (1978) Jones (1978)
Southern
England
and
Wales
WU MO, LD MO2 MA, EU SH RS LE MA2
uc
LS BR CA HQWestern Uriconian Mona Complex, Gwna Dykes in Logmyndian (redated as Silurian) Mona Complex, in situ NRM Malvernian Eastern Uriconian Stanner-Hanter Rushton schist Leicestershire Diorites Malvernian, in situ Uriconian, secondary in situ Longmyndian sediments, in situ Bangor redbeds Caerfai series Hartshill quartzite 677 i 72 c. 600 €? 590 r 20 558+ 16 702-5 36? 536 i 8 539-533 €? €? €? €1 €1 €1 (1) 37"N, 235"E (2) 17"N, 237"E Not plotted (0) 42"N, 324"E (2) 13"N, 252"E (3) 14"S, 272"E (0) 31"N, 279"E (3) 26"N, 285"E (3) 63"N, 141"E (0) 86"N, 56"E (0) 80"N, 41"E (1) 60"N, 29'E (3) 54"N, 132"E (3) 26"N, 169"E (3) 18"N, 165"E Piper (1979a) 151227 Lomax & Briden (1977) Lomax (1 975) Piper (1979a) Piper (1979a) Piper (1979a) Piper (1979a) Duff (1978b) tr Lomax & Briden (1977)
5
3
2
Briden (1977) Briden (1977) Duff (1978b) 13/66Y
5/83 3 5' 1 Symbols correspond to Fig. 14. Age control is based on the following criteria [ 3 = radiometric age or stratigraphic age known within half-period (c. 30 Myr) limits,6
2 = age known within period (c. 50 Myr) limits, 1 = age known within approximately 120Myr; 0 = age not known, but inferred]. Pole position reliability from 3 McElhinny & Embleton (1976), with 3 being the most reliable (Ay5 <15",at least four sites, 15 samples, and result based on stability test). Reference numbers refer to the palaeomagnetic pole lists of McElhinny (1968), 1972) and McElhinny & Cowley (1978) and the pole list of Irving, Tanczyk & Hastie (1976) (after table 3 of 3 5 Hagstrum et al. 1980).2
c"
3254
R.
Perigo e t al.a ARMORJCAN POLES
b
POLES FROM ENGLAND,WALES ( 0 ) . AND CZECHOSLOVAKIA ( v )
C GONDWANA POLES a3 0 2 0 1 P A L A E O M A G N E T I C " R E L I A B I L I T Y "
Figure 13. Palaeomagnetic pole positions for t h e Eocambrian-Cambrian (650-500 Myr). Palaeomagnetic
reliability indicated b y the size of t h e symbol (after McElhinny & Embleton 1976); agc control indicated
by radiomclric or stratigraphic age in rectangle ( ' 3 7 , without rectangle ('2'), or not indicated at all ('1').
(a) Poles from the Armorican Massif (Table 3 ) , with poles labelled K from the keratophyres (M = magnetite,
H = hematite, I = in situ, B = bedding corrected) and poles labelled M f r o m t h e microgranites of this study
(H = high intensity, L = low intensity). (b) Poles from the southern United Kingdom (dots; Table 3) and
Czechoslovakia (triangles; listed in Hagstrum et al. 1980). (c) Poles from the reassembled Gondwana
continents (after table 3 and fig. 1 6 of Hagstrum el al. 1980).
Late Precambrian- Cambrian palaeomagnetism, France 25 5 sion of the dykes would leave dyke and host rocks with the same magnetic direction (especially considering their similar petrological compositions). Thus both these magneti- zations are not only pre-Hercynian (as indicated by the dolerite dykes), but a remagneti- zation after the Cambrian intrusion of the dykes is virtually precluded. The high NRM intensity magnetization of the microgranite dykes must be essentially a primary TRM associated with the Cambrian age (548 Myr) of their intrusion.
In particular, the pole for the high NRM intensity microgranites plots very close to the poles from the contemporaneous Mainland rhyolites and the Porz-Scarf granite obtained by Hagstrum e t al. (1 980). Our microgranite pole (with its well-constrained magnetization) lends strong support to these poles where the possibility of a secondary magnetization was raised by the authors (Hagstrum e t al. 1980, p. 507) because of an altered appearance of the oxides in thin sections and the presence of a few anomalous high-temperature components. Instead, all of these magnetizations appear related to a Late Precambrian to Early Cambrian period of co-magmatic acidic volcanism proposed by Auvray (1975) to encompass the granite, rhyolites and the microgranite dykes on the basis of Rb-Sr geochronological studies (see also Vidal 1976).
The Armorican apwp; comparisons with other regions
The two keratophyre poles and the Cambrian microgranite pole are very compatible with the Armorican apwp proposed by Hagstrum et al. (1980) shown in Fig. 13(a) with the addition of the Van der Voo & Morris (1982) 'A' pole. The three poles of this study span much of the apwp and maintain correct age relationships with the previous poles. Also the obvious order of the keratophyre magnetizations (primary magnetite, secondary hematite) agrees with the sequential positions of the poles. These, and additional poles from the TrCgor region, are also consistent with data from other structural units of the Domnonean domain (as delineated by Lefort 1975), such as the Channel Islands. Thus these structural units have, on the scale of our palaeomagnetic observations, behaved as a coherent mass.
By comparing the data from the Armorican Massif with those from southern England and Wales, Czechoslovakia, and a reconstruction of Gondwana, Hagstrum e t al. were able to substantiate (with palaeomagnetic data) the existence of the Armorica plate proposed by Van der Voo (1979). Van der Voo's proposal that the Armorica plate extended through middle Europe, and perhaps to fragments left -behind in North America and Africa after subsequent rifting of Pangea, was based on a similarity in geological history for these regions (see also Van der Voo et al. 1980). Additional evidence bearing on the geographic extent,
and the tectonic history of Armorica has come to light since these studies. This discussion is concerned with recent palaeomagnetic evidence for Armorica; the relevant European geologic and geochronologic evidence is well summarized in Cognk & Wright (1980).
Palaeomagnetic and geochronologic data for the Precambrian basement of England and Wales (south of the Caledonian orogenic belt) come primarily from exposures in the Midland craton. This province contains the Stanner-Hanter, Malvernian and Johnston Complexes (Beckinsale e t al. 1981). Rb-Sr whole rock dates as old as 681 f 53 Myr (Malvernian Hills) and 702 2 8 Myr (Stanner Hill felsic intrusive) have been found. However, K-Ar and Rb-Sr mineral ages indicate that nearly all of this area underwent a major thermal event between 650-600 Myr (Patchett e t al. 1980; Beckinsale e t al. 1981). Cooling ages between 600 and 580 Myr are common from Anglesey and Wales (Malverian complex 590 2 20 Myr; Lambert
& Rex 1966; Moorbath & Shackleton 1966; Fitch et al. 1969; Beckinsale & Thorpe 1979). A thermal event of this scale, while resetting K-Ar isotopic systems, probably will also remagnetize the rocks (Pullaiah et al. 1975). For this reason one must be sceptical in assign-
256 R. Perigo et a].
ing any magnetization in the Midland craton an age much greater than 600 Myr. Other radio- metric dates (including Rb-Sr whole rock methods) give rock forming dates betwee 600 and 540Myr and as young as 533 f 13 Myr (Ercall granophyre, Patchett et al. 1980). Palaeo- magnetic data from the Midland craton and Anglesey (Lomax 1975; Piper 1976, 1979a; Lomax & Briden 1977) is compiled with relevant age data in Table 3 and plotted with data from Czechoslovakia (see Hagstrum er al. 1980 for pole list) in Fig. 13(b).
By correlating the Midland craton magnetizations to relative geological and available radiometric dates, Piper (1979a) could link the poles into an apwp showing large and rapid apw from 700 Myr to Lower Cambrian times apparently unrelated to the apwp of the Baltic Shield. This path also appears unrelated t o that of Armorica. However, we argue here that the directions of magnetization seen in the Midland craton (and Anglesey) are similar to those of the Armorican Massif. If these magnetizations are considered to result from the thermal (isotopic) event around 600 Myr then there is also good correlation between the ages
of these data from southern England and those of the Armorican Massif.
The Stanner-Hanter (SH) and Rushton schist (RS) poles are similar, and close to the Armorican pole from the Gabbro de Keralain, placed in time between 583 k 40 and
557 It 16Myr (Hagstrum et al. 1980). A biotite cooling age on the Rushton schist (538 f 8 Myr) falls just within the lower age bracket, but the actual age of the magnetic
remanence could be slightly older (Pullaiah et al. 1975). We note that the Rushton schist pole, with its position comfirmed by the magnetically reliable Stanner-Hanter pole, is far removed from the Leicestershire diorite pole (LE) of the same age which plots far from the Armorican apwp.
The tilt corrected Malvernian pole (MA,) of Wales (Lomax & Briden 1977) which hasK-Ar and Rb-Sr mineral ages between 624 k 34 and 590 ? 20 Myr (Lambert & Rex 1966; Fitch
et al. 1969) is in good agreement with the Armorican data. Since a pre-folding magnetization has not been decisively demonstrated for these rocks, the in situ pole (MA2) is also plotted in Fig. 13(b). This in situ pole, if resulting from a remagnetization in Cambrian times, is also
consistent with Armorican data.
The Eastern and Western Uriconian volcanics are petrologically similar but may be of slightly different ages. Both poles are based on tilt-corrected directions since the probably younger Eastern Uriconian results pass a fold-test (Piper 1979a). The Western Uriconian pole (WU) is statistically the same as the keratophyre hematite in situ pole of Armorica. The Eastern Uriconian pole (558 f 16 Myr; Patchett et al. 1980) is somewhat displaced from the Armorican apwp but the magnetic direction is similar to the 'anomalous' sites of the kerato- phyre hematite magnetization (also found in the microgranite host rocks).
The pole (MO,) from the Gwna Group pillow lavas of Anglesey (Piper 1976) is very close to poles from the Channel Islands (Hailwood & Garrett 1977). There is some debate whether the Gwna Group is Late Precambrian or Lower Cambrian (see Barber & Max 1979, p. 426). Recent microfossil data, though limited and poorly preserved, favour a Lower Cambrian age (Muir et al. 1979). Its pole compared to the Armorican data would suggest a slightly greater age; although it is still in overall agreement considering the limitations of the data.
Only the pole from the post-Uriconian dolerite intrusives (77"E, 37"N; Piper 1979a) is clearly inconsistent with Armorican data. These dykes cut the folded Uriconian lavas and tuffs and are locally overlain by tilted Lower Cambrian quartzites. Anomalous magnetic directions found in the dolerites, combined with uncertain tectonic corrections, perhaps limit the reliability of this pole, not plotted in Fig. 13.
Hagstrum et al. (1980) showed that the Eocambrian-Cambrian Armorican apwp is remarkably similar to data from a reconstructed Gondwana. The poles added to the Armorican apwp from this study and Van der Voo & Morris (1982) confirm this observation
Figure 14. Photomicrographs of the microgranite dykes of Loguivy. (a, b) High-intensity dyke (sample 26,
site 68; see also Fig. IOc) with characteristic ‘salt and pepper’ groundmass. (c. d) Low-intensity dyke (sample 16, site 67) at the same magnifications showing the ‘felty mosaic’ groundmass as well as graphic intergrowth.
[fucing page 2561
Figure 14 (continued)
Late Precambrian- Cambriari palaeomagnetism, France 257 (Fig. 13a, c). The two apwp’s appear divergent only with poles older than 600 Myr, although data here remain scarce despite an additional pole from South America [the La Tinta pole
(LT) of Fig. 13c] with an Rb-Sr age of 709 ir 24Myr from Valencio, Sinto & Vilas (1980). Convergence of the apwp’s around 600Myr may relate to the Cadomian orogenic event (Cadomian I1 of CognC & Wright 1980). Following this, Armorica and Gondwana moved as a unit until the Early Palaeozoic. Ordovician palaeomagnetic data from the Ibero- Armorican Arc (Perroud & Bonhommet 1981; Perroud 1983) show that Armorica could have separated from Gondwana by Ordovician or Silurian time. By Devonian times there was a large ocean between them (Jones e f al. 1979).
The migration of the Armorican plate is of particular interest since its position between the continents of Laurentia, Baltica and Gondwana predisposed it to complex plate inter- actions with these units. Indeed, Armorica has apparently been tectonically active for most of its ‘lifetime’ (see CognC & Wright 1980). Such interactions of Armorica (or Armorica- like continental masses) with, or in combination with, the aforementioned continents have been proposed for numerous orogenic events. These include the Late Precambrian Cadomian (CognC & Wright 1980); the Early to Mid-Palaeozoic Taconic, Caledonian and Acadian (Piper 1979b; Van der Voo 1979; Kent 1980); and the Late Palaeozoic Hercynian (Jones et al. 1979; LRfort & Van der Voo 1981; Perroud & Bonhomniet 1981). Clearly, Armorica was integral to the Late Precambrian to Late Palaeozoic tectonic history of the continents which today border the North Atlantic.
Acknowledgments
The authors would like to thank Alain Dubos for his help in sample collecting and his preliminary work on the TrCgor microgranites. We also thank HervC Perroud for useful comments on the preliminary data, and David Wiltschko for his evaluation of the manu- script. Financial support for this work came from the Division of Earth Sciences, the National Science Foundation, grant EAR 81-0303 1.
References
Agcr, D. V., 1980. The Geo1og.y o f Europe, Halsted Press, New York.
Arthaud, R . & Matte, P., 1975. Les DCchrochements Tardi-Hercyniens d u Sud-Ouest de L’Europe,
Autran, A., Breton, J . P . , Chantraine, J., Chiron, J . C., Gros, Y. & Roger, P . , 1980a. Carte Tectonique d e
Autran, A , , Breton, J . P., Chantraine, J . , Chiron, J. C., Gros, Y . , & Roger, P., 1980b. Introduction & la
Auvray, B., 1975. Relations entre plutonisme et volcanisme ignimbritique; example des manifestations Auvray, B., 1979. Cen;se et Cvolution de la croute continentale dans le Nard d u Massif Armoricain,
Auvray, B., Charlot, R. & Vidal, P., 1980. Donnies nouvelles sur le proterozoique infkrieur du domaine
Auvray, B., Lefort, J . P. & Monnier, J . L., 1976a. Carte Giologique d e la France au 1/50,000, feuille
Auvray, B., Lcfort, J . P . & Monnier, J . L., 1976b. Notice explicative feirille VIII-14 Diguier, Burcau
Bachtadse, V., Heller, F. & Kroner, A., 1983. Palaeomagnetic investigations in the Hercynian Mountain
Barbcr, A . J . & Max, M. D., 1979. A new look at the Mona Complex (Anglesey, North Wales), J. geol.
Tectonophys., 25, 139-179.
la Frunce, dchelle I/I,OOO,OOO, Bureau Rech. GBol. Min., Service Geologique National, France.
Carte Tcctonique de la France,Mdm. Bureau Rech. Gdol. Min. No. 110, 5 2 pp.
magtnatiques cambriennes d u Nord de la Bretagne,Pitrologie, 1, 125-138.
These, University of Rennes, 6 7 0 p p .
nord-armoricain (France): age et signification, Can. J . Earth Sci., 1 7 , 5 3 2 - 5 3 8 .
VIII-I4 T r d p i e r , Bureau Rech. GBol. Min., Service Giologique National, France.
Rech. Giol. Min., Service Gtologique National, France, 2 6 pp.
Belt of Middle Europe, Tectonophys., in press.
Soc. L o n d o n , 136,407-432.
9


![[PDF] Formation Excel Initiation | Télécharger PDF](data:image/gif;base64,R0lGODlhAQABAIAAAP///wAAACH5BAEAAAAALAAAAAABAAEAAAICRAEAOw==)