HAL Id: hal-00003976
https://hal.archives-ouvertes.fr/hal-00003976v2
Submitted on 19 Oct 2020
HAL is a multi-disciplinary open access
archive for the deposit and dissemination of
sci-entific research documents, whether they are
pub-lished or not. The documents may come from
teaching and research institutions in France or
abroad, or from public or private research centers.
L’archive ouverte pluridisciplinaire HAL, est
destinée au dépôt et à la diffusion de documents
scientifiques de niveau recherche, publiés ou non,
émanant des établissements d’enseignement et de
recherche français ou étrangers, des laboratoires
publics ou privés.
Geomagnetic paleosecular variation recorded in
Plio-Pleistocene volcanic rocks from Possession Island
(Crozet Archipelago, southern Indian Ocean)
Pierre Camps, Bernard Henry, Michel Prevot, Liliane Faynot
To cite this version:
Pierre Camps, Bernard Henry, Michel Prevot, Liliane Faynot. Geomagnetic paleosecular variation
recorded in Plio-Pleistocene volcanic rocks from Possession Island (Crozet Archipelago, southern
In-dian Ocean). Journal of Geophysical Research : Solid Earth, American Geophysical Union, 2001, 106
(B2), pp.1961-1971. �10.1029/2000JB900370�. �hal-00003976v2�
JOURNAL
OF GEOPHYSICAL
RESEARCH,
VOL.
106,
NO. B2,
PAGES
1961-1971,
FEBRUARY
10,
2001
Geomagnetic paleosecular variation recorded in
Plio-Pleistocene
volcanic rocks from Possession Island
(Crozet Archipelago,
southern Indian Ocean)
Pierre Camps
Laboratoire G•ophysique, Tectonique et S•dimentologie, CNI•S and ISTEEM, Universit(•
Montpellier 2, Montpellier, France
Bernard Henry
Laboratoire Gdomagndtisme et Pal•omagn•tisme, CNRS and IPGP, Paris, France
Michel Pr•vot and Liliane Faynot
Laboratoire G•ophysique, Tectonique et S•dimentologie, CNRS and ISTEEM, Universit•
Montpellier 2, Montpellier, France
Abstract. Possession
Island, in the Crozet Archipelago, consists
of volcanic units
erupted
mainly between
-.• 5 and 0.5 Ma. A paleomagnetic
sampling
was carried
out along
several
sections
distributed
near the northern,
eastern,
and southeastern
coasts.
A total of 45 independent
flows were sampled
(320 samples).
For each flow
a precisely
defined
characteristic
remanence
direction
was usually
isolated
after a
careful
progressive
cleaning
in alternating
fields. However,
particularly
complex
remanence
behavior is often observed. The magnetostratigraphy
of the lava pile is
quite
simple,
with reversed
rocks
in the lower
part and normal
units in the upper
part of two sections.
A third section
is of normal
polarity throughout
its whole
thickness,
including
three excursional
directions.
We did not find any intermediate
directions
between
the normal and reverse
magnetozones.
Thus we have no evidence
for the recording
of the Matuyama-Brunhes
transition
expected
from a previous
study [Watkins
et at., 1972]. The amplitude
of paleosecular
variation,
estimated
from
between-flow
dispersion
from the field of an axial dipole,
is 11.8øwith
95%
confidence limits between 9.3øand 14.0 ø. This value is consistent with the general
anisotropic
statistical
model
for paleosecular
variation
of Constable
and Johnson
1. Introduction
The existence of broad fluctuations in direction and
magnitude,
spanning
a variety of spatial and tempo-
ral scales, is a fundamental characteristic of the Earth's magnetic field. These oscillations provide essential in- puts for a better understanding of the field-generatingprocess
occurring
in the Earth's outer core and they
may
also
provide
information
on possible
lateral changes
at the core-mantle boundary. Yet there are still manyuncertainties
in the morphological
characteristics
of these
fluctuations,
as illustrated
by many controversial
de-
bates. For example,
the question
of whether or not
the transitional
virtual geomagnetic
poles
(VGP) are
preferentially
confined
to two sectors
of opposed
longi-
tude,
or the question
of differences
in paleosecular
varia-
Copyright
2001
by the
American
Geophysical
Union.
Paper number 2000JB900370.
0148-0227/01/2000JB900370509.00
tion between the Pacific and Atlantic hemispheres, and
moreover, if there are differences in paleosecular varia-
tion between the Northern and Southern Hemispheres
as it is the case in the modern geomagnetic field (for a review, see Merrill ei al. [1996]). These questions
will undoubtedly remain unanswered as long as paleo-
magnetic
analyses
do not allow
the development
of reli-
able observations, both in terms of direction and inten- sity, from sites geographically dispersed. It is importantto assess
a good geographical
coverage,
preferably
pro-
vided by volcanic rocks which are, in general, a morereliable recorder than sedimentary rocks.
In examining
directional
databases
of volcanic
records,
McElhinny
and McFadden
[1997]
note a predominance
of data acquired
during
an era before
the modern
meth-
ods of principal
component
analysis
were introduced
into the procedures
for demagnetization
of rocks.
There-
fore it is feared that some of these data are sullied
with errors due to the presence of secondary compo-
nents
of magnetization
which
have
not been
completely
19611962 CAMPS ET AL.: GEOMAGNETIC PALEOSECULAR VARIATION IN PLIO-PLEISTOCENE
eliminated. For this reason, McElhinny and McFad-
den [1997] suggested
that some of these studies
would
be worth repeating using modern experimental tech- niques. At first glance, this remark is particularly rel- evant to the volcanic data coming from the southern Indian Ocean, since they were obtained mainly at the
beginning
of the 1970s [Watkins et al., 1972; Watkins
and Nougier, 1973; Watkins et al., 1974; Amerigian et
al., 1974; Watkins
eta!., 1975]. These
data now appear
crucial because they come from geographically isolatedislands and thus represent rare field observations possi-
ble in a wide area devoid of data.
Spurred on by these considerations, we carried out a new paleomagnetic study of the volcanic sequences
from Possession Island (Crozet Archipelago, southern Indian Ocean). This work was made possible by the presence of the French scientific base Alfred Faure on
Possession Island, which enabled us to have essential
logistical support for the paleomagnetic sampling. We
also hoped to be able to sample the full spectrum of the field fluctuations, since a reversed to normal polarity
boundary thought to correspond to Matuyama-Brunhes was detected and because some intermediate directions
have been previously
reported on this island [Watkins
et al., 1972].
2. Geological Setting
The Crozet Archipelago is composed of five main islands including Possession Island. This archipelago
lies east of the Southwest Indian Ridge on an oceanic
plateau which was created at 54 Ma during an episode
of anomalous volcanism on the flank of the ridge, prob-
ably linked to a slow spreading phase [Gos!in et al.,
1981]. Island volcanic
edifices
are being formed
as this
oceanic plateau passed over the Crozet hotspot.
tailed geological
works [Chevallier,
1981; Chevallier
et
al., 1983] indicate that Possession Island correspondsto a stratovolcano built through three main cycles, in-
cluding five volcanic phases (Figure 1). The first cycle
of activity, which likely lasted more than 7 Myr, con- stitutes the basement of a large stratovolcano of -• 40 km diameter. Basaltic flows were first eraplaced under-
water (phase I) and later as subaerial or intrusive units (phase II). No age could be obtained from the very al-
tered basalts from phase I. For the subaerial phase II
flows, potassium-argon (K-Ar) ages of 8.1+ 0.6 Ma and
2.7 + 0.8 Ma were obtained [Chevallier
et al., 1983]
near the middle and the top of the sequence, respec-
tively, whereas an age of 1.3 + 0.4 Ma was measured on a dyke. These ages correspond to several chrons preceding the Matuyama chron.
After a period of erosion the second cycle lasted for 0.5 Myr. Conglomerate and differentiated felsic basalts of phase III lie, often unconformably, over the phase II formations. Phase III includes lava with K-At ages between 1.03 4. 0.4 and 0.72 4. 0.11 Ma (Matuyama-
Lower
Brunhes).
The thick top plateau
flows,
assigned
to phase
IV, were
erupted
during
volcanic
activity
along
a wide rift oriented along a NW-SE azimuth of 135 ø.They yield radiometric ages from 0.70 4- 0.15 to 0.53
4- 0.09 Ma (Brunhes).
Following
a glacial episode
dur-
ing which U-shaped valleys were formed, the third cycle(phase V) produced recent Strombolian cones and some sparse lava flows (differentiated suite from felsic basalts
to phonolites).
This phase
seems
related to an impor-
tant tectonic event marked by the formation of horsts and rifts and the collapse of a large western part of the
stratovolcano.
3. Paleomagnetic Sampling
For paleomagnetic sampling, we looked for strati- graphic sections not affected by tectonic events and
presumed to encompass a large time interval. One of
Watkins
et at. 's [1972]
paleomagnetic
sections
near the
southeastern coast at Crique de Noel (CN), and a new one along the northern coast in the Petit Caporal val-ley (PC) (Figure 1) were chosen
because
they include
volcanic sequences of flows from phases II and III and because one K-Ar age is available from each of them. Unfortunately, owing to very difficult field working con- ditions, we had to stop sampling before reaching the top
of the PC section, leaving the upper part of the phase III
sequence unsampled. A third section, with good quality outcrops, is located near the eastern coast on Alouette
Mountain (AL). This volcanic sequence is exclusively
composed of phase II lava flows. Because these three sections are several kilometers apart, a stratigraphic correlation from one section to the other was impossible
independent of that provided by the magnetic data. It is
noteworthy that we could not resample either Watkins
et al. 's [1972]
section
near Port Alfred, which
is now
in a
protected area for sea birds, or his Morne Rouge section
where no good outcrops were found. Instead, we tried to
sample one section down from the Alfred Faure base at
Bollard (BO) but could only collect cores from a single
flow belonging
to phase
II. Along each section,
we col-
lected an average of seven cores from each consecutivevolcanic
unit using a gasoline-powered
portable
drill.
Samples were oriented using a magnetic compass cor-
rected for local anomaly by sighting the Sun and known landmarks. In all, we collected 320 oriented cores from
45 units. Flows
are usually
thin and seldom
exceed
10
m in thickness. Because they are horizontal or nearhorizontal, no tilt correction has been made.
4. Experimental Procedure
Determination of the direction of characteristic reina- nent magnetization (ChRM) in the laboratory encoun-
tered
several
difficulties.
First, the 15-day
magnetic
vis-
cosity
index
[ Thellier
and
Thellier,
1944;
Privot,
1981]
was estimated on two thirds of the collection by mea-CAMPS ET AI ' GEOMAGNETIC PALEOSI'_'CUi.AR VARIATION IN PLIO-PLEISTOCENE 1963
• I. LI
1964 CAMt)S ET AL.: GEOMAGNETIC PALEOSECULAR VARIATION IN PLIO-PLEISTOCENE W a
60
mTo.
,o.40
mT
• •..•.20
•
'"o... 10
rnT
mT
x,•
"0'...5
rnT
.Down S i 5803O0
25••"•
©
•'"0 480 400
/
kT•,a'
/
E Down o Wb
w5 ,,•
10 mT "•', -•S
,... !
d
90mT N Down' o 10mT 2O•m
-o--
o--
o--
- -o- 'i..-1IO
-
Down o ' 10 mT
,•, 6mT
!5 m •-o. 4 mT•
NRM
1:t25 mT•45 mT
• ti50
mT
•o,•90
m']
w 9,
s Nf
! ! ! ! ! ! ! ! LT N Down DownFigure 2. Orthogonal
vector
plots of stepwise
paleomagnetic
cleaning
of representative
samples
(core coordinates).
Example
of samples
with no significant
overprint
(a) flow ALl4, specimen
193C, and strong
viscous
overprint
(b) flow PC2, specimen
14C. Demagnetization
diagrams
of two
specimens
from the same
core
(flow CN15) illustrate
the poor quality
of thermal
treatment
of (c)
specimen
310B compared
to AF cleaning
of (d) specimen
310A and the acquisition
of spurious
GRM component
of (e) flow PC1, specimen
005A which is successfully
removed
(f) specimen
005C following
a special
procedure
(see
text for explanation).
We recommend that our results do not complete but
supersede the ones described by Watkins et al. [1972]
because the directions do not corroborate each other, at least for the CN section which was resampled exactly at the same place, and because the former directions were calculated using the method of the minimum scat-
ter criterion. This method, no longer used in current
research,
consisted
of AF-demagnetizing
specimens
at
various
steps (maximum
30 mT in this case)
and then
combining the core directions obtained at any demagne-
tization steps
to calculate
the average
direction
yielding
the minimum within-flow scatter. First, it is obviousCAMPS
ET AL.: GEOMAGNETIC
PAI•EOSECULAR
VARIATION
IN PLIO-PLEISTOCENE
1965suring the remanent magnetization first after 2 weeks
of storage
with the ambient
field parallel
to the posi-
tive cylindrical
axis of each specimen
(M1), and then
after
another
two-week
storage
in zero
field (M2). The
viscosity
index (F) is expressed
in percent
by
- M2I IM21 with
M1 = NRM+VRMzab
M2 = NRM
where NRM is the "stable" natural remanent magneti-
zation, which of course includes some viscous reinanent
magnetization
(VRM) fraction
acquired
prior to the vis-
cosity test, and VRMLab the VRM acquired duringthe first 2-week storage in the ambiant field, and nor-
mally destroyed during the 2-week storage in zero field. Viscosity index measured from the Possession basalts
ranges
from <1% to >100%. It shows
a lognormal
dis-
tribution characterized by a median value of 5% and a geometric average of 15 4- 3% (95% interval for the mean) which is rather high compared to the mean value of 6.1 4- 0.7% found for some upper Tertiary and pre- Bruhnes quaternary subaerial volcanic rocks [Prgvot, 1981]. The high viscous index could be due to the pres- ence in Possession basalts of nearly superparamagneticsingle-domain grains as it has been shown for subaerial
lava [Pr•vot, 1981] or for synthetic
magnetite [Dun-
lop, 1983]. The large number of highly viscous
sam-
ples warns us that significant VRM overprints are likely,since the ratio of VRM acquired in situ since the begin- ning of the Bruhnes polarity epoch, to the ChRM is estimated for subaerial lava to be -• 3-4 times as large
as the viscosity index [Prdvot, 1981]. Because we be- lieve, as has been shown by one of us [Prdvot, 1981],
that heating in a zero field is the most efficient clean- ing method for VRM, we treated one pilot sample from
each rock unit by stepwise thermal demagnetization us-
ing a noninductive PYROX furnace with a residual field
<20 nT. Surprisingly, this treatment provided demag- netization diagrams of poor quality which were difficult
to interpret
(Figure 2c). This behavior,
somewhat
un-
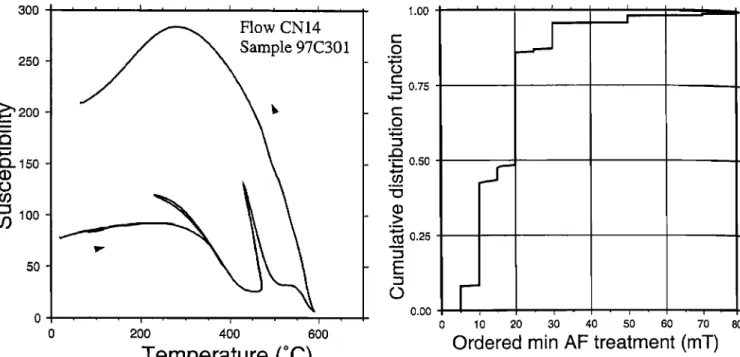
usual for young basalts, could be explained by large instability of samples upon heating which is always ob-served for the few low-field susceptibility measurements
performed
under vacuum
(< 10
-2 mbar) (Figure
3).
Consequently,
we decided
to use alternating
fields
(AF)
cleaning
using a laboratory
built AF demagnetizer
in
which the sample is stationary and subjected to fields up to 140 roT.Second,
during AF processing,
many samples
re-
vealed an atypical easiness to acquire a spurious an-hysteritic
remanent
magnetization
(ARM) due to the
presence of a small direct field in our device not pre- viously detected. Thus we repeated, for these samples,each demagnetization step for two reversed positions
of the sample
then averaged
the two measurements
for
each duplicated step in order to reduce the ARM effect on the calculated direction of the remaining NRM.Finally, in a few cases for which the demagnetiza-
tion curve
does
not decay
to the origin (Figure 2e), we
suspect that an artificial gyroremanent magnetization(GRM) was induced
during AF cleaning. In princi-
ple, GRM is acquired
by particularly
anisotropic
single
domain
grains [Edwards,
1982; Roperch
and Taylor,
1986],
in a direction
perpendicular
to both the applied
AF axis and the easy
axis of magnetization
[Stephen-
son, 1980]. The GRM magnitude is maximum when the angle between AF and anisotropy axis is 45øandzero when these two axes are parallel or perpendicu-
lar to each other. Therefore GRM is suppressed by
demagnetizing and measuring successively each compo-
nent at each step of the AF processing [Dankers and Zijderveld, 1981]. This measurement procedure greatly
increased the quality of our demagnetization diagrams
(Figure 2f). The overall complex remanence behavior
prevented us from using the remanence intensities as proxy for paleointensity as was done with Icelandic and
Hawaiian
volcanic
sequences
[Camps
and Pr•vot, 1996].
Nor could we determine the absolute intensity of the paleofield, since very few samples satisfied the usual se-
lection criteria.
5. Results
Following carefully chosen (to avoid spurious rema- nence) and very detailed AF demagnetization proce- dures involving up to 18 cleaning steps, the ChRM was successfully isolated from significant secondary compo•
nents (Figure
4) for almost
90% of samples.
We think
that the natural magnetic overprint is likely of viscous origin because the components with low unblocking fields are generally directed along the present-day fielddirection. Thus we observe that the geometric average
intensity of NRM is larger for the normal (6.2 4. 0.4
A/m, 95% interval
confidence
for the average)
than for
the reversely
(2.2 4. 0.3 A/m) magnetized
rocks. This
interpretation is further validated by the rather large viscosity indices reported above. We determined theChR.M
by means
of a least-squares
method [Kirschvink,
1980]. Nearly
all directions
computed
provide
a maxi-
mum angular
deviation
of < 2 ø. Among
the 10% of re-
jected
samples
are also
those
which
gave
a significantly
different direction from that of the other samples from the same flow if field notes indicated possible misorien-
tation. The flow average directions are listed together
in Table 1 with the parameters from the Fisher's statis-
tics. Only for flow PC7, no mean stable
direction
could
be successfully
determined.
With the exception
of flow
PC1, the ChRM directions
are well clustered
in each
flow with rather small values of the 95% confidence cone
!966 CAMPS ET AL.' GEOMAG_•TIC PALEOSECULAR VARIATION IN PLIO-PLEISTOCENE 300 250 200 •50 •00 50- ,
•
Flow
CN14
7C301 "' "" '" ' ' I .... ' ' "'" ' I ... ' ' ' '• '"1'' "•- 200 400 600Temperature (øC)
Figure 3. Examt)le of thermal dependence
of weak
fiel(! magnetic susceptibility
under vainmin. Heating
m•(t cooling (n•rves are indicated by arrows. For the fewsan•t'fies
measured,
the curves
are always
irreversible.
that s•ch a znett•od is not suitable for rocks overprinted
})y large
secondary
comp(ments,
as for many
of the Pos-
session
lslm.t ha.
salts;
a processing
of 30 mT may not be
s•ffii(:ient
to retrieve
the prinmry
component
(Figure
5).
Sec(.M,
this method
is not efficient
in detecting
the ac-
(l•fisit,
ion of spuriotas
ARM and GRM components
from
A F t,r'eatmmd, as low as 10 roT, as occurs in the present
st,•.ty.
For example,
we believe
that the intermediate
di-
1.00
,
0.75
• 0.50
;• 0.25
'
0.00 0 20 40 60 80 100 120 140 160Ordered Angle (NRM-GhRM)
Figure 4. Cumulative
distribution
function
for the an-
gles
between
the ChRM and NRM directions.
1.00 0.75 ß r- 0.50 , I , , I , , , I ,, , I ,
__.__l
, , ... i , i ß , i 0.25 0.00 0 10 20 30 40 50 60 70 80Ordered min AF treatment (mT)
Figure 5. Cumulative
distribution
function
of the first
AF value used in the least squares analysis to compute
the direction of ChRM.
rections initially described by Watkins et at. [1972] cor-
respond to reversed directions which would have been incompletely cleaned of their present-day field viscous overprint. The principal component analysis used in
the present study provides more reliable estimates of
the paleofield directions.
6. Discussion
It seems very speculative to correlate one section to
the others from the paleomagnetic results. The main reason is that the magnetic sequences obtained are very
simple,
and thus they are not constraining
in term of
magnetostratigraphy.
For sections
PC and CN, reversed
polarity units are found in the lower part and normal
units are found in the upper part. Section AL is of nor-mal polarity
throughout
its whole
thickness,
except
for
three consecutive flows yielding excursional directions. A notable result is the absence of intermediate direc- tions between the normal and reverse magnetozones.We have,
however,
some
arguments
to suggest
that the
sampled
sections
do not duplicate
each
other
and that
altogether
they cover
a time interval
long enough
for
providing
a reliable
record
of the history
of field
fluc-
tuations
at Possession
Island (Figure 6). The phase
III units from the CN and PC sections are of norma]polarity
and therefore
should
have
erupted
during
the
Brunhes
epoch,
consistent
with the K-Ar age
of 0.72
Ma obtained
in this
sequence
[Chevallier
et al., 1983].
For the phase
II basalts
the reversed
polarity
obtained
in the PC section
in the top flows
with K-Ar age
of 2.7
:k 0.8 Ma [Chevalliev
et al., 1983]
could
correspond
to
the end
of the Gilbert
epoch
or to the beginning
of the
CAMPS ET AL.' GEOMAGNETIC PALEOSECULAR VARIATION IN PLIO-PLEISTOCENE 1967
Matuyama
one. Then the bottom
part of PC section,
from
BO section
and
the lower
part of CN section.
Be-
being
also only of reversed
polarity, should
have been
erupted
during the same epoch. We have no clues
for
assigning
a precise
magnetic
chron
to the normal
po-
larity zone corresponding
to the whole
section
AL. We
are certain,
however,
that flows belonging
to the same
chron have not been sampled elsewhere since phase IIunits from the other sections
are of reverse
polarity.
The only doubt we have concerns the phase II unitscause they are, like the phase II PC section, of reversed polarity, we assumed tentatively that they also belong
to the beginning
of Matuyama or to the end of Gilbert
chron. Notwithstanding age uncertainties, it is likelythat the three sections complement each other with no
(or small) overlapping in time (Figure 6). Nevertheless, given the episodic nature of volcanism, the question re-
mains whether the time elapsed between successive lava
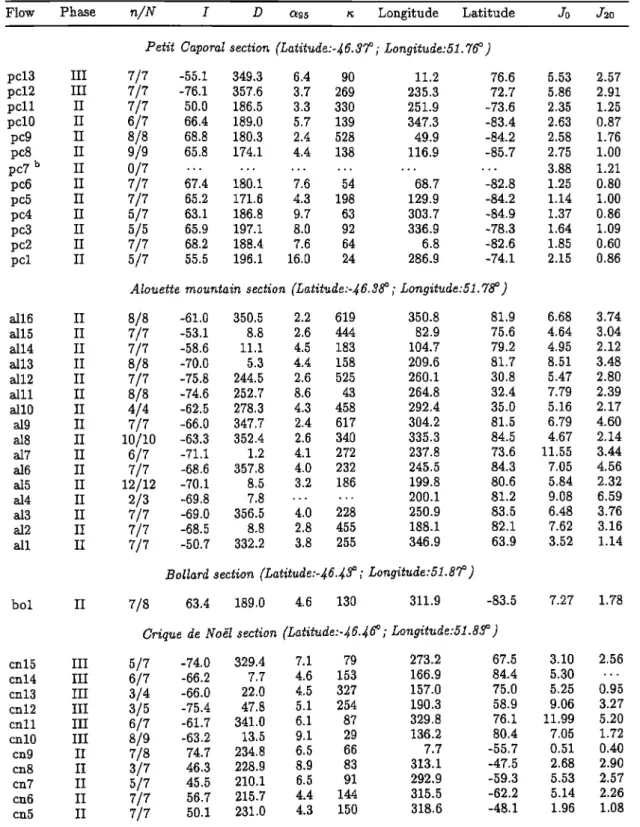
Table 1. Directional Results
Flow Phase n/N f D c•95 Longitude Latitude Jo J•o
Petit Caporal section (Latitude:-J6.$7 ø; Longitude:51.76 ø)
pc13 III 7/7 -55.1 349.3 6.4 90 pc12 III 7/7 -76.1 357.6 3.7 269 pcll II 7/7 50.0 186.5 3.3 330 pclO II 6/7 66.4 189.0 5.7 139 pc9 II 8/8 68.8 180.3 2.4 528 pc8 II 9/9 65.8 174.1 4.4 !38
pc7 b
II
0/7
...
pc6 II 7/7 67.4 180.1 7.6 54 pc5 II 7/7 65.2 171.6 4.3 198 pc4 II 5/7 63.1 186.8 9.7 63 pc3 II 5/5 65.9 197.1 8.0 92 pc2 II 7/7 68.2 188.4 7.6 64 pcl II 5/7 55.5 196.1 16.0 24 11.2 76.6 5.53 2.57 235.3 72.7 5.86 2.91 251.9 -73.6 2.35 1.25 347.3 -83.4 2.63 0.87 49.9 -84.2 2.58 1.76 116.9 -85.7 2.75 1.00 ... 3.88 1.21 68.7 -82.8 1.25 0.80 129.9 -84.2 1.14 1.00 303.7 -84.9 1.37 0.86 336.9 -78.3 1.64 1.09 6.8 -82.6 1.85 0.60 286.9 -74.1 2.15 0.86Alouette mountain section (Latitude:-J6.38ø ; Longitude:51. 78 ø )
8116 II 8/8 -61.0 350.5 2.2 619 350.8 81.9 8115 !I 7/7 -53.1 8.8 2.6 444 82.9 75.6 8114 II 7/7 -58.6 11.1 4.5 183 104.7 79.2 8113 II 8/8 -70.0 5.3 4.4 158 209.6 81.7 8112 II 7/7 -75.8 244.5 2.6 525 260.1 30.8 alll II 8/8 -74.6 252.7 8.6 43 264.8 32.4 all0 II 4/4 -62.5 278.3 4.3 458 292.4 35.0
819
II
7/7
-66.0 347.7
2.4 617
304.2
81.5
818 II 10/10 -63.3 352.4 2.6 340 335.3 84.5 817 II 6/7 -71.1 1.2 4.1 272 237.8 73.6 816 II 7/7 -68.6 357.8 4.0 232 245.5 84.3815
II
12/12 -70.1
8.5
3.2 186
199.8
80.6
814
II
2/3
-69.8
7.8
...
200.1
81.2
813
II
7/7
-69.0 356.5
4.0
228
250.9
83.5
812
II
7/7
-68.5
8.8
2.8 455
188.1
82.1
all
II
7/7
-50.7 332.2
3.8 255
346.9
63.9
bol IIBollard section (Latitude:-J6.J3 ø; Longitude:51.87ø)
7/8
63.4 189.0 4.6 130
311.9
-83.5
Crique
de Nok'I
section
(Latitude:-J6.,•6ø;
Longitude:51.83ø)
cn15
III
5/7
-74.0 329.4 7.1
79
273.2
67.5
cn14
III
6/7
-66.2
7.7
4.6 153
166.9
84.4
cn13
III
3/4
-66.0 22.0 4.5 327
157.0
75.0
cn12
III
3/5
-75.4 47.8 5.1 254
190.3
58.9
cn11
III
6/7
-61.7 341.0 6.1
87
329.8
76.1
cn10
III
8/9
-63.2 !3.5
9.1
29
136.2
80.4
cn9
II
7/8
74.7 234.8 6.5
66
7.7
-55.7
cn8
II
3/7
46.3 228.9 8.9
83
313.1
-47.5
cn7
II
5/7
45.5 210.1 6.5
91
292.9
-59.3
cn6
II
7/7
56.7 215.7 4.4 144
315.5
-62.2
cn5
II
7/7
50.1 231.0 4.3 150
318.6
-48.1
6.68 4.64 4.95 8.51 5.47 7.79 5.16 6.79 4.67 11.55 7.05 5.84 9.08 6.48 7.62 3.52 7.27 3.10 5.30 5.25 9.06 11.99 7.05 0.51 2.68 5.53 5.14 1.96 3.74 3.04 2.12 3.48 2.80 2.39 2.17 4.60 2.14 3.44 4.56 2.32 6.59 3.76 3.16 1.14 1.78 2.56 . . . 0.95 3.27 5.20 1.72 0.40 2.90 2.57 2.26 1.081968 CAMPS ET AL.' GEOMAGNETIC PALEOSECULAR VARIATION IN PLIO-PLEISTOCENE
Table 1. (continued)
Flow Phase n/N
I D c•9• n Longitude Latitude J0 J•.ocn4 ii 5/7 62.2 205.0 5.2 !47 321.3 -72.1 2.73 1.71
(:n3 II 7/8 50.5 147.6 2.7 379 161.8 -60.8 3.14 0.94
on2 II 7/7 46.8 148.9 5.9 70 168.0 -59.5 2.00 0.96
cnl Ii 7/7 52.7 159.6 3.7 287 174.9 -69.6 2.84 1.67
• Plows are listed in stratigraphic order with the youngest on top, oldest on the bottom. The volcanic
phases
are inferred
t¾om
the geological
map (Figure
1) [Chevallier,
1981]
and
field
observations;
n/N is
the number of samples used in the analysis/total number of samples collected; I and D are the mean in- elination positive downward and declination east of north, respectively; a9• is 95% confidence cone aboutaverage. direction; Longitude and Latitude correspond to VGP position; Jo and J2o are the geometric •nean remanence intensities in A/m of NI'iM and after 20 mT alternating field treatment, respectively.
•' Very scattereel directions.
fi(•ws is long enough c•;mpared to the rate of secular variatim• of the geomagnetic field. !f not, oversampling of the same field directions fi'om lava flows clustered i,empr•rally will skew the estimate of the paleosecular
variation. Unfortunately, without very accurate age de- terminations for each flow, we have no objective means
of aw•raging or discarding similar successive directions,
since the rate of secular variation is itself variable, and
thus similar paleo•nagnet, ic (liteorions may be due to
rea,1
stasis
of sem•lar
variation [Love, 2000]. Thus we
have to a, ss•mm, t, entatiwdy, that t, he paleodirections ob- tained correspond to a reasonable rando•n sampling ofl,h{• field fiuctuat, im•s over the Plio-Pleistocene period. The characterizati{m of the paleosecular variation was
(h•ne by means of st, atistical tech•fiques common in pa-
lcomagnetism.
We processed
the data by reversing
the
directirms of reversed polarity and removing those hawing a VGP latitude less
than an arbitrarily chosen
cut,-
off t,o avoid inclusion of transitional data. The secularvariation was estimated by the total angular standard
deviation (asd) expressed in degrees as •qT in
where N is the number of data and 5i is the angular
distance between the ith field direction or VGP posi- tion and the direction or VGP position about which the dispersion is computed, corrected for the experimental errors by calculating the between-flow asd expressed in degrees as $B in
where fi is the mean number of sample cores per lava,
$w • 81ø/v/•, and • the mean
precision
parameter.
The dispersion statistics of local field directions and cor- responding VGPs are given in Tables 2 and 3, respec-,,.
I
PC 12-13 PC 1-11!• 0.72
1.03 +/- 0.4+/-
0.11
CN 10-15 Erosion BO 1 AL 1-16 Phase II Phase I -2 -3 -4 -5 _6 -7Figure 6. Relationship
between
the sampled
sections,
the geomagnetic
polarity
timescale
for the
last 7 Myr [Cande
and Kent, 1995],
and the chronostratigraphic
evolution
of Possession
Island
CAMPS ET AL.: GEOMAGNETIC PALEOSECULAR VARIATION IN PLIO-PLEISTOCENE
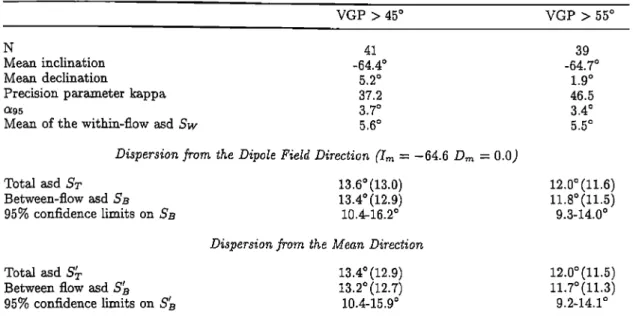
Table 2. Dispersion
Statistics
of Flow-Average
Directions
1969
VGP > 45 ø VGP > 55 ø
N 41 39
Mean inclination _64.4 ø _64.7 ø
Mean declination 5.2 ø 1.9 ø
Precision parameter kappa 37.2 46.5
a95 3.7 ø 3.4 ø
Mean of the within-flow asd Sw 5.6 ø 5.5 ø
Dispersion from the Dipole Field Direction (In = -64.6 D,• = 0.0)
Total asd $:, Between-flow asd $s 95% confidence limits on $s 13.6ø (13.0) 13.4ø(12.9) 10.4-16.2 ø
Dispersion from the Mean Direction
12.0ø(11.6) 11.8ø(11.5)
9.3-14.0 ø
Total asd $•, 13.4 ø (12.9) 12.0 ø (11.5)
Between flow asd $• 13.2ø(12.7) 11.7ø(11.3)
95% confidence limits on $• 10.4-15.9 ø 9.2-14.1 ø
a N, number of lava flow included in the analysis; asd, angular standard deviation; see text for expla- nation of subscripts T, W, and B. The 95% confidence limits are computed using the jackknife method
[Efron and Tibshirani, 1986]. Numbers in parentheses correspond to asd calculated from Watl•ins et aI. 's [1972] data set.
Table 3. Dispersion statistics of Virtual Geomagnetic Poles
VGP > 45 ø VGP > 55 ø Possession Island
N 41 39
Average
VGP
latitude
86-4ø
88'0ø
Average
VGP
longitude
157.3ø
179-2ø
Precision
parameter
Kappa
19.6
24.1
a95
5.2
ø
4.8
ø
Total
asd
ST
18'9ø(17'2)
16'8ø(15'5)
Mean
of the within-flow
asd
$w for VGP
7-8
ø
7-6ø
Between-flow
asd
$B
18'6ø
16'5ø
95%
confidence
limits
on $B
14.6-22.4ø
13'2-19'6ø
Marion
Island [Amerigian
et aI., I97J]
N
21
20
Total
asd
ST
20'3ø
18'7ø
Mean
of the within-flow
asd
Sw for VGP
10.9ø
11'0ø
Between-flow
asd
SB
19'9ø
18'3ø
95%
confidence
limits
on SB
14'8-24'2ø
13'9-21'9ø
Possession and Marion Combined
N
62
59
Total
asd
ST
19'2ø
17'3ø
Mean
of the
within-flow
asd
Sw for
VGP
8-5ø
8'4ø
Between-flow
asd
$B
18'9ø
17'0ø
95%
confidence
limits
on
$B
15'9-21'7ø
14'4-19'3ø
•' N, number
of lava
flow
included
in the
analysis;
asd,
angular
standard
deviation;
see
text
for
expla-
nation
of subscripts
T, W, and
B. The
95%
confidence
limits
are
computed
using
the
jackknife
method
[E/ton
and
Tibshirani,
1986].
Numbers
in parentheses
correspond
to asd
calculated
from
Watkins
et al.
's
1970 CAMPS ET AL.: GEOMAGNETIC PAI,IœOSECULAR VARIATION IN PI,IO-PI,EISTOCENE
tively, for two VGP cutoffs (45øand 55ø), with analyses a,l)(nit means ;red a,n axial dipole. We stress that in the
prosent study, the way the dispersion is estimated is
not critical because first the mean direction is not sta-
l, istically different frown 11te direction of an axial dipole
(Table 2) and second because the e•ct of experimental
errors (tltr. mean within-fioxv
dispersion
Sw) is rather
small.
The I•r('sent results agree better with the general
anisotropic palcosecttlar model (CJ98.nz) proposed byCousttzl&'
rind Johr•sor•,
[1999] rather tha,
n with thoir
n•odel wilh axial a•tis{•tropy (C308). The prefbrred model CJ98.nz is able to gencrat,o o)mplex geograt•h-i•':d va, riatio•m assu•ni•g ltm• tim b•n•ndary conditi,,ns a.t, l]•(, c(,ro-n•;udle i•terface are ge,,graphica, lly h•,tero-
g,'n•'(•m. Tire simpdated as•l val, les for VGPs (16.5 ø) a,•l tbr (lir{'('ti(nts (12 ø) fbr l}m Poss•'ssion Island loca,- l, iot• a.re very cl(•so l,o t l•e oxI•,.ri•ental •mes found in
tit' ln'{'sent sl,•l(ly (S'r = 16.8 ø a•d ss = 11.8 ø,
Sl){'('l, ivdy). Itowever, l t•o exI)erin•('•ta,1 95%
limits ()n a.s(l (T;d•l(,s 2 a,•t(l 3), conq•ted t•y means of
th' ja('kk•if(, m{'l,t•o(l [Efro'rt
•z,•d Tibsh,
ira'•zi,
1986], are
ral, l•,r wide and tt,•s l)r('wm* a. firm ('{)n('l•sion. To
ta, in a r{,s•lt wil, l• •arrow c'o•fid{.ncc limits, we combi•cd
()•lr (lai, a wittt tltose alre:•dy I)•tblislt(d for Mario• Island
[Am, erigiart el, al., 1971] wttict• is located only 15øof lon-
gil,•(l{, west to Cr{•zet Archipelag{•. We did not include
i•t t t•i.s analysis tt•e •lireclions d(,scribed fro•'•t East Is- la•l [Wal]ri'ns el a[., 1972], w}tich is l(•ca, l,od 18 k•n east t{) l,]l{' l'{•ss{,ssi{•n lsla•(l }•(.c'a•sc first East Island lava, t•ave si•ila, r l•ci,rological ('haracl,eristics [Ou,,•t, et al., 1972] t,}•at• P(•ss('ssi(• })asali,s, and se('(n•d i,l•(, directio•t
w•'•e {J•l(•ined using tl•e •ncl,t•o(l •f 1,t•. ndni•n'•m• scal-
ter criterion. Tl,,ir reliabilil,y is i, lms rtuestionable. The regimm, l values ot' asd ol)tained (Tal)le 3) are roughly tho same as those obtained for Possession Island alone
and thus still agree with the general anisotropic model
CJ98.nz [Constable
and Johnson,
1999]. In the absence
of intensity data we are not able to check more precisely
this model, nor the Camps and Pr•vot [1996] model of
fluctuations of the geomagnetic field.
The geomagnetic field excursion (N-T-N) recorded in
the phase II lava from AL section is of particular in-
terest (Figure 7) because it provides VGPs lying within
one of the two preferred longitudinal bands for transi-
tional VGPs obtained from sedimentary records [Laj et al., 1991]. This observation fits with the general
anisotropic model, as do our PSV results. Still, the con-
troversial question remains [Love, 1998; Camps et al., 1999] whether these preferred longitude sectors might be an artifact of remanence acquisition in sedimentary
rocks [Privot and Camps, 1993] or indirect evidence
for a thermal control of the Earth's core dynamics by
the lower mantle [Laj et al., 1991].
7. ConclusionWe presented here a new paleomagnetic study of the
volcanic sequence from Possession Island. This study
180 ø 0 ø
o C)
o
o
•8 -
Figure 7. Virtual geomagnetic
pole positions
for Pos-
session Island lava flows. Equal Area projection of aportion
of (a) Northern
and (b) Southern
Hemisphere.
Circles, AL section; solid triangles, PC section; open triangles, BO unit; squares, CN section.emphasized the particularly complex behavior of the
remanence, which obliged us to apply particularly care-
ful experimental procedures to isolate the ChRM. We
think that such behaviors can explain our di•culties
to corroborate the paleofield directions obtained in the present study and those previously reported [Watkins et al., 1972], at least for the Crique de Noi51 section
which was resampled
exactly at the same place. In
particular, we do not confirm the presence of inter- mediate directions within the Brunhes epoch. Hence
CAMPS
ET AL.: GEOMAGNETIC
PAZEOSECULAR
VARIATION
IN PLIO-PLEISTOCENE
1971ones from the former study guessed to be less reliable. This raises the question of the reliability of the direc-
tions
described
from
East
Island
(Crozet
Archipelago),
[Watkins
et al., 1972],
since
they have
similar
petro-
logical
and radiochronoiogical
characteristics
[Gunn
et
al., 1972]. Our palcosecular
variation
estimates
seem
to
support
models
with longitudinal
anisotropy.
However,
we do not have a sufficient number of paleofie!d direc- tions to enable us to confirm this interpretation. Forthat, it would be necessary
to repeat and complete
a
paleomagnetic
study of lava flows from East Island in
order to increase the number of palcomagnetic observa- tions for this area of the Indian Ocean.Acknowledgments. We are grateful to the "Institut
Fran•ais pour la Recherche etles Technologies Polaires"
for providing all transport facilities and for the support of this project. Special thanks to A. Lamalle and all our field friends. We thank Peter Weiler for his careful check of the
English style of the first version of this paper and Anne
DelpIanque for assistance with computer drawing. The com- ments of Laurie Brown, Shaul Levi, and Pierrick Roperch helped to improve this paper. This work was supported by
CNI•S-INSU programme int•rieur Terre (contribution 247).
References
Amerigian, C., N.D. Watkins, and B.B. Ellwood, Brunhes epoch geomagnetic secular variation on Marion island: Contribution to evidence for a long-term regional geomag- netic secular variation maximum, J. Geomagn. Geoelectr., œ6, 429-441, 1974.
Camps, P., and M. Pr•vot, A statistical model of the fluctu- ations in the geomagnetic field from paleosecular variation to reversal, Science, 273, 776-779, 1996.
Camps, P., R.S. Cot, and M. Pr•vot, Transitional geo- magnetic impulse hypothesis: Geomagnetic fact or rock- magnetic artifact?, J. Geophys. Res., 104, 17,747-17,758,
1999.
Cande, S., and D.V. Kent, Revised calibration of the geo- magnetic polarity timescale for the' late Cretaceous and Cenozoic, J. Geophys. Res., 100, 6093-6095, 1995.
Chevallier, L., Carte g•ologique au 1:50 000. Archipe!
Crozet, Ile de la Possession, Comit• Nat. Fr. Rech. Antarct., 50, 16 pp., 1 map, 1981.
Chevallier, L., J. Nougier, and J.M. CantagreI, Voicanol-
ogy of Possession Island, Crozet Archipelago (TAAF), in Antarctic Earth Science, edited by I•.L. Oliver et al., pp.
652-658, Cambridge Univ Press, New York,1983.
Constable, C.G., and C.L. Johnson, Anisotropic paleosecu- lax variation models: Implications for geomagnetic field observables, Phys. Earth Planet. Inter., 115, 35-51, 1999. Dunkers, P.H., and J.D.A. Zijderveld, Alternating field de-
magnetization and the problem of gyro-magnetic rema-
hence, Earth Planet. $ci. Left., 53, 89-92, 1981.
Dunlop, D.J., Viscous magnetization of 0.04-100 /•m mag-
netites, Geo•hys. J. t•. Astron. $oc., 7J, 667-687, 1983. Edwards, J., Gyroremanent magnetization produced by
specimen rotation between successive alternating field
treatments, Geophys. J. R. Astron. Sot., 71, 199-214,
1982.
Elton, B., and 1•. Tibshirani, Boostrap methods for stan-
dard errors, confidence intervals, and other measures of
statistical accuracy, Star. $ci., 1, 54-77, 1986.
Goslin, J., M. l•ecq, and 1•. Schlich, Eraplacement and evo-
lution of the Madagascar ridge and Crozet submarine
plateau, Bull. $oc. G•ol. Fr., 7, 609-618, 1981.
Gunn, B.M., E.C. Abranson, N.D. Watkins, and J. Nougier, Petrology and geochemistry of Iles Crozet: a summary, in Antarctic Geology and Geophysics, edited by l•.J. Adie,
pp 825-829, Univ. forlager Oslo, 1972.
Kirschvink, J.L., The least-squares line and plane and the
analysis of paleomagnetic data, Geophys. J. R. Astron.
$oc., 62, 699-718, 1980.
Laj, C., A. Mazaud, R. Weeks, M. Fuller, and E. Herrero- Bervera, Geomagnetic reversal paths, Nature, 34i, 447,
1991.
Love, J.J., Paleomagnetic volcanic data and geometric reg-
ularity of reversals and excursions, J. Geophys. Res., 103, 12,435-12,452, 1998.
Love, J.J., Statistical assessment of preferred transitional
VGP longitudes based on paleomagnetic volcanic data,
Geophys. Y. œnt., 1j0, 1, 211-221, 2000.
McElhinny, M.W., and P.L. McFadden, Palaeosecular vari- ation over the past 5 Myr based on a new generalized database, Geophys. J. Int., 181, 240-252, 1997.
Merrill, R.T., M.W. McElhinny, and P.L. McFadden, The magnetic field of the Earth: Paleomagnetism, the core, and the deep mantle, Int. Geophys. Set., vol. 63, edited by 1•. Dmowska and J.R. Holton, 538 p, Academic press, San Diego, Calif., 1996.
Pr•vot, M., Some aspects of magnetic viscosity on subaerial and submarine volcanic rocks, Geophys. J. •. Astron. $oc., 66, 169-192, 1981.
Pr•vot, M., and P. Camps, Absence of preferred longitude sectors for poles from volcanic records of geomagnetic re- versals, Nature, 366, 53-57, 1993.
Roperch, P., and G.K. Taylor, The importance of gyro- magnetic remanence in alternating field demagnetization. Some new data and experiments on G.R.M. and R.I•.M., Geophys. J. R. Astron. $oc., 87, 949-965, 1986.
Stephenson, A., Gyroremanent magnetization in anisotropic magnetic material, Nature, 284, 49, 1980.
Thellier, E., and O. Thellier, Recherches g•omagn•tiques sur les coul•es volcaniques d'Auvergne, Ann. Geophys., I, 37-52, 1944.
Watkins, N.D., A. Hajash, and C.E. Abranson, Geomag-
netic secular variation during the Brunhes epoch in the
Indian and Atlantic Ocean regions, Geophys. J. fl. As-
tron. Sot., 28, 1-25, 1972.
Watkins, N.D., and J. Nougier, Excursions and secular vari- ations of the Brunhes epoch geomagnetic field in the In- dian Ocean region, J. Geophys. Res., 78, 6060-6068, 1973. Watkins, N.D., B.M. Gunn, J. Nougier, and A.K. Baksi, Kerguelen continental fragment or oceanic island?, Bull.
Geol. Soc. Am., 85, 201-212, 1974.
Watkins, N.D., I. McDougall, and J. Nougier, Paleomag- netism and potassium-argon age of St. Paul Island, South Eastern Indian Ocean: Contrasts in geomagnetic secular vaxiation during the Brunhes epoch, Earth Planet. $ci. Lett., 24, 377-384, 1975.
P. Camps, L. Faynot and M. Prdvot, CNRS and ISTEEM, Lab. de Gdophysique, Tectonique et S•dimentologie, Uni- versit(• Montpellier 2, Case 060, 34095 Montpellier Cedex 5, France. (camps@dstu.univ-montp2.fr; faynot@dstu.univ-
montp2.fr; prevot@dstu.univ-montp2.fr;)
B. Henry, CNRS and Lab. G(•omagn•tisme et
Pal•omagn•tisme de I'IPG Paris, 4 avenue de Neptune, 94107 Saint-Maur cedex, France. (henry@ipgp.jussieu.fr) (Received April 12, 2000; revised August 14, 2000; accepted October 2, 2000.)

![Figure 6. Relationship between the sampled sections, the geomagnetic polarity timescale for the last 7 Myr [Cande and Kent, 1995], and the chronostratigraphic evolution of Possession Island](https://thumb-eu.123doks.com/thumbv2/123doknet/14740161.576106/9.937.160.804.114.222/relationship-sections-geomagnetic-polarity-timescale-chronostratigraphic-evolution-possession.webp)