HAL Id: insu-01448138
https://hal-insu.archives-ouvertes.fr/insu-01448138
Submitted on 6 Aug 2020
HAL is a multi-disciplinary open access
archive for the deposit and dissemination of
sci-entific research documents, whether they are
pub-lished or not. The documents may come from
teaching and research institutions in France or
abroad, or from public or private research centers.
L’archive ouverte pluridisciplinaire HAL, est
destinée au dépôt et à la diffusion de documents
scientifiques de niveau recherche, publiés ou non,
émanant des établissements d’enseignement et de
recherche français ou étrangers, des laboratoires
publics ou privés.
Distributed under a Creative Commons Attribution| 4.0 International License
Challenging the sensitivity limits of Paleomagnetism:
Magnetostratigraphy of weakly magnetized
Guadalupian–Lopingian (Permian) Limestone from
Kyushu, Japan
Joseph Kirschvink„ Yukio Isozaki, Hideotoshi Shibuya, Yo-Ichiro Otofuji„
Timothy Raub„ Isaac Hilburn„ Kasuya, Teruhisa, Masahiko Yokoyama,
Magali Bonifacie
To cite this version:
Joseph Kirschvink„ Yukio Isozaki, Hideotoshi Shibuya, Yo-Ichiro Otofuji„ Timothy Raub„ et al..
Challenging the sensitivity limits of Paleomagnetism: Magnetostratigraphy of weakly magnetized
Guadalupian–Lopingian (Permian) Limestone from Kyushu, Japan. Palaeogeography,
Palaeoclima-tology, Palaeoecology, Elsevier, 2015, 418, pp.75-89. �10.1016/j.palaeo.2014.10.037�. �insu-01448138�
Challenging the sensitivity limits of Paleomagnetism:
Magnetostratigraphy of weakly magnetized Guadalupian
–Lopingian
(Permian) Limestone from Kyushu, Japan
Joseph L. Kirschvink
a,b,⁎
, Yukio Isozaki
c, Hideotoshi Shibuya
d, Yo-ichiro Otofuji
e, Timothy D. Raub
f,
Isaac A. Hilburn
a, Teruhisa Kasuya
c, Masahiko Yokoyama
e, Magali Bonifacie
ga
Division of Geological & Planetary Sciences, California Institute of Technology 170-25, Pasadena, CA 91125, USA
b
Earth-Life Science Institute, Tokyo Institute of Technology, Meguro, Tokyo 152-8550, Japan
c
Dept. Earth Sci. Astron., Univ. Tokyo, Meguro, Tokyo 153-8902, Japan
dDept. Earth & Env. Sci., Kumamoto Univ., Kumamoto 860-8555 Japan e
Dept. Earth Planet. Sci., Kobe Univ., Kobe 657-8501, Japan
f
Dept. of Earth Sciences, University of St Andrews, St Andrews, KY16 9AL Scotland UK
g
Institut de Physique du Globe de Paris, Laboratoire Géochimie des Isotopes Stables, IPGP, Bureau 515, rue Jussieu, 75238 Paris cedex 05, France
a b s t r a c t
a r t i c l e i n f o
Article history: Received 5 July 2014
Received in revised form 14 October 2014 Accepted 28 October 2014
Available online 4 November 2014 Keywords: Paleomagnetism Limestone Permian Kiaman superchron Illawarra Reversal Mass extinction
Despite their utility for bio- and chemostratigraphy, many carbonate platform sequences have been difficult to analyze using paleomagnetic techniques due to their extraordinarily weak natural remanent magnetizations (NRMs). However, the physical processes of magnetization imply that stable NRMs can be preserved that are many orders of magnitude below our present measurement abilities. Recent advances in reducing the noise level of superconducting magnetometer systems, particularly the introduction of DC-SQUID sensors and develop-ment of a low-noise sample handling system using thin-walled quartz-glass vacuum tubes, have solved many of these instrumentation problems, increasing the effective sensitivity by a factor of nearly 50 over the previous techniques of SQUID moment magnetometry.
Here we report the successful isolation of a two-polarity characteristic remanent magnetization from Middle– Late Permian limestone formed in the atoll of a mid-oceanic paleo-seamount, now preserved in the Jurassic ac-cretionary complex in Japan, which had proved difficult to analyze in past studies. Paleothermometric indicators including Conodont Alteration Indices, carbonate petrology, and clumped isotope paleothermometry are consis-tent with peak burial temperatures close to 130 °C, consisconsis-tent with rock magnetic indicators suggesting fine-grained magnetite and hematite holds the NRM. The magnetic polarity pattern is in broad agreement with pre-vious global magnetostratigraphic summaries from the interval of the Early–Middle Permian Kiaman Reversed Superchron and the Permian–Triassic mixed interval, and ties the Tethyan–Panthalassan fusuline zones to it. Elevated levels of hematite associated with the positiveδ13C
carbof the Kamura event argue for a brief spike in en-vironmental oxygen. The results also place the paleo-seamount at a paleolatitude of ~12° S, in the middle of the Panthalassan Ocean, and imply a N/NW transport toward the Asian margin of Pangea during Triassic and Jurassic times, in accordance with the predicted trajectory from its tectono-sedimentary background. These develop-ments should expand the applicability of magnetostratigraphic techniques to many additional portions of the Geological time scale.
© 2014 The Authors. Published by Elsevier B.V. This is an open access article under the CC BY license (http://creativecommons.org/licenses/by/3.0/).
1. Introduction
A fundamental goal of stratigraphy is to establish interbasin correla-tions with globally-isochronous time horizons, including the critical stratotype horizons, and to correlate these to the magnetic reversal
patterns of the Geomagnetic Reversal Time Scale (GRTS), which should be essentially isochronous on a global scale. Most of the global
stratotype sections and points (GSSPs) have been defined in
fossilifer-ous, shallow marine carbonate platform sequences due to their proven ability to record pristine biological and geochemical records of Earth
his-tory. Unfortunately, it is well known that biostratigraphically-defined
zone boundaries are often diachronous, and local oceanographic and
geo-logical effects can influence geochemical proxies for chemostratigraphic
correlation.
⁎ Corresponding author at: Division of Geological & Planetary Sciences, California Institute of Technology 170-25, Pasadena, CA 91125, USA. Tel.: +1 626 395 6136.
E-mail address:[email protected](J.L. Kirschvink).
http://dx.doi.org/10.1016/j.palaeo.2014.10.037
0031-0182/© 2014 The Authors. Published by Elsevier B.V. This is an open access article under the CC BY license (http://creativecommons.org/licenses/by/3.0/).
Contents lists available atScienceDirect
Palaeogeography, Palaeoclimatology, Palaeoecology
Efforts to use paleomagnetic techniques for unraveling magnetic po-larity patterns in many GSSPs, however, have often proven frustrating.
Prominent examples include the original definition of the Silurian–
Devonian stratotype at Klonk, in the Czech Republic, where the metamorphic grade appears to have been too high to retain primary
paleomagnetism (Ripperdan, 1990), and several Ordovician GSSPs on
Anticosti Island, Canada (Ripperdan, 1990; Seguin and Petryk, 1986),
where many of the pale carbonates were found to be too weakly magne-tized to measure and demagnetize reliably using the conventional tech-niques of 25 years ago. From these studies it was simply not known whether the rocks had concentrations of magnetic minerals too small to produce a measureable moment, or if diagenetic processes and hy-drocarbon migration had destroyed those that were there initially.
It has long been known that the physical processes of aligning magnetic minerals during the formation of sedimentary rocks can pre-serve stable magnetic components that are many orders of magnitude below the measurement ability of the best superconducting rock
(moment) magnetometers (Kirschvink, 1981), even those using the
en-hanced sensitivity of DC-biased superconducting quantum interference
devices (DC-SQUIDs) (Weiss et al., 2001). In fact, the situation is much
worse than this sensor noise limit, as the intrinsic magnetic moment of most of the sample holders used in paleomagnetic studies (background noise) is typically several orders of magnitude higher than the sensor
limit. DC-SQUID sensors in the commercially available 2G Enterprises™
rock magnetometers typically have r.m.s. magnetic moment noise levels
of a few tenths of a pAm2(a few ×10−10emu), whereas most sample
holders measure at a few tens of pAm2(10−7emu), several orders of
mag-nitude higher. Recently, the introduction of acid-washed, thin-walled quartz-glass tubing for supporting samples with a vacuum has lowered this noise greatly by minimizing the amount of extraneous matter in the
sense region of the SQUID magnetometers (Kirschvink et al., 2008).
Coupled with a computer-controlled pick-and-place sample changing system, this permits the large numbers of precise demagnetization exper-iments needed for magnetostratigraphic studies to be performed rapidly.
We chose the Middle–Late Permian limestone from Kamura in
Kyushu, Japan, to test the suitability of these new sample-measuring
techniques because previous rock magnetic work (Yokoyama et al.,
2007) demonstrated that these rocks containedfine-grained magnetite
and hematite, but in concentrations making the NRM difficult to
analyze. Most of the Jurassic accretionary complex in SW Japan that con-tains exotic Permian limestone blocks suffered at most lower greenschist
facies metamorphism around 140 Ma (Isozaki et al., 1990), usually
characterized by the mineral paragenesis of pumpellyite–actinolite,
ex-cept some locally baked domains in close contact with the Cretaceous–
Paleogene granitic intrusions. Although the Kamura area in central Kyu-shu is located near an active volcanic region, there are ample indications
from the local geology that these rocks were never affected significantly
by thermochemical alteration. The studied interval straddles the
Middle–Late Permian boundary (Isozaki and Ota, 2001; Ota and
Isozaki, 2006) and thus records the end-Guadalupian mass extinction
event (Jin et al., 1994; Stanley and Yang, 1994) and possibly the top of
the Kiaman Reversed Superchron, known as the‘Illawarra Reversal’
(Cottrell et al., 2008; Courtillot and Olson, 2007; Gialanella et al., 1997; Gradstein et al., 2012; Irving, 1964; Isozaki, 2009; Opdyke et al.,
2000), offering the possibility of enhancing the correlation between
the two time scales. In particular, thefirst appearance of a solid Normal
interval is critical in identifying the Illawarra Reversal that is expected within Wordian (Middle Guadalupian) time.
Application of these new techniques to the Kamura limestone reveals the presence of a stable, 2-polarity characteristic NRM that is broadly consistent with past studies of the geomagnetic polarity chronology for late Permian Time, including the top of the Kiaman Superchron. The characteristic direction, and the match to the reversal chronology, indi-cates that the Kamura atoll was located at about 12° South latitude in the Panthalassic Ocean. A minimum of 3000 km of N/NW transport would have been required for it to dock against the Eastern margin
of Pangea during Jurassic time. The present result also has profound im-plications to the bio- and chemostratigraphic correlation between the mid-superoceanic paleo-atoll limestone and continental shelf carbonates around Pangea.
2. Geological setting
2.1. Tectono-sedimentary background
The Permian and Triassic limestone at Kamura (Takachiho town,
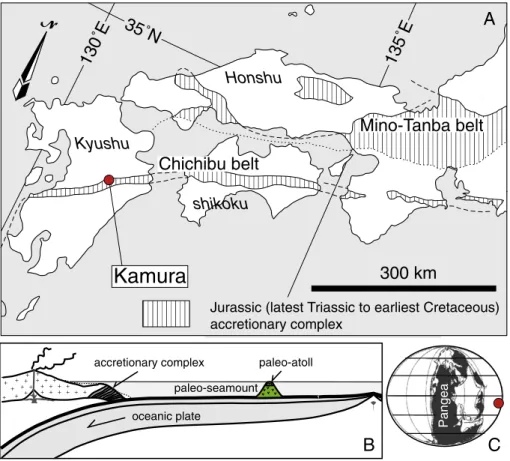
Miyazaki prefecture;Fig. 1) in Kyushu forms a part of an ancient
mid-oceanic atoll complex primarily developed on a mid-mid-oceanic
paleo-seamount (Isozaki, 2014; Isozaki and Ota, 2001; Kasuya et al., 2012;
Ota and Isozaki, 2006; Sano and Nakashima, 1997). This limestone oc-curs as a several kilometer-long, lensoid allochthonous block within
the Middle–Upper Jurassic disorganized mudstone/sandstone of the
Jurassic accretionary complex in the Chichibu belt, southwest Japan,
with remarkably little internal deformation (Fig. 2). The orientation of
the late Paleozoic to early Mesozoic subduction zone beneath the
Asian blocks (Isozaki, 1997a,b) implies that the seamount originated
to the east (Pacific side) with respect to Asia, i.e., somewhere in
the superocean Panthalassa, and accreted to the Asian margin in the Jurassic, approximately 100 million years later. The limestone blocks in the Kamura area retain parts of the primary mid-oceanic stratigraphy (ca. 135 m in thickness), and range from Wordian (middle Guadalupian) to Norian (Upper Triassic) time with several sedimentary breaks in the
Triassic part (Isozaki, 2014; Kambe, 1963; Kanmera and Nakazawa,
1973; Kasuya et al., 2012; Koike, 1996; Ota and Isozaki, 2006). 2.2. Lithostratigraphy and paleoenvironments
The Iwato Formation consists of ca. 100 m-thick, dark gray to black bioclastic limestone. Bioclasts include fragments of bivalves, calcareous algae, crinoids, fusulines and other small foraminifera, indicating Guadalupian age. The lower part of the Iwato Formation comprises wackestone with a black, organic-rich matrix and yields abundant large bivalves (Family Alatoconchidae) and large-tested fusulines (e.g., Neoschwagerina, Yabeina, Lepidolina). The upper part comprises peloidal wackestone. Black organic matter probably of microbial origin is concentrated in peloids. Megafossils are absent in this interval, except for very rare rugose coral (Liangshanophyllum) from the uppermost part. All black limestones are free from dolomitization.
The overlying Mitai Formation consists of nearly 40 m-thick, light gray bioclastic dolomitic limestone. Bioclasts are derived from calcareous algae, crinoids, ostracodes, gastropods, bivalves, crinoids, brachiopods,
coral, fusulines and small foraminifera of the Tethyan affinity, and
indi-cate Lopingian age. The limestones are mostly grainstone/wackestone
with lesser amounts of lime–mudstone that are fossiliferous, mostly
massive, partly including 1 cm-thick, continuous to discontinuous bands with concentrations of peloids and algae. Crystals of secondary do-lomite are generally concentrated around bioclasts (and avoided in the paleomagnetic sampling). The lowermost 1 m-thick bed is characterized by white bands containing abundant dolomitized dasycladacean algae.
All the Tethyan fusuline assemblages and associated fossils from the Iwato and Mitai formations indicate that the seamount was located in a low-latitude domain in the superocean Panthalassa under a tropical
climate (Isozaki, 2006, 2014; Isozaki and Aljinovic, 2009; Kasuya et al.,
2012).
2.3. Bio- and chemostratigraphy
Conodonts, the index fossils with the highest resolution for the Permian, have unfortunately not been found in the Permian Iwato and Mitai formations where our paleomagnetic samples come from, as the sedimentary facies was too shallow to host conodont animals. Fusulines are the most abundant among fossils, and they provide a basis for
Pangea
Kamura
A
B
C
Mino-Tanba belt
Chichibu belt
130˚E
35˚N
135˚E
Jurassic (latest Triassic to earliest Cretaceous)
accretionary complex
300 km
Kyushu
shikoku
Honshu
paleo-atoll paleo-seamount accretionary complex oceanic plateFig. 1. (A) Index map of southwest Japan, showing the distribution of the Jurassic accretionary complex with accreted paleo-atoll limestones of the Chichibu belt, extending from central Kyushu, onto Shikoku and western Honshu. (B) A simplified cartoon of the paleo-ridge-arc transect interpreted to have been operating from Late Permian through mid-Jurassic time. (C) Paleogeography of the Permian world with the probable location of the Kamura seamount (filled circle). Adapted fromKasuya et al. (2012).
Sec. 8
KAM Sec. 1Sec. 3
SARAWSec. 2
SARA Sec. 4 Sec. 5Sec. 6
SHIO-SSec. 7
Sec. 9
SHIO-WSec. 10
HJPM Sec. 11 Sec. 12 Shioinouso Koseri Saraito 32°45′N 131°20′E 131°21′EMitai Formation (Lopingian) Iwato Fomation (Guadalupian) Kamura Formation (Triassic)
Sections Sampled for
Paleomagnetics
500 m 0
Fig. 2. Geological sketch map of the Kamura area in central Kyushu, showing the sections analyzed for paleomagnetics and the distribution of the Permo–Triassic paleo-atoll limestone sections. Thisfigure is adapted fromKasuya et al. (2012). Beds within the exposure are nearly vertical to slightly overturned, striking generally ENE/WSW, and younging to the North.
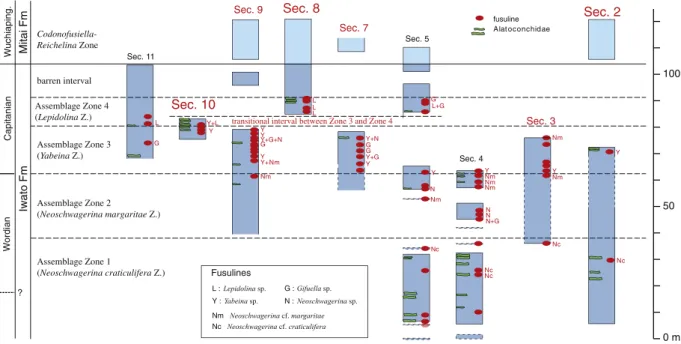
subdividing the Iwato Formation into the following 5 biostratigraphic units; i.e., the Neoschwagerina craticulifera Zone, Neoschwagerina margaritae Zone, Yabeina Zone, Lepidolina Zone, and a barren interval,
in ascending order (Kasuya et al., 2012; Ota and Isozaki, 2006).
Strati-graphic positions of the zone boundaries are constrained by fossil occur-rence to be better than 1 m, except for the N. craticulifera/N. margaritae, boundary which is estimated to be ~±5 m. The N. craticulifera Zone and N. margaritae Zone are correlated with the Wordian of Texas and with the Murgabian and lower Midian in Transcaucasia, whereas the Yabeina Zone and Lepidolina Zone, and most of the barren interval are correlated with the Capitanian (Upper Guadalupian) of Texas and with the
mid-dle–upper Midian in Transcaucasia (e.g., (Wardlaw et al., 2004)). The
carbon isotope stratigraphy of the Lepidolina Zone and barren interval (Isozaki, 1997a,b) documented the occurrence of high positive plateau
inδ13C
carbvalues (N5‰) that can be correlated with the Capitanian
rocks in North America and the European Tethys (e.g. (Isozaki et al.,
2011)). In addition, the uniquely low Sr/Sr ratios (b0.7070) detected
in the same interval also support the age assignment of the Capitanian (Kani et al., 2008; Kani et al., 2013).
The overlying Mitai Formation belongs to the Codonofusiella–
Reichelina Zone that corresponds to the Wuchiapingian (Lower Lopingian) in South China. The carbon isotope stratigraphy also
confirmed that the gradual positive excursion in the lowermost
Codonofusiella–Reichelina Zone (Isozaki et al., 2007b) corresponds
to the same signal detected in the Clarkina dukoensis Zone (lower Wuchiapingian) at Penglaitan, the GSSP (Global Stratotype Section and
Point) of G–L boundary in South China (Chen et al., 2011; Wang et al.,
2004).
2.4. Geochemistry
In terms of total organic content (TOC), the black limestone of the Iwato Formation varies between 0.13 and 0.77 wt.%, whereas the light gray dolomitic limestone of the Mitai Formation varies from 0.0044 to
0.0067 wt.% (Isozaki et al., 2007b), values which are typical of oceanic
atoll environments. However, the carbonates in the Wordian to lower Capitanian interval at Kamura record a major excursion in the value
ofδ13C
carb, increasing from a stable value of ~+ 4.5‰ and reaching a
maximum of ~+7.0‰ within the Yabeina Zone (fusuline) of the early–
middle Capitanian. Thus the total duration of the Kamura event is
esti-mated ca. 3–4 million years, occupying the majority of Capitanian
time (Isozaki et al., 2007a).
In addition to the positive excursion in carbon isotopes, the Kamura limestones also preserve a record of the Paleozoic minimum in marine
87
Sr/86Sr ratio, which reaches its nadir (0.706914 ± 0.000012) in late
Capitanian time, essentially coincident with the Kamura isotope
excur-sion (Kani et al., 2008).
2.5. Constraints on burial metamorphism
Although the Kamura limestone unit we have studied is a coherent block that crops out over a large area (~10 km long, ~150 meter thick, with bedding nearly vertical, and remarkably similar structural atti-tudes), it occurs as large exotic blocks within the younger Jurassic sand-stone/mudstone along the length of the accretionary complex shown in
Fig. 1(Ota and Isozaki, 2006). It has long been known that limestone ‘knockers’ scraped off of subducting slabs often escape significant burial
metamorphism under these conditions, as exemplified by the classic
paleomagnetic study of the Laytonville Limestone in the Franciscan
complex of central California (Alvarez et al., 1980). The sequence in
Kyushu, however, has been intruded subsequently by felsic intrusions
of arc affinity, and is in the vicinity of Mt. Aso, a major modern eruptive
center on the island of Kyushu that is capable of producing local and/or regional thermochemical alteration. Paleomagnetic studies of Mesozoic rocks in both Kyushu and central Honshu sometimes show a complex pattern of remagnetization, indicating both thermal and chemical
events have operated in some areas (Abrajevitch et al., 2011;
Abrajevitch and Kodama, 2009; Ando et al., 2001; Kodama and Takeda, 2002; Oda and Suzuki, 2000; Shibuya and Sasajima, 1986; Uno et al., 2012).
Despite this, three observations suggest that the rocks that we are studying have not been altered to levels capable of erasing completely their initial remanent magnetizations. First, the shells of the giant bi-valves appear remarkably pristine. They are built with a typical mollus-can double-layered structure, where the external layer is composed of parallel-aligned prismatic calcite with c-axis perpendicular to the shell
surface, whereas the inner layer is a micro-crystalline mosaic (Isozaki,
2006; Isozaki and Aljinovic, 2009). This textural difference argues against thermochemical alteration high enough to trigger the pervasive recrystallization of the carbonate, and certainly well below any carbon-ate decomposition temperature.
Second, conodonts in the overlying Triassic portions of the block are often preserved with Conodont Alteration Indices (CAI) as low as 2 on
the scale ofEpstein et al. (1977), implying only mild heating (60°–
140 °C) on geological time scales, but peak heating of up to ~ 500 °C on the time scale of less than an hour (which is implausible in the
geological setting of these rocks), (Ripperdan, 1990). Hence, a blanket,
regional heating capable of complete remagnetization of the sediments can be ruled out, particularly as the most likely magnetic carriers (magnetite and hematite) are stable to much higher temperatures.
Unfortunately, conodonts have not been found in the Permian por-tion of the limestone in Kamura where our paleomagnetic samples
come from, so their CAI values cannot be used to test for more signi
fi-cant thermochemical alteration from local intrusions or volcanic vents.
However,field observations of localities where intrusions do impinge
on the limestone reveal intense and visually obvious bleaching of the rock as the kerogens are destroyed. Our paleomagnetic sampling has avoided these areas. Further constraints from clumped isotope analyses
are presented inSection 5.3below.
3. Studied sections and rock samples
We studied 3 major sections in the Kamura area; i.e., Sections 2, 8, and 10 (Figs. 2, 3) with additional samples from 3 other sections (Section 4, 7,
and 9; seeKausya et al. (2012)for details). Section 2, which crops out
at the southeast of Saraito village (32° 45′12″ N, 131° 20′55″ E), contains
57 m of black limestone that belongs to the N. craticulifera Zone (Isozaki,
2006; Isozaki et al., 2007a; Kambe, 1963). Owing to the outcrop condi-tion, we only sampled from the lower half of the section. Section 8 at
the west of Shioinouso village (32° 44′58″ N, 131° 20′02″ E) contains
35 m of similar limestone that contains the upper Iwato Formation
and the lower Mitai Formation, and spans the Guadalupian–Lopingian
boundary (G–LB) as originally described byOta and Isozaki (2006).
We collected samples from the Capitanian Lepidolina Zone, overlying
barren interval, and the Wuchiapingian Codonofusiella–Reichelina Zone.
Section 10 at Hijirikawa consists of 9 m of thick black limestone of the
Iwato Formation that belongs to the Yabeina Zone (Isozaki et al.,
2007b). We collected samples from the entire section. As to the other 3 sections, Section 4 belongs to the Neoschwagerina margaritae Zone,
whereas Sections 7 and 9 belong to the Yabeina Zone (Kasuya et al.,
2012). Although there is no single continuous section that covers the
en-tire Guadalupian stratigraphy in this area, we managed to collect samples from all fusuline zones ranging from the Wordian to Wuchiapingian, and in particular, at the continuous Section 8 that preserves a 35 m-thick
limestone across the G–LB.
For the magnetostratigraphic study, we collected a total of 117
oriented core samples (2.5 cm diameter cylinders) offine-grained
lime-stone (lime mudlime-stone composed of pure carbonates with scarce terrig-enous components) from the above-described 3 sections in the Kamura area (Sections 2, 8 and 10), using standard magnetic and solar compass techniques. In addition, eleven hand samples from Sections 4, 7 and 9, in
custom magnetic and sun-compass system and removed for sample preparation in the laboratory. Forty additional block samples for inten-sive rock magnetic investigation were collected from Section 8 in the Capitanian and Wuchiapingian parts.
4. Materials & methods
4.1. Samples for paleomagnetic measurements
In the laboratory, the core samples were trimmed into as many 1-cm
highflat-ended discs as possible using non-magnetic saw blades,
and the innermost specimens from each core (furthest from surface weathering) were selected for initial measurement processes. Similar cores were drilled from the eleven oriented hand samples using a drill press setup, with between 1 and 3 cores per sample, and were reoriented and labeled using standard techniques. Oriented end chips from a representative batch of the cores from each locality were set aside for intensive rock magnetic analyses.
Due to the extremely weak magnetizations reported for these rocks byYokoyama et al. (2007), we adopted moderately stringent clean-lab handling processes to minimize the possibility of stray ferromagnetic materials becoming attached to the rock surfaces during the measure-ment and demagnetization procedures. First, after cutting and trimming the samples with the diamond-impregnated drills and saw blades, and
enhancing thefiducial orientation line with a diamond scribe, they
were dipped vigorously but briefly (for less than 1 s) in concentrated,
reagent-grade (12 N) HCl using plastic tongs, and then rinsed quickly in a large volume of deionized, fresh water. This acid treatment caused an immediate reaction with the surface carbonate on the samples, noticeably darkened the rock surface, and often left an oily, black
residuefloating on the surface of the cleaning liquids. Care had to be
taken not to lose either thefiducial marks or the sample identification
labels during this process. Next, specimens were labeled with a non-magnetic white, thermally-resistant ink, and were moved into the
magnetically-shielded environment (b200 nT) surrounding the SQUID
magnetometer work area for at least several days prior to measurement. The specimens, and all surfaces that touched them, were dusted off with
high-pressure air that was passed through a 0.2 micron particulatefilter
prior to every measurement. We used disposable dust-free plastic
gloves for handling all of the samples once the demagnetization proce-dures were started.
4.2. Paleomagnetism
All remanence measurements for this study were conducted on
the Eugene M. Shoemaker Memorial Magnetometer, which is a 2G™
Enterprises model 755 superconducting rock magnetometer with 3-axis DC SQUIDS housed in a double-layer, mu-metal shielded room at Caltech. Sham measurements of the baseline noise on the system (run with everything operating except the quartz-glass vacuum sample holder) yield a repeatable threshold moment sensitivity of a few by
10−10emu (~10−13Am2). Inclusion of the quartz-glass sample tubes
(19 mm diameter with 1 mm thick walls) usually raised the baseline holder moment up by a factor of 10 to 100 above this, which is far too high for successfully measuring the set of Kamura limestone samples we were investigating. To knock down the moment of the sample
holders, wefirst washed the tubes thoroughly with laboratory glass
cleaners, and then soaked one end in reagent-grade, 12 N HCl for several days to dissolve any ferric contaminants on and/or within the glass that could be reached by the acid. For about a quarter of the glass tubes, this treatment resulted in holder moments below about
10−9emu (10−12Am2= 1 pAm2). On occasion they could become
magnetically‘invisible’, consistently reaching down to the background
noise level of the DC SQUID sensors. In addition, we implemented a routine in the RAPID software that allows the empty sample holder to
be cleaned with maximum strength alternating-field (AF)
demagneti-zation after every set of nine measurements.
To place this in context, we note that our standard specimen size (cylinders ~ 2.54 cm in diameter, by ~ 1 cm high) is about 40% smaller than the standard sample size traditionally used in most paleomagnetic
laboratories (e.g., (Butler, 1992)). We did this because the smaller
specimen volume allows twice as many samples to be put into the magnetically-shielded furnaces for thermal demagnetization (up to ~ 80 specimens per load), doubling the measurement rate. It also re-duced the problem of jamming on early versions of the automatic
sam-ple changer used by the RAPID consortium (Kirschvink et al., 2008).
Note that we prefer to discuss sensitivity in terms of magnetic moment, rather than magnetization (moment per volume), simply because the
0 m 100 50 Assemblage Zone 1 (Neoschwagerina craticulifera Z.) Assemblage Zone 2 (Neoschwagerina margaritae Z.) Assemblage Zone 3 (Yabeina Z.) Assemblage Zone 4 (Lepidolina Z.) barren interval Codonofusiella-Reichelina Zone Capitanian W uchiaping. W ordian ?
transitional interval between Zone 3 and Zone 4
Nc Nm Nm N+G Y Nc L L L Y+L Y L G Y Y+G G G Y+N Nc Y Y+Nm Nm Nm Nm G Y Y G Y+G+N L+G Y Nm N Nc Nm Y N N Y Nc Nm mar Nc Y : G : L : Iwato Fm Mitai Fm fusuline Alat oconchidae
Sec. 2
Sec. 11Sec. 10
Sec. 8
Sec. 7 Sec. 5 Sec. 4 Sec. 3 Fusulines Sec. 9 N :Fig. 3. Biostratigraphic correlation based on Fusuline zones for the localities sampled in the Kamura area. The section numbers correspond to those shown inFig. 2. Assemblage zones 1–4 correspond to the standard Tethyan nomenclature.
raw data from the 2G™ magnetometers are, by the physics of their op-erating principles, sensitive to the total magnetic moment of a speci-men. SQUID magnetometers monitor the differential change in electric
currentflowing in a pair of Helmholtz-geometry superconducting
pick-up rings, and that is directly proportional to the total magneticflux
change across the loops, which is in turn proportional to the magnetic moment of a sample inserted into the center of the sense region (Fuller et al., 1985). The shape of the sample is simply not important
(flat discs, cubes, or irregular objects are all OK), as long as the material
being measured is brought within the uniform region of the sensor (Kirschvink, 1992). This is different from older methods of
measure-ments such as the astatic, induction-spinning, andfluxgate-ring sensors
where the shape of individual samples was critically important. Com-paring the specimen moment to that of the sample holder is also confus-ing if one is measured in terms of magnetization, rather than in units of moment.
After initial measurement of the natural remanent magnetizations (NRMs), samples were subjected to two or more low-temperature ther-mal cycles in liquid nitrogen to help remove any viscous components that might have been carried by multi-domain magnetite. This was followed by a series of low-intensity progressive 3-axis alternating-field (AF) demagnetization experiments evenly spaced up to about 7 mT, again to help remove any soft magnetic components that might
have been acquired by exposure to moderate magneticfields from
Airport X-ray machines or during the sample preparation. This was
followed by progressive thermal demagnetization under a gentleflow
of N2gas in a magnetically-shielded oven (b25 nT residual field),
starting at 75 °C and incrementing in steps ranging from 10 to 25 °C, until the magnetization vectors were too weak to measure or the spec-imens displayed unstable behavior. We have found that heating in the
N2gas helps reduce the oxidation of ferrimagnetic minerals, reducing
the problem of the acquisition of spurious components upon
mid-level heating steps. If thefirst specimen from a core displayed erratic
or unstable behavior before isolating or revealing the characteristic component, an additional specimen from the sample was run through a similar demagnetization series. To check for chemical changes during thermal demagnetization, we measured the bulk susceptibility after
each demagnetization step for each sample using a Bartington™ MS-2
susceptibility bridge that was built into the sample changing system
as described elsewhere (Kirschvink et al., 2008). Between 15 and 30
discrete demagnetization experiments were performed per specimen (average 24), on over 320 specimens, for an overall data set of over 7800 complete measurements of NRM. Principle magnetic components
were determined using the techniques ofKirschvink (1980), with the
parameter for the Maximum Angular Deviation (MAD) set at 15°. Due to the weak nature of the NRMs, components that were trending toward
the origin, or formed‘stable endpoint clusters’ before the onset of
unsta-ble behavior, werefit by forcing the least-squares line through the
ori-gin (anchoring). 4.3. Rock magnetism
As the Kamura limestone possesses an unusually weak, but stable, NRM, we conducted a series of rock magnetic investigations to unravel the nature of the magnetic phases present. At the KAM locality, speci-mens cut from the 40 block samples in the Kobe University collection from across the G/L boundary were subjected to isothermal remanence (IRM) acquisition experiments to access for the presence of ferromag-netic and antiferromagferromag-netic mineral phases. For a sub-set of these
specimens we followed the general procedure ofLowrie (1990)for
identifying the magnetic minerals present based on the distinctive coer-civity and blocking temperature characteristics of hematite, magnetite, and phyrrhotite, respectively. Hematite has both the highest Néel
temperature (670°) and coercivity (N1 T) of these minerals, the Néel
temperatures of the pyrrhotite mineral family are at or below ~325 °C
with intermediate coercivities between ~ 0.4 and 1 T (Dekkers, 1989),
whereas magnetite has a Néel temperature of 580 °C and coercivities below 0.3 T. The progressive thermal demagnetization characteristics of these components are thus diagnostic of these minerals, and can be separated by giving a set of orthogonal isothermal remanent
magnetiza-tions (IRMs) of progressively lower value (Lowrie, 1990). We therefore
conducted thermal demagnetization of orthogonal IRMs given sequen-tially at 2.7 T, 400 mT, and 120 mT, at progressively higher peak temper-atures up to 680 °C.
To further characterize the NRM, a series of specimens from the same section (8) were subjected to the suite of non-destructive rock
magnetic experiments described byKirschvink et al. (2008)at Caltech,
starting with the 3-axis Alternating-field (AF) progressive
demagnetiza-tion of the NRM in peakfields up to 80 mT. This was then followed by
the anhysteretic remanent magnetization (ARM) version of the
Lowrie–Fuller test for single-domain behavior (Johnson et al., 1975),
which involved progressive acquisition of an ARM in peak alternating-fields (AF) of 100 mT, with variable DC biasing alternating-fields of 0–1 mT, follow-ed by progressive AF demagnetization of the maximum ARM. In this
test, the ARM substitutes for a weak-field TRM for single-domain
and pseudo-single-domain particles, and provides a simple method for evaluating the relative contribution of these to the less geologically stable multi-domain fraction. Samples were then given an IRM pulse
in a peakfield of 100 mT, followed by progressive AF demagnetization
experiments (providing the ARM Lowrie-fuller tests for the fraction
of the NRM with coercivities below 100 mT, e.g., (Johnson et al., 1975)).
Finally, the samples were subjected to progressive IRM acquisition exper-iments up to 350 mT, again followed by progressive AF demagnetization. 4.4. Clumped isotopes
Carbonate clumped isotope thermometry (Δ47) is based on the
temperature-dependent preference of rare isotopes13C and18O to
bond with each other within a carbonate lattice. Due to the stronger
chemical bond energy, the fraction of CO2molecules that contain both
13
C and18O atoms decreases as the temperature of crystallization
increases; recently-developed techniques and calibration allow this ‘clumpiness’ to be measured easily. This thermometry allows determin-ing independently the temperature at which carbonate crystallized and
theδ18O of the mineralizingfluid (e.g., (Ghosh et al., 2006)), and has
mostly been used for paleoclimatological reconstructions (e.g., (Eiler,
2011; Ghosh et al., 2006) and references therein). However, when carbonates experience high temperatures from burial or contact meta-morphism, solid-state diffusion of C and O within the mineral lattice
might occur, leading to some reordering of13C–18O bonds on both the
prograde and retrograde paths during a geological heating event (Bonifacie et al., 2011; Passey and Henkes, 2012). This has been pro-posed based on studies of metamorphic marbles that generally show
apparent equilibrium temperatures of about ~190 °C (withΔ47
averag-ing 0.352‰; (Bonifacie et al., 2011; Ghosh et al., 2006)) despite peak
metamorphic temperatures far above 500 °C. This apparent
tempera-ture for marble is thought to represent the“blocking” temperature
with respect to diffusional resetting of the carbonate clumped isotope
thermometer— that is the temperature at which the isotopes stop
exchanging by solid-state diffusion during gradual cooling (Bonifacie
et al., 2011; Ghosh et al., 2006). In deeply buried carbonates this phenomenon could therefore potentially challenge, under some circumstances, the reconstruction for both the original temperature
of crystallization and theδ18
O value of the mineralizingfluid
(be-cause the original distribution of13C–18O bonds could be
progres-sively lost over heating while the oxygen isotopic composition of the carbonate could still be unaffected if dissolution/recrystallization did not happen), but it could also provide a way to reconstruct burial/
heating path conditions (e.g.Bonifacie et al., 2011; Eiler, 2011; Passey
and Henkes, 2012).
For this work, CO2was released from four samples of limestone,
Matrix, and KAM38.2 inTable 1) and one from the Wuchiapingian Mitai Fm (KAM124.2), using analytical procedures as well as standardization
and normalization procedures similar toGhosh et al. (2006)(i.e., based
on CO2gases equilibrated at 1000 °C and one carbonate marble
refer-ence material). Purified CO2was then analyzed at Caltech for its stable
isotopic compositions (δ18O,δ13C andΔ
47) on a Finnigan MAT 253 gas
source mass spectrometer, configured to collect masses 44 through 49.
Measured values ofΔ47(reported in‰ compared to a stochastic
distri-bution of13C–18O bonds in CO
2that have been heated at 1000 °C,
defined inGhosh et al. (2006)) were used to estimate carbonate
appar-ent temperatures, using the empirically derived polynomial determined
using high temperature experimental calcites (Guo et al., 2009),
hydro-thermal dolomite (Bonifacie et al., 2011) and inorganic synthetic
cal-cites (Ghosh et al., 2006) all generated into the same intra laboratory
frame than the samples investigated here. All samples were analyzed at least twice using sub-fractions of the same powder, to account for heterogeneity.
5. Results
5.1. Composite IRM analysis (Kobe University)
IRM acquisition and thermal demagnetization of composite-IRM
experiments shown in supplemental Figs. S1–S5 revealed that magnetite
exists ubiquitously through the whole sampled section in concentrations that are almost constant in both the Iwato and the Mitai Formations, except for around the G/L boundary interval. Hematite, however, only exists in the Iwato Formation as the predominant mineral (in terms of bulk volume).
The rock magnetic transition between the Iwato and the Mitai Formations does not match the lithologic boundary, as this change is lo-cated a few meters below it. The high proportion of hematite to other magnetic minerals in the Iwato Formation is correlated positively with the Kamura carbon isotope excursion in the same section. Diagenetic processes such as consumption of hematite in the Mitai Formation or formation of hematite in the Iwato Formation are unlikely to explain the predominance of hematite in the Iwato Formation because of the presence of a constant amount of magnetite in both of the Iwato and Mitai Formations. An interpretation of transport from terrestrial origin of hematite is also discarded because of lithologic features of these for-mations that argue for deposition in an isolated island atoll carbonate platform. Consequently, the rock magnetic properties of the Iwato and the Mitai Formations are most likely depositional features, and the presence of hematite associated with the positive rise in stable carbon
isotope ratios probably reflects a change in the paleoenvironment
in the superocean Panthalassa, consistent with a rise in environmental oxygen associated with increased carbon burial.
5.2. Coercivity spectral analysis (Caltech RAPID system)
Results from the coercivity analysis generally support the conclusion
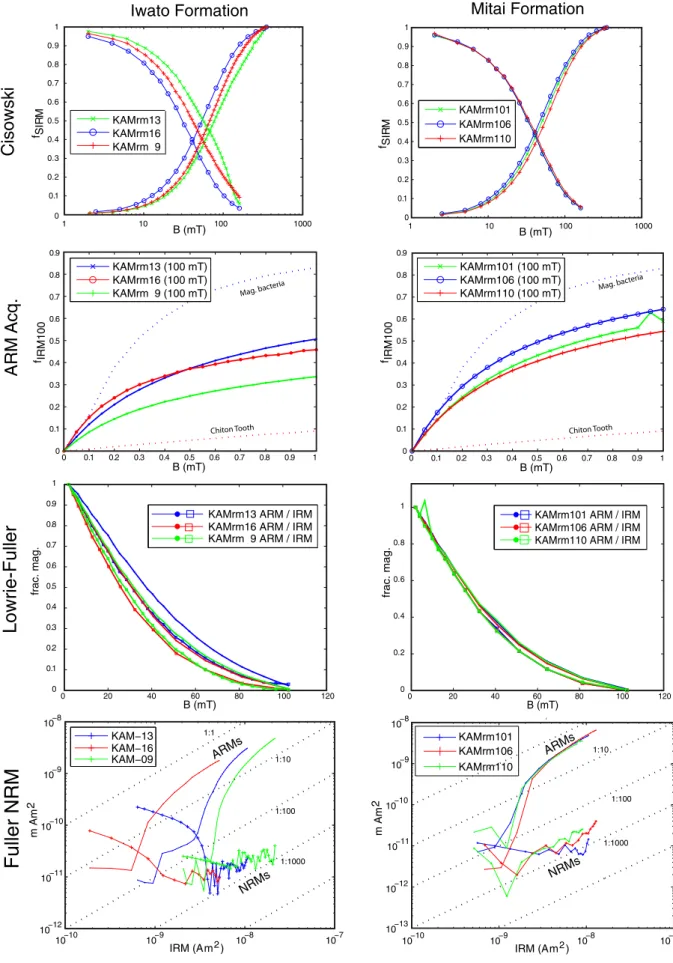
from the composite IRM analysis, as shown inFig. 4. The IRM/ARM
coer-civity spectral analysis ofCisowski (1981)(top row ofFig. 4) shows a
broad variability in the Iwato formation, with medium destructive field values spreading between 40 and 60 mT, but with some samples (e.g., KAM 9 and 13) barely starting to approach saturation at peak
pulsefields of up to 300 mT, indicating the presence of a high-coercivity
antiferromagnetic phase like hematite. All samples from the Mitai formation, however, have much more reproducible coercivity spectra,
with medium destructivefields in the 30–40 mT range, and clear
ap-proach to saturation by 300 mT suggesting a much smaller antiferro-magnetic component. The two formations also differ considerably in their interparticle interaction characteristics as determined by ARM
acquisition in the coercivity bandb100 mT (second row ofFig. 4).
Data from the Iwato formation plot halfway between the chiton tooth and magnetotactic bacterial reference curves, indicating the presence of a mixture of interacting and non-interacting particles. In contrast,
the Mitai samples follow a trajectory indicating significantly less
inter-particle interaction, much more like that of partially collapsed bacterial
magnetosomes, as calibrated byKobayashi et al. (2006). Magnetic
particles in both formations are dominated by single-domain (SD) or pseudo-single-domain states as indicated by the ARM version of the
Lowrie–Fuller test (Johnson et al., 1975) as shown in the 3rd row in
Fig. 4. On all samples, the curve for the progressive AF demagnetization of the ARM lies on top of that for the AF of the IRM, indicating domina-tion by SD particles. However, the interparticle interacdomina-tion effects (given by the relative separation between the two curves) are clearly stronger for the Iwato formation than for the Mitai, suggesting that something has acted to permit more magnetic clumping.
Fuller et al.'s (1988)test of NRM origin (bottom row inFig. 4), which compares the intensity of the NRM remaining during AF demagnetiza-tion with that of the IRM, strongly supports the interpretademagnetiza-tion that the NRM signal is a depositional or post-depositional remanent magnetiza-tion (DRM or pDRM), rather than a CRM or TRM. This is because the values are nearly 3 orders of magnitude less than the corresponding IRM levels, and nearly 2 orders below the ARM values.
A scan using the Caltech ultra-high resolution SQUID magnetic
microscope (Weiss et al., 2001) on a polished surface of a sample from
the upper portion of the Iwato Formation (KAM-109, Fig. S6) reveals that the magnetization is diffusely located through the material, rather than being localized in discrete clumps or sedimentary grains. 5.3. Clumped isotopes
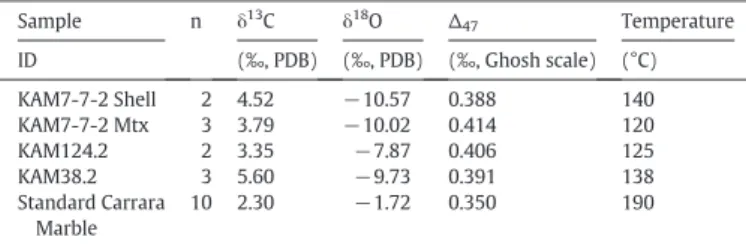
Table 1shows results from the four samples measured for this study.
Measured carbon isotope values (δ13
Ccarb) for limestone samples from
the Kamura event in Kyushu (Isozaki et al., 2007a) are typically in the
range of +3 to as high as +6‰, and oxygen (δ18O
carb) is in the range
from−11 to −8‰; the values obtained here are in reasonably good
agreement. Furthermore,Δ47values of the four investigated samples
are remarkably similar (average of 0.400‰ ± 0.012‰ standard
devia-tion) within uncertainties on replicateΔ47measurements (typically
±0.015‰ with respect to standards). When converted into
tempera-ture estimates, these results converge toward apparent metamorphic temperature of ~ 130 °C, suggesting that the actual peak temperature was probably close to this. On the other hand, it is worth noting that
at elevated temperatures and particularly where apparentΔ47values
approach those seen in marbles, it is very difficult to easily rule out
the potential contribution of solid-state diffusion that might have only partly reset bond distribution over a heating path (that would give a
lower apparent equilibrium temperature estimated based onΔ47
mea-surement than the actual peak temperature) resulting for instance from tectonics (arc timescale regional heating) or from plutonic/dike
intrusion heating. However, our measuredΔ47 values of Kamura
Table 1
Clumped isotope results from samples of the Kamura Limestone
Caption =Δ47are reported in‰ relative to the Ghosh scale, that is compared to a
stochas-tic distribution of13
C–18
O bonds in CO2that have been heated to 1000 °C (Ghosh et al.
(2006)). External precisions on replicate measurements of the same powder are typically ±0.11‰ for both δ18
O andδ13C and 0.015‰ on Δ
47measurements (representing here on
average ±13–20 °C on temperature estimates when one consider the current uncer-tainties on the equation relatingΔ47to temperatures for high temperature materials).
Sample n δ13C δ18O Δ 47 Temperature ID (‰, PDB) (‰, PDB) (‰, Ghosh scale) (°C) KAM7-7-2 Shell 2 4.52 −10.57 0.388 140 KAM7-7-2 Mtx 3 3.79 −10.02 0.414 120 KAM124.2 2 3.35 −7.87 0.406 125 KAM38.2 3 5.60 −9.73 0.391 138 Standard Carrara Marble 10 2.30 −1.72 0.350 190
0 0.1 0.2 0.3 0.4 0.5 0.6 0.7 0.8 0.9 1 KAMrm101 KAMrm106 KAMrm110 1 10 100 1000 0 0.1 0.2 0.3 0.4 0.5 0.6 0.7 0.8 0.9 1 B (mT) f SIR M KAMrm13 KAMrm16 KAMrm 9 KAMrm13 (100 mT) KAMrm16 (100 mT) KAMrm 9 (100 mT) KAMrm101 (100 mT) KAMrm106 (100 mT) KAMrm110 (100 mT) 0 0.1 0.2 0.3 0.4 0.5 0.6 0.7 0.8 0.9 f IRM100 0 0.1 0.2 0.3 0.4 0.5 0.6 0.7 0.8 0.9 f IRM100 0 0.1 0.2 0.3 0.4 0.5 0.6 0.7 0.8 0.9 1 0 20 40 60 80 100 120 0 0.1 0.2 0.3 0.4 0.5 0.6 0.7 0.8 0.9 1 B (mT) frac. mag.
KAMrm13 ARM / IRM KAMrm16 ARM / IRM KAMrm 9 ARM / IRM
0 20 40 60 80 100 120 0 0.2 0.4 0.6 0.8 1 B (mT) frac. mag.
KAMrm101 ARM / IRM KAMrm106 ARM / IRM KAMrm110 ARM / IRM
10−10 10−9 10−8 10−7 10−12 10−11 10−10 10−9 10−8 IRM (Am2) m Am 2 1:1000 1:1000 1:100 1:100 1:10 1:10 1:1 KAM−13 KAM−16 KAM−09 r −4 KAMrm101 KAMrm106 KAMrm110 1 10 100 1000 B (mT) f SIR M B (mT) 0 0.1 0.2 0.3 0.4B (mT)0.5 0.6 0.7 0.8 0.9 1 10−10 10−9 10−8 10−7 IRM (Am2) 10−12 10−11 10−10 10−9 10−8 m Am 2 10−13 ARMs ARMs NRMs NRMs
Fig. 4. Rock magnetic results from the Iwato and Mitai Formations, as described in the text. All results are consistent withfine-grained, presumably biogenic magnetite holding the characteristic remanent magnetization.
limestones are significantly higher than the minimum Δ47value of
0.350‰ observed in slowly cooled calcite marbles [corresponding to
the apparent equilibrium temperature or“blocking temperature” of
190 °C for the Carrara marble standard, shown for comparison in
Table 1]. This suggests that Kamura limestones probably never experi-enced temperatures higher than 190 °C for a long period of time (i.e.,
longer than about 10–20 Myr based on parameters defined inPassey
and Henkes (2012)), because otherwise they would showΔ47values
comparable to Cararra marble. As noted in part2.3above, petrographic
studies of the large Alatoconchidae bivalves show that their external layer retains an arguably primary prismatic calcite, with the original biological alignment of the c-axis perpendicular to the shell surface. Similar petrographic studies of the well-preserved micrites from the Kamura limestone argue that a reasonable fraction of the carbonate has not undergone obvious recrystallization. Higher temperatures ought to have led to petrographic textures and recrystallization typical of marbles, which these rocks do not show. Finally, although some cau-tion is warranted as knowledge on clumped isotopes in high temperature systems is still relatively recent, the most straightforward interpretation
of ourΔ47results that are consistent to the known geological setting, is
that the actual peak heating temperature was close to 130 °C. 5.4. Paleomagnetic results
Specimen-level progressive demagnetization data for six samples from three sections through the Kamura limestone are shown in
Figs. S7A–F. The first thing to notice is the unusually weak nature of the
NRM, with specimen magnetic moments starting in the range of ~10 to
100 pAm2(~10−8to 10−7emu, or about 2 to 20μA/m for the 5 cm3
size of our typical specimen; remember that 1 G = 1 emu/cm3=
10+3A/m). This is below holder noise on most of the superconducting
magnetometer systems in use, and a major reason that previous paleomagnetic studies of rocks with similar lithologies have failed (Ripperdan, 1990; Yokoyama et al., 2007). Putting this in perspective, they are 2 to 3 orders of magnitude weaker than the classic pelagic
lime-stones of Italy, which have NRM magnetizations of ~1 mA/m (Alvarez
and Lowrie, 1984). Nevertheless, the data are straightforward to inter-pret. Low-temperature cycling in liquid nitrogen (steps LT1 and LT2) removes up to ~ 10% of the NRM intensity, suggesting the presence of occasional grains of MD or SPD magnetite that are unlocked while
cy-cling through the Verway transition (Dunlop and Ozdemir, 1997); these
particles could be a remnant of background cosmic dust or volcanic ash in the environment that might be expected to fall into the sediment of a carbonate platform atoll. Directions for the component removed during this low-temperature cycling do not have an obvious grouping, and were presumably gained randomly during sample transport or speci-men preparation. Following this, about half of the specispeci-mens display a low-coercivity, low blocking temperature overprint with directions
similar to the Recent magneticfield direction, which is removed by
weak AF demagnetization (up to 7 mT), and/or relatively low thermal treatment (often to only 75 °C). Presumably, this is a combination of viscous remanence, coupled with the presence of trace amounts of goe-thite formed during surface weathering (which generally carries a
Re-cent or presentfield direction (PLF) which disappears as the mineral
alters at low-temperature treatment). Most specimens at this point either retain or progressively move toward more characteristic rema-nence (ChRM) directions in two shallow inclination, antipodal groups, in the NNW and SSE directions. The increased scatter in the measure-ments is a result of the weak intensity of the NRM compared to the com-bined background noise of the magnetometer and sample holders.
One problem that arises commonly in paleomagnetic studies concerns the recognition and separation of such soft (PLF) components from earli-er, characteristic (ChRM) directions. It helps if post-depositional tilting of the units (and/or polar wander) creates a clear angular separation be-tween the components, although at best the two directions can be orthog-onal. The limestone block in the accretionary complex of the Kamura
region is tilted so that the bedding is now nearly vertical, but the axis of the mean PLF component removed by the initial low demagnetization treatment only has an angular separation of about 16° from the nearest axis of the ChRM direction (that to the NNW; see below). This case is
therefore similar to that of younger,flat-lying rocks where the
distribu-tion of the two components also overlaps. We have therefore followed
the Principal Component procedure described byTobin et al. (2012), in
which wefirst examine data from samples that have the ChRM direction
furthest from the PLF direction, to gain an understanding of their relative
stability spectra. We assume that the overprint is not influenced by the
direction of the underlying ChRM direction, and therefore use that as a guide for separating them during the Principal Component Analysis. As noted by Tobin et al., the scatter of the secular variation is often
large enough so that clear‘kinks’ appear in the vector demagnetization
diagrams that allow separation of the components. This is discussed in more detail in Fig. S7.
Results of the Principal Component Analysis (PCA) on the
demagne-tization data from the Kamura limestone are shown inFig. 5andTable 2.
The soft component clusters around the expected direction for the
Re-cent geomagneticfield, as indicated inFig. 5A, and is identified as PLF
inTable 2. In contrast, those specimens that contain a component of
higher stability, the‘Characteristic Remanence’ or ChRM, fall into two
distinct clusters. After correction for the local tilt of bedding these lie to the NNW with generally shallow upward directions, and the opposite
group is to the SSE with shallow down inclination (Fig. 5B). We
empha-size that this ChRM direction is relatively weak compared to normal
pa-leomagnetic studies. Using the matrix deconvolution method ofJones
(2002), we have been able to estimate the total magnetic moment of the ChRM vector in some of our samples from the KAM locality (Section 8 inFig. 2), and plot them inFig. 5C as a function of the geometric grouping
parameter for linearity (MAD value, e.g., (Kirschvink, 1980)). Stable
directions are recoverable down to intensities of less than 10 pAm2
(10−8emu). In a similar fashion, the ChRM component data can be
ana-lyzed to yield an idea of the range of blocking temperatures that hold it by making a survivorship curve showing the last temperature step that
pro-vides a useable point for the PCA analysis. As shown inFig. 5D, these
ther-mal termination points are distributed between ~200° and 400 °C, with about 1/3 of the loss happening between 375° and 400 °C. Although well below the Néel temperatures of the two major magnetic minerals
present (magnetite and hematite, seeSection 5.1above), blocking
tem-peratures are particle-size dependent and often fall in this range in natu-ral samples (such as bacterial magnetofossils.) This stability range is also
compatible with the preservation of a primary remanence for
fine-grained magnetite on geological time scales (Pullaiah et al., 1975).
Table 2shows summary statistics of the PLF and ChRM components, the latter being given in coordinates of both in-situ and after correction for the local tilt of bedding, following the combined line and plane
anal-ysis ofMcFadden and McElhinny (1988). Directions are also presented
separating out samples according to polarity, as well as a grouping in which only data from specimens that yielded the least-squares lines are analyzed. Table S1 shows results of directional statistics tests.
Watson's (1956)test of common Fisher's precision parameter (κ) indi-cates that the distributions are similar in both the NOR and REV cases,
with or without the inclusion of demagnetization arcs, and that theκ
value for the PLF component is also similar to those for the ChRM. In ei-ther grouping (all data, or only demagnetization lines), the ChRM data
show a positive“Category B” reversals test, using the classification of
McFadden & McEllhinny (McFadden and McElhinny, 1990). In
particu-lar, the angular separation of the two antipolar groups using all of the
data is only 1.0°, whereas the critical angle for 95% confidence is 6.5°.
Similarly, the axis of the PLF component, which lies 16.0° from the ChRM axis, is statistically distinct from this at an extraordinarily high
confidence level. These data imply that the Kamura Limestone Atoll
formed at a paleolatitude of ~12°, and the pole position is far from any
other reported direction from the South China Block (e.g., (Wang
5.5. Magnetostratigraphy
Fig. 6shows a summary comparison of the magnetic polarity results for the Kamura limestones, as documented further in Supplemental
Figs. S7–9, and in the archived paleomagnetic data summary (MagIC
data acquisition # XXXXX). The stratigraphically oldest interval,
ex-posed inSection 2(Saraito) starts in the N. craticulifera Zone (lower
Wordian), and has a prominent switch in magnetic polarity between
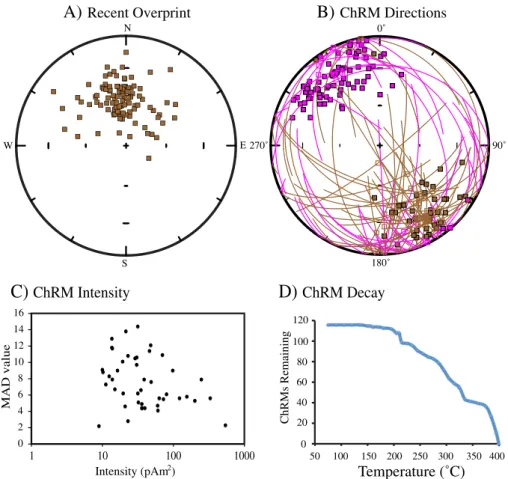
0˚ 90˚ 180˚ 270˚ N E S W
A)
Recent Overprint
C)
ChRM Intensity
0 2 4 6 8 10 12 14 16 1 10 100 1000 MAD value Intensity (pAm )2B)
ChRM Directions
50 100 150 200 250 300 350 400Temperature (˚C)
120 100 80 60 40 20 0 ChRMs RemainingD)
ChRM Decay
Fig. 5. Results of the Principal Component Analysis. A. Low-coercivity and low-T components interpreted to be of Recent origin (PLF component, in-situ.). B. Two-polarity characteristic direction, NOR and REV, tilt-corrected coordinates. Arc-constraints for samples that do not reach the stable endpoints are calculated with the method ofMcFadden and McElhinny (1988), and are shown with the open symbols on the arc traces. Pink symbols indicate upper hemisphere directions. C. A summary of the maximum angular deviation from the principal component analysis plotted against intensity of thefit principal component directions using the matrix deconvolution (J/Jo routine) ofJones (2002), described further inKirschvink et al. (2008). D. Survivorship curve, showing the maximum temperature recorded for the ChRM component in each specimen as a function of temperature.
Table 2
Paleomagnetic results from Upper Permian Limestones from Kyushu reported in this study.
L = lines; P = planes; N = number of samples; Dec. = declination; Inc. = inclination;κ = Fisher's precision parameter; α9 = 95% confidence cone; VGP lat. = virtual geomagnetic pole latitude; VGP lon. = VGP longitude. *Values in these rows have been corrected for the tilt of bedding.
Thefield area in Kyushu, Japan is located approximately at 32.8° N, 131.3° E.
Components: N Dec. Inc. κ R α95
PLF 105 354.1 55.5 15.20 98.2 3.7 ChRMs Normal lines 76 319.4 69.1 11.12 69.3 5.1 * 327.0 −24.4 12.86 70.2 4.7 Reversed lines 43 152.8 −62.5 15.12 40.2 5.8 * 144.0 22.7 14.83 40.2 5.9 Normal L + arcs 84 321.4 69.5 11.48 76.8 4.8 * 327.9 −23.6 13.27 77.7 4.4 Reversed L + arcs 65.5 158.3 −61.7 14.89 61.2 4.7 * 147.0 23.1 14.81 61.1 4.7 All (N + R) lines 119 145.1 −66.8 12.03 109.2 3.9 * 325.9 −23.8 13.56 110.3 3.7 Best estimate of ChRM:
(N + R) lines & arcs 149.5 149.6 −66.6 12.33 137.5 3.4
* 327.5 −23.4 13.99 138.9 3.2
Pole position:
Pole latitude: 35.3° A95: 2.5° Pole longitude: 351.4° dp, dm: 1.8°,3.5°
~10 and 12 m in the section. This is approximately the position inferred
for the top of the Permian Long Reversed Chron, known as the“Illawara”
reversal at the top of the Kiaman Reversed Interval (e.g., (Steiner,
2006)). This implies that the North-Westerly and shallow-up polarity
of the ChRM directions are of Normal polarity, and the South-Easterly and shallow down directions are Reversed.
Using this polarity interpretation, the Wordian (N. craticulifera and
N. margaritae Zones) sampled atSection 2(Fig. S9) is characterized
by a clear reversed interval in the bottom 11 m of section, followed by an interval where 7 of the next 10 samples appear to be of normal polarity (unfortunately separated by a 15 m thick covered interval). The Capitanian Yabeina and Lepidolina zones are characterized by solid normal interval that is easily correlated with that reported from the
Capitanian from the rest of the world (Gradstein et al., 2012; Steiner,
2006). On the other hand, the barren interval of the topmost Capitanian
is dominated by a reverse interval. This interval is possibly correlated with the reverse interval recognized in the upper Capitanian J. granti
Zone in South China (Shen et al., 2010).
This interpretation is consistent with the remaining portions of the
stratigraphy, in which the top ofSection 2lies in the N. margaritae
Zone (upper Wordian), and should be N/R. Section 10 in the upper Yabeina Zone (lower Capitanian) has a R/N transition, with the N extend-ing into the lower Lepidolina Zone. This switches to dominantly R
through the basal portion of the‘barren’ interval in section 8 (uppermost
Capitanian) and extends well into Lopingian time (Codonofusiella–
Reichelina Zone of the Wuchiapingian). Smaller stratigraphic intervals of Sections 2, 3, 6, and 9 are consistent with this interpretation, as shown inFig. 6.
This polarity interpretation constrains the paleolatitude of the
Permian Iwato and Mitai Limestone at Kamura to be at−12.2 ± 1.8°
South, as indicated inTable 2.
6. Discussion
6.1. Stability and origin of the NRM
Although they possess an unusually weak magnetization, several lines of evidence support the hypothesis that samples of the late Permian limestone from the Kamura area possess a primary remanent magneti-zation. Unrecrystallized calcite in the molluscan shell nacre and the clumped isotope results are most consistent with peak temperatures below ~ 130 °C. In addition, the positive reversals test on the ChRM component, its thermal stability spectrum, and the generally good agreement of the reversal stratigraphy with other late Permian results argue for a primary, or early diagenetic origin of this component,
most likely held infine-grained magnetite. Coupled with the excellent
biostratrigraphic and chemostratigraphic constraints on the sequence, the paleomagnetic pole position calculated from this sequence scores
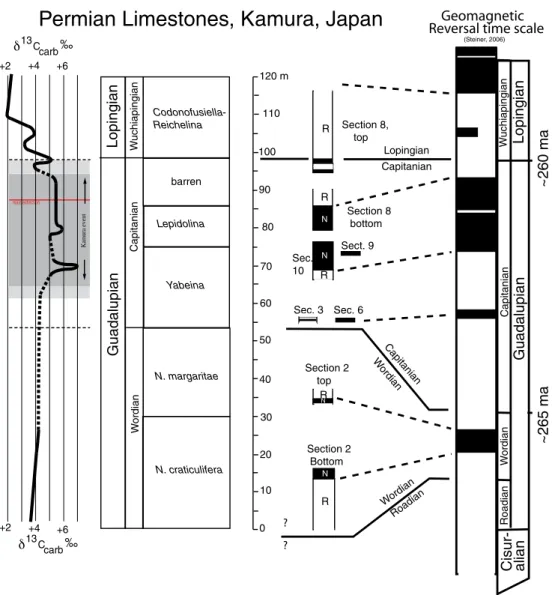
100 90 80 70 60 50 40 30 20 10 0 120 m 110 N. craticulifera N. margaritae Yabeina Lepidolina barren Codonofusiella-Reichelina Lopingian
L
opingian
L
opingian
Guadalupian
Guadalupian
~265 ma
~260 ma
Cisur
-alian
C apitanian Capitanian Capitanian C apitanian W uchiapingian W uchiapingian Wo rd ia n Wo rdia n Wor dian Wo rd ia n Roadian Roadian Sec. 10 Section 8, top Section 8 bottom Sec. 6 Sec. 3 Section 2 Bottom Section 2 top R R N N N N R R Sect. 9 N RPermian Limestones, Kamura, Japan
(Steiner, 2006) main extinction Kamura event +2 +4 +6 Ccarb 13 ‰ +2 +4 +6 Ccarb 13 ‰
Fig. 6. Magnetostratigraphy of the Permian Limestones of Kamura, Kyushu, Japan, compared with biostratigraphic and carbon isotope constraints. Data for the major sections are in the supplemental information, Figs. S8–10. Note that the summary ignores occasional one-point samples with opposite polarity. Data for the Kamura carbon isotope anomaly are from (Isozaki, 1997a,b).
a perfect 7/7 on the Vandervoo (Vandervoo, 1990) scale of paleomag-netic reliability.
Other than a light scattering of cosmogenic or volcanic dust, most of the magnetization appears to be held in moderately interacting, very fine-grained, single-domain or pseudo-single-domain magnetite. The most likely origin of this material is production by the magnetotactic bacteria, as they are known to inhabit similar carbonate-rich
environ-ments (Chang and Kirschvink, 1989; Chang et al., 1987; Kirschvink
and Chang, 1984; Kirschvink and Lowenstam, 1979; Kopp and Kirschvink, 2008; Maloof et al., 2007) and have similar rock magnetic
properties, including the inter-grain interaction effects (Kobayashi
et al., 2006). They have also been implicated in the magnetization of
platform carbonates from younger ocean island atolls (e.g., (Aissaoui
and Kirschvink, 1991; Aissaoui et al., 1990)), as well as in a variety of
pelagic marine carbonates (Roberts et al., 2013).
An interesting twist on this result is the rock magnetic evidence from
the composite IRM experiments (Figs. S1–5) for the presence of a
signif-icant fraction of detrital hematite in sediments of the Iwato formation
mentioned inSection 5.1above. This unit preserves significantly less
organic matter than the underlying Mitai formation, and the association
of the hematite with the positive excursion ofδ13C
carbargues for a
mechanistic link. We suggest that the spike inδ13
Ccarbactually reflects
an increase in the fraction of volcanic carbon (emitted as CO2) being
buried as organic carbon, with an implied 1–1 rise in atmospheric
oxy-gen concentration. For shallow-water carbonates, an increased oxyoxy-gen level would account for the more oxidized character of these sediments
6.2. Middle–Upper Permian magnetostratigraphy and bio- and
chemostratigraphic correlation
Our data reveal multiple geomagnetic polarity changes within the Guadalupian Iwato Formation primarily from low-latitude
mid-Panthalassa. As summarized inFig. 6, the lower half (Wordian part) of
the Iwato Formation is dominated by reversely magnetized intervals, whereas the upper half (Capitanian part) by normal ones. In contrast,
the lower part of the overlying Mitai Formation above the G–LB recorded
a stable reversed interval. This overall aspect is in general agreement with
previous compilations of Permian magnetostratigraphy (e.g., (Gradstein
et al., 2012; Steiner, 2006)).
It is particularly noteworthy that a short normal interval appears
around the G–LB (Fig. 6). This signal is possibly correlated with the
magnetostratigraphic record from South China that is characterized by a short-term normal interval for the Clarkina postbitteri honshuiensis
Zone that defines the topmost Capitanian at the GSSP of G–LB in South
China (Shen et al., 2010). This correlation is supported by the stable
carbon isotope stratigraphy, because a sharp negative shift for ca. 3‰
(from + 5 to + 2‰) was reported from the upper part of the barren
interval (Isozaki et al., 2007b). This shift is chemostratigraphically
corre-lated with the same signature in the C. postbitteri honshuiensis Zone and
C. postbitteri postbitteri Zone across the G–LB at the GSSP in Penglaitan
(Chen et al., 2011; Wang et al., 2004).
Similarly, the consistently reversely magnetized interval in the
lowermost Codonofusiella–Reichelina Zone of the Mitai Formation also
fits into the reverse interval reported from the topmost C. postbitteri honshuiensis Zone, C. postbitteri postbitteri Zone, and the lowermost
C. dukoensis Zone across the G–LB at the GSSP in South China (Shen
et al., 2010).
These data add validity not only to the biostratigraphic correlation
based on fusuline zones in the paleo-atoll sections in Japan (Ota and
Isozaki, 2006) and conodont zones in shelf sequences in South China (Shen and Mei, 2010), but also to the chemostratigraphical correlation
based on stable carbon isotope ratio of carbonates (Isozaki, 1997a,b).
The Yabeina and Lepidolina zones of the Iwato Formation are correlated with the Capitanian conodont zones; i.e. the Jinogondolella postserrata Zone to J. granti Zone, whereas the barren interval of the uppermost Iwato Formation likely corresponds to the C. postbitteri honshuiensis
Zone that marks the uppermost Capitanian conodont zone, in South China.
6.3. Identifying the Illarawa Reversal
From the viewpoint of magnetostratigraphy, it is particularly note-worthy that the lower part of the Iwato Formation is characterized by the presence of samples with clear normal polarity in the N. craticulifera Zone of early Wordian age, which continues up into the overlying N. margaritae Zone of late Wordian age. These data indicate that a normal interval surely appeared in the Wordian, probably for
thefirst time since the Late Carboniferous. A long-lasting “reverse
inter-val” that continued for ca. 50 million years from the Late Carboniferous
to the Middle Permian has been widely known as the Kiaman Reverse
Superchron (Irving and Parry, 1963). The‘Illawarra Reversal’ is an
infor-mal term used to mark the top of the Kiaman Reverse Superchron, or the
base of the Permian–Triassic Mixed Superchron (Gradstein et al., 2012;
Irving and Parry, 1963; Isozaki, 2009; Steiner, 2006). Nonetheless, its age has not been precisely determined because it was originally detect-ed in the non-marine coal measures in eastern Australia that lack diag-nostic marine index fossils for global correlation. Therefore, previous summaries for the Permian magnetostratigraphy were not necessarily consistent from each other, particularly for the Wordian interval. For
ex-ample,Ogg et al. (2008)placed the Illawarra Reversal at the base of the
Capitanian, whereasSteiner (2006)andHenderson et al. (2012)put it
in the middle of the Wordian. Unfortunately, there are numerous prob-lems in compiling the late Permian information, as much of the data
discussed bySteiner (2006)are unpublished, and many of the sections
in Europe and Africa are in continental facies, where the correlations to
the marine realm are uncertain(Szurlies, 2013; Ward et al., 2005). Our
data clearly show Normal chrons both in mid-Wordian time and mid to late Capitanian time, with good biostratigraphic and chemostratigraphic
constraints (Ota and Isozaki, 2006).
The present data confirm that the Capitanian part (the Yabeina Zone
and Lepidolina Zone) possesses normal intervals. As to possible normal sub-chrons in the Wordian, however, two interpretations are possible: 1) these signals can be regarded as small-scale geomagnetic noise with-in the Kiaman Reverse Superchron, and the Illawarra Reversal with-in
mid-superocean is stratigraphically placed around the G–LB asOgg et al.
(2008)proposed, or 2) one of them represents thefirst appearance of a solid normal interval that pins down the Illawarra Reversal in mid-Wordian time. Judging from the frequent appearance of normal signals, we prefer the latter interpretation here, in accordance with the
compi-lations ofSteiner (2006)andHenderson et al. (2012).
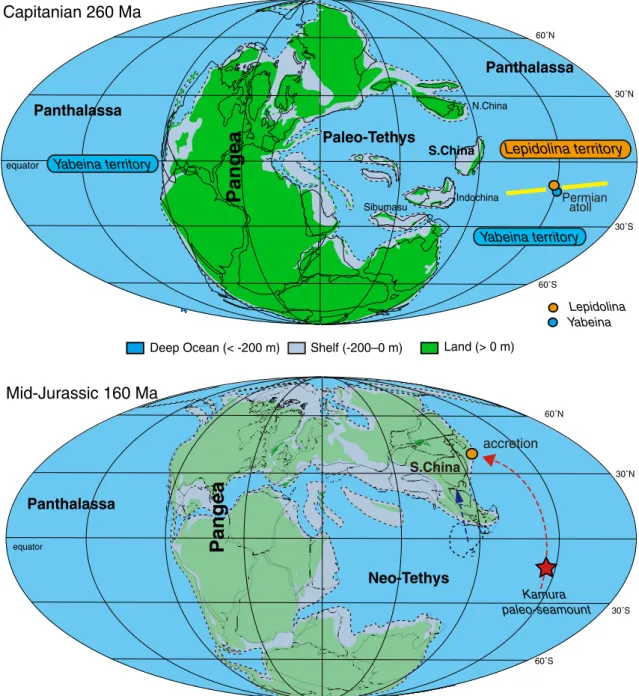
6.4. Migration history of seamount and paleobiogeographical implications The present paleomagnetic data demonstrate a long travel distance of the Permian mid-superoceanic seamount capped by a paleo-atoll
complex. Around the G–L boundary, ~260 Ma, the seamount was
accu-mulating shallow marine atoll carbonates at 12.2 ± 1.8° S in the middle of the Panthalassic ocean. The seamount later migrated toward north-west to eventually accrete to the Japan (= South China) margin at mid-latitude in the northern hemisphere during the mid-Jurassic
(ca. 165–160 Ma), as indicated schematically inFig. 7. The
paleomag-netic data (and polarity interpretation) imply that it was subjected to a vertical-axis rotation (w.r.t. North) of only about 30° CCW, over its entire history. The total travel distance of the seamount within west-ern Panthalassa likely reached ~ 3000 km, assuming a typical plate convergence rate of 3 cm/year, and 100 myr to dock. During the north-ward migration of the seamount, it likely crossed a paleo-biogeographic provincial boundary, i.e. a border between the two contemporary
fusuline territories (e.g.,Kasuya et al. (2012)). In fact,Kasuya et al.
(2012)were thefirst to document the practical location of a mid-oceanic biogeographic province boundary within the pre-Jurassic lost oceans. We emphasize here that similar paleomagnetic studies on weakly