HAL Id: hal-00298932
https://hal.archives-ouvertes.fr/hal-00298932
Submitted on 3 Mar 2008HAL is a multi-disciplinary open access
archive for the deposit and dissemination of sci-entific research documents, whether they are pub-lished or not. The documents may come from teaching and research institutions in France or abroad, or from public or private research centers.
L’archive ouverte pluridisciplinaire HAL, est destinée au dépôt et à la diffusion de documents scientifiques de niveau recherche, publiés ou non, émanant des établissements d’enseignement et de recherche français ou étrangers, des laboratoires publics ou privés.
Isotope hydrology of dripwaters in a Scottish cave and
implications for stalagmite palaeoclimate research
L. Fuller, A. Baker, I. J. Fairchild, C. Spötl, A. Marca-Bell, P. Rowe, P. F.
Dennis
To cite this version:
L. Fuller, A. Baker, I. J. Fairchild, C. Spötl, A. Marca-Bell, et al.. Isotope hydrology of dripwaters in a Scottish cave and implications for stalagmite palaeoclimate research. Hydrology and Earth System Sciences Discussions, European Geosciences Union, 2008, 5 (2), pp.547-577. �hal-00298932�
HESSD
5, 547–577, 2008 Isotope hydrology of cave dripwaters L. Fuller et al. Title Page Abstract Introduction Conclusions References Tables Figures ◭ ◮ ◭ ◮ Back CloseFull Screen / Esc
Printer-friendly Version Interactive Discussion
EGU Hydrol. Earth Syst. Sci. Discuss., 5, 547–577, 2008
www.hydrol-earth-syst-sci-discuss.net/5/547/2008/ © Author(s) 2008. This work is licensed
under a Creative Commons License.
Hydrology and Earth System Sciences Discussions
Papers published in Hydrology and Earth System Sciences Discussions are under open-access review for the journal Hydrology and Earth System Sciences
Isotope hydrology of dripwaters in a
Scottish cave and implications for
stalagmite palaeoclimate research
L. Fuller1, A. Baker1, I. J. Fairchild1, C. Sp ¨otl2, A. Marca-Bell3, P. Rowe3, and P. F. Dennis3
1
School of Geography, Earth and Environmental Sciences, University of Birmingham, Birmingham, B15 2TT, UK
2
Department of Geology and Palaeontology, University of Innsbruck, Innrain 52, 6020 Innsbruck, Austria
3
School of Environmental Sciences, University of East Anglia, Norwich, NR4 7TJ, UK Received: 6 December 2007 – Accepted: 27 January 2008 – Published: 3 March 2008 Correspondence to: I. J. Fairchild (i.j.fairchild@bham.ac.uk)
HESSD
5, 547–577, 2008 Isotope hydrology of cave dripwaters L. Fuller et al. Title Page Abstract Introduction Conclusions References Tables Figures ◭ ◮ ◭ ◮ Back CloseFull Screen / Esc
Printer-friendly Version Interactive Discussion
EGU
Abstract
Dripwater hydrology and hydrogeochemistry is particularly useful to constrain the meaning of speleothem palaeoclimate archives, for example using δ18O signatures. Here, we calibrate the relationship betweenδ18O in precipitation, percolation waters and contemporary calcite deposits, at Tartair cave, Sutherland, NW Scotland, an
At-5
lantic site sensitive to regional changes both of temperature and precipitation. Monthly precipitation displayed a 7.1‰ range inδ18O, a negative linear relationship with rainfall amount, and no correlation with temperature. Autogenically-derived cave percolation waters show little variation inδ18O during the same period and their annual weighted mean is the same as that of the local precipitation. This evidence together with
hydro-10
logical data and electroconductivity values indicates that percolation waters are well mixed and dominated by stored water. Calculated values ofδ18O of calcite deposited in this cave environment indicate that the cave deposits are forming close to isotopic equilibrium and kinetic effects are negligible. Comparison of a high-resolution δ18O sta-lagmite record with the instrumental record of climate indicates that isotopically heavy
15
values are reflective of relatively cold, dry conditions (and vice-versa for warm, wet condition) and hence that stalagmite oxygen isotopes provide an appropriate means of investigating the palaeoclimate in this location.
1 Introduction
The hydrological behaviour of small water volumes becomes particularly important
20
when they feed, and hence control the composition of growing calcareous deposits (speleothems) in karstic cavities. Speleothems are recognised as important continen-tal archives of palaeoenvironmencontinen-tal information: they can be accurately dated using U-series techniques and their subterranean location means that they can accumulate undisturbed for thousands of years. Their 18O/16O ratios can be used to reconstruct
25
climate, although the rationale used can sometimes be complex and in need of further testing (McDermott, 2004; Fairchild et al., 2006a). Major long-term shifts inδ18O can
HESSD
5, 547–577, 2008 Isotope hydrology of cave dripwaters L. Fuller et al. Title Page Abstract Introduction Conclusions References Tables Figures ◭ ◮ ◭ ◮ Back CloseFull Screen / Esc
Printer-friendly Version Interactive Discussion
EGU sometimes be shown to be directly controlled by changing climate systems,
indepen-dent of details of the cave environment (e.g. Wang et al., 2001). More usually, in order for this isotopic information to be utilized, an understanding of how these surface cli-mate signals are transmitted from meteoric precipitation to a speleothem via the soil and groundwater system is essential (Fairchild et al., 2006a; Mickler et al., 2006).
5
There are two major forcing factors external to the cave environment which can change the 18O/16O ratio of calcite deposits: a change in the isotopic composition of the precipitation feeding the speleothem, or a change in cave temperature. The oxy-gen isotopic composition of precipitation (δ18Oppt) in different regions can be controlled
by the extent of temperature-related Rayleigh fractionation in the atmosphere, or may
10
inversely correlate with the amount of rainfall, or show more complex effects, includ-ing controls by moisture source (Rozanski et al., 1993; Hoffman et al., 1998; Mook, 2000). The western seaboard of Europe displays complex controls such that changes in δ18O over time cannot be predicted from first principles because the relationship between isotopic composition, synoptic weather processes, and climatic modes have
15
been incompletely explored. For example, in the UK there is normally a relationship between seasonality of temperature and summer and winterδ18O signatures (Darling and Talbot, 2003), but such a correlation does not imply a simple causality (Treble et al., 2005a). The second control on calcite 18O/16O ratio is cave temperature which, away from the entrance, is very close to the mean annual air temperature (MAT)
out-20
side the cave (Wigley and Brown, 1976). An increase in cave temperature will lead to calcite becoming isotopically lighter.
Speleothem18O/16O is also susceptible to local forcing factors. Processes such as transpiration from vegetation above the cave (Williams and Fowler, 2002) and vegeta-tion change over time (Baldini et al., 2005), evaporavegeta-tion of soil waters (Bar-Matthews
25
et al., 1996; Denniston et al., 1999), and mixing within the karstic aquifer (Williams and Fowler, 2002; Yonge et al., 1985) have all been shown to play a role in changing the isotopic composition between rainfall and the emerging cave drip waters. The influ-ence of the karst system upon drip hydrology in turn affects the majority of geochemical
HESSD
5, 547–577, 2008 Isotope hydrology of cave dripwaters L. Fuller et al. Title Page Abstract Introduction Conclusions References Tables Figures ◭ ◮ ◭ ◮ Back CloseFull Screen / Esc
Printer-friendly Version Interactive Discussion
EGU signals preserved in the subsequently deposited stalagmite calcite, the route taken by
the percolating water being of primary importance. Physical characteristics of cave percolation waters are diverse (e.g. Gunn, 1981; Mangin, 1975; Atkinson, 1977) and can be classified for example in terms of mean and variance of discharge (Friederich and Smart, 1982). Conceptually this can be related to varying inputs from conduit,
frac-5
ture and matrix porosity in a triple-porosity aquifer (Tooth and Fairchild, 2003; Fairchild et al., 2006b). Nevertheless, the biphase (air-water) nature of the feeding system, pressure variations, and geometrical complexities result in significant non-linear be-haviours of dripwaters (Destombes et al., 1997; Genty and Deflandre, 1998; Baker and Brunsdon, 2003), including inter-annual variability (Baldini et al., 2006). The
hydrol-10
ogy of stalagmite feeding percolation waters must be monitored in order to understand the nature of the percolation water and its evolutionary pathway (reservoirs, residence times, response to periods of heavy rainfall such as flow switching, or drought), as well as identifying any offset in composition from that of atmospheric precipitation.
Few studies have monitored cave systems in sufficient detail to understand and
15
correctly interpret the controlling influences, although it has been found that in mid-latitudes cave drip waters generally reflect the mean annual isotopic composition of the precipitation in the local area (Caballero et al., 1996; Williams and Fowler, 2002; Yonge et al., 1985). Where drip discharge varies little and seepage flow can be inferred, no seasonal variation inδ18O is found, whereas when a component of fracture-fed flow is
20
present, such variations should be present (e.g. Fairchild et al., 2006a, 2006b) and in-deed have been identified in both dripwaters (e.g. van Beynen and Febbroriello, 2006) and speleothems (Treble et al., 2005b).
In the study presented in this paper, we have gone beyond previous work by com-paring the isotopic composition of drips in the modern cave with a high-resolution
25
δ18O record from an annually-laminated speleothem fed by one of the studied drips which allowed comparison with the instrumental climate record and hence permitted a more thorough test of the suitability of stalagmites from this site for palaeoclimate determination.
HESSD
5, 547–577, 2008 Isotope hydrology of cave dripwaters L. Fuller et al. Title Page Abstract Introduction Conclusions References Tables Figures ◭ ◮ ◭ ◮ Back CloseFull Screen / Esc
Printer-friendly Version Interactive Discussion
EGU
2 Study site
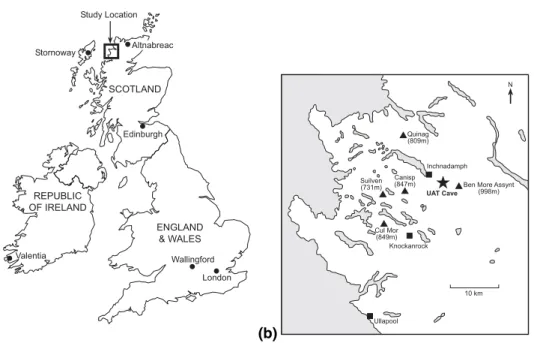
The study cave is in the Assynt area, located on the North Atlantic seaboard of NW Scotland (Fig. 1). Based on 1971–2000 averages, the regional climate is oceanic with
>1900 mm rainfall, 250–270 rain days per year, 4–6 snow days, and an average of
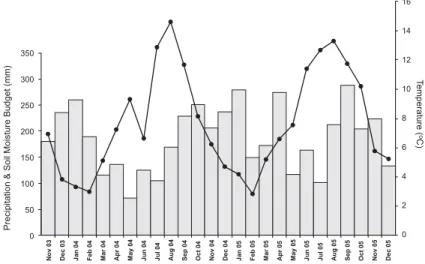
77% cloud cover annually (Proctor et al., 2000). Mean annual air temperature is 7.1◦C
5
(Fig. 2). The Assynt area shows a relationship between precipitation and the winter North Atlantic Oscillation (NAO) Index , and temperature and ocean circulation via the North Atlantic drift (Colman, 1997; Hurrell, 1995). The NAO is a large-scale fluctuation in atmospheric pressure between the subtropical high pressure system located near the Azores in the Atlantic Ocean and the sub-polar low pressure system near Iceland
10
and is quantified in the NAO Index, which is the pressure difference between the two. NW Scotland displays higher mean annual precipitation occurring during years with a more positive winter NAO index associated with a stronger westerly circulation and higher frontal rainfall (Proctor et al., 2000, 2002). Annual stalagmite growth bands from the study site have been used to reconstruct past rainfall patterns (Proctor et al., 2000,
15
2002), northern hemisphere temperature (Smith et al., 2006) and snow cover (Baker et al., 2002).
The studied cave chamber is within the Cnoc nan Uamh (Gaelic for Cave Knoll) cave system (National Grid Reference NC276206, Lawson, 1988), situated 3 km east of Inchnadamph and 220 m above OD (Fig. 1). The entrance is through a stream
pas-20
sage close to a waterfall which inspired the name Uamh an Tartair (Roaring Cave) and we use Tartair as the generic site name. Tartair is developed in Cambro-Ordovician dolomite, dipping at shallow angles, and containing a thin igneous sill; bedrock is over-lain by peat. It is situated within the Traligill Basin, a peat dominated catchment (near-basal radiocarbon peat age above the cave of 2130±180 cal years BP) (Charman et
25
al., 2001). Cnoc nan Uamh is small, shallow and complex cave system with three known entrances (Lawson, 1988). Water to this cave is supplied both autogenically (from seepage water derived directly from the peat covered surface) and allogenically
HESSD
5, 547–577, 2008 Isotope hydrology of cave dripwaters L. Fuller et al. Title Page Abstract Introduction Conclusions References Tables Figures ◭ ◮ ◭ ◮ Back CloseFull Screen / Esc
Printer-friendly Version Interactive Discussion
EGU (by an active underground stream which runs through the cave system). The Grotto is
a well-decorated chamber ∼40m from the main cave entrance, and ∼10 m below the surface; it contains a high density of drip sites with a high soda straw density. In the Grotto area various inlets supplied by autogenic percolation water were selected for monitoring; all of these actively depositing soda straw stalactite and underlying
stalag-5
mite deposit. Previous unpublished monitoring by one of us (AB) in the 1990s found the mean annual temperature and relative humidity to be 7.1◦C and >98%, respectively.
In the current period of monitoring, the temperature range determined from Tinytag monitors left in the Grotto was 4.8 to 9.5◦C, with a mean of 7.2◦C.
3 Materials and methods
10
Monthly bulk precipitation samples for isotopic analysis were collected from Inch-nadamph (3 km from the cave), using a plastic rain gauge, 0.5 m above ground level; paraffin oil was added to prevent evaporation. Each sample was taken on the last day of the month from November 2003–November 2005, but there were two missing months in the second year of sampling.
15
Cave drip water samples were collected from thirteen, hydrologically diverse drip sites over two hydrological years, at a resolution of two to three months. Drip waters were collected in high density polypropylene (HDPE) bottles over a period of 24–28 h; after collection they were sealed and refrigerated until analysis. Ancillary information collected includes the drip interval (time between drips) and electroconductivity (EC),
20
the latter using a WTW Multi 340i instrument, automatically correcting data to 25◦C (±0.5%). Ionic analyses (Fuller, 2007) confirm that EC is a good proxy for the total ion content derived from carbonate dissolution, i.e. dissolved calcium, magnesium and bicarbonate concentrations.
Oxygen and hydrogen isotope measurements of waters were carried out at the
25
University of East Anglia using CO2-equilibration for δ18O (precision 0.06‰) and by reduction using glassy carbon chips in continuous flow for δD measurements
HESSD
5, 547–577, 2008 Isotope hydrology of cave dripwaters L. Fuller et al. Title Page Abstract Introduction Conclusions References Tables Figures ◭ ◮ ◭ ◮ Back CloseFull Screen / Esc
Printer-friendly Version Interactive Discussion
EGU was replicated and an internal laboratory reference water was measured after every
third sample. External precision was 2‰.
The isotopic ratio of the contemporary calcite was measured at the University of Innsbruck, Austria. Calcite was sampled at high resolution from two Tartair sta-lagmites SU96-7 and SU03-2 (whose drip waters have also been collected), using
5
a micromill system, using continuous trenches, with a resolution of 0.1 mm in the growth direction. The drilled stalagmite powders were then analyzed for δ18O using a continuous-flow isotope-ratio mass spectrometer; for analytical details see Sp ¨otl and Vennemann (2003).
Isotope values are reported in delta units, which are permil deviation of the isotopic
10
ratio from a standard:
δ (in ‰) = ((Rsample− Rstandard)/Rstandard).1000 (1)
where R is the ratio of heavy to light isotope. The standard for reporting water
isotopes is Vienna standard mean ocean water (V-SMOW) and for oxygen is calcite is Vienna Pee Dee Belemnite (V-PDB).
15
Precipitation and temperature data for Stornoway (see Fig. 1 for location) from AD 1873 to 2006 were obtained from the UK meteorological office. This was correlated with existing precipitation and temperature data (AD 1963–AD 1996) for Knockanrock (National Grid Reference NC187088, Fig. 1), 80 km SE of Stornaway and 12 km SW of the Tartair site at a similar altitude and aspect. A positive linear relationship was
20
found between Stornoway and Knockanrock for both temperature (r=0.99) and
precip-itation (r=0.84), both significant at the 99.9% confidence interval (Proctor et al., 2000).
This relationship was then used to calculate Knockanrock precipitation and tempera-ture from July 1874 to the present (November 2003 to December 2005 shown in Fig. 2). The soil moisture budget was calculated from these data using the equation of
Thorn-25
thwaite (1948). Temperature in the Tartair Grotto was logged from November 2003 to November 2005 using Tinytag Plus temperature loggers (sensor accuracy of 0.2◦C)
HESSD
5, 547–577, 2008 Isotope hydrology of cave dripwaters L. Fuller et al. Title Page Abstract Introduction Conclusions References Tables Figures ◭ ◮ ◭ ◮ Back CloseFull Screen / Esc
Printer-friendly Version Interactive Discussion
EGU
4 Results
4.1 Isotopic composition of precipitation
The mean annual δ18O of the local precipitation (δ18Oppt) over the 2-year collection period is given in Table 1. For each year the meanδ18Oppt is −6.6‰, although there
is more variation during the first year (7.1‰) than the second (3.7‰). The data shows
5
some evidence of seasonality; during the first year this is highlighted by the difference between the summer (−5.7‰) and winter (−7.5‰) mean values. The annual amount-weighted δ18O value for Inchnadamph precipitation is −7.1‰. This is 1.7‰ heavier than the amount weighted value ofδ18Opptcalculated for the nearest Global Network
of Isotopes in Precipitation (GNIP) site at Altnabreac, Caithness (Fig.1), which existed
10
for a 13 month period from 1980 to 1981 (Kay et al., 1984).
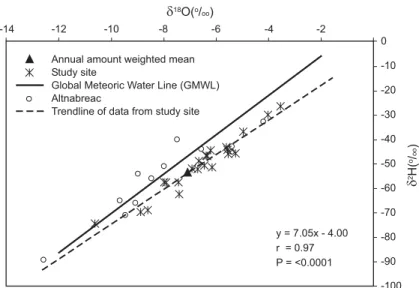
A strong linear relationship exists betweenδ18O and δ2H in Inchnadamph monthly precipitation (r=0.98), demonstrated by the linear regression shown in Fig. 3, which
represents the local meteoric water line (LMWL). The Global Meteoric Water Line (GMWL) is also shown in Fig. 3. The Inchnadamph LMWL slope (7.05) is similar to
15
other UK sites, for example 7.02±0.10 for Wallingford (GNIP, 2002) and 6.32±0.79 for Altnabreac (GNIP, 2002).
4.2 Percolation water hydrology and ion content
The drip water inlets monitored within the Grotto area of Cnoc nan Uamh cave system are hydrologically diverse with a large range in mean discharges by a factor of nearly
20
1000 (Table 2). The coefficient of variation (CVQ) the quotient of the standard deviation
and the mean discharge expressed as a percentage, provides a suitable dimensionless assessment of discharge variability (Friederich and Smart, 1982), whereas the maxi-mum discharge (Qmax) reflects the transmission capacity. In the classification updated
by Baker et al. (1997), the Tartair drips are all in low Qmax categories, being either
25
HESSD
5, 547–577, 2008 Isotope hydrology of cave dripwaters L. Fuller et al. Title Page Abstract Introduction Conclusions References Tables Figures ◭ ◮ ◭ ◮ Back CloseFull Screen / Esc
Printer-friendly Version Interactive Discussion
EGU of a more seasonal or “flashy” response to surface events such as high rainfall and
a tendency to stop flowing during dry periods (Baker et al., 1997), during which the limestone unsaturated zone is decoupled from rainfall input, and inlets are fed from storage (Smart and Friederich, 1987; Williams and Fowler, 2002). It is notable that the dripsite corresponding to our studied stalagmite, SU96-7, has a combination of a
5
very slow drip rate and the lowest CVQvalue of 6% (Table 2) indicative of a large stor-age component which feeds the drip throughout periods of drier weather. Maximum discharges measured significantly underestimate the true figures since the cave was not accessible during heavy rainfall events and peak snowmelt. However only a minor component of stalagmite growth would occur during the wet events that have not been
10
directly observed, and so the isotopic data of the water should be more representative from this perspective.
The electroconductivity data display a limited range of mean values (Table 2), con-sistent with the observed supersaturation of all the drips. There is no universal rela-tionship between hydrology and ion content, although most seasonal drip sites display
15
greater electroconductivity variation. Most sites also display a negative relationship of electroconductivity and discharge, consistent with some dilution by a quickflow com-ponent. The slow driprate of site 96-7 made it difficult to collect sufficient sample for EC measurement, but three observations lay well within the range of other samples. In summary, the low variability of electroconductivity values points to the dominance of
20
storage flow and the greater variation in discharge is therefore likely to reflect mainly piston flow accelerating the discharge of stored water, together with a small quickflow component.
4.3 Oxygen isotope composition of cave percolation waters
The lightestδ18O value recorded for drip water is −7.66‰ and the heaviest is −5.99‰
25
(Table 3), and the range of values recorded is quite muted, from 0.36‰ at S2 to 1.19‰ at S5. There does not appear to be any overall difference between drip sites classified as “seepage flow” and those termed “seasonal”. The total range of all drip sites is
HESSD
5, 547–577, 2008 Isotope hydrology of cave dripwaters L. Fuller et al. Title Page Abstract Introduction Conclusions References Tables Figures ◭ ◮ ◭ ◮ Back CloseFull Screen / Esc
Printer-friendly Version Interactive Discussion
EGU 1.67‰ over the two year monitoring period. The mean of theδ18O of drip sites during
the first monitoring year (2003–2004) is −7.18‰, identical within error with the mean of −7.09‰ during the whole monitoring episode. Several points should be borne in mind when making comparison between precipitation and percolation water composition. Firstly, the sampling visits were not monthly in resolution. Secondly the cave drip
5
water samples analyzed are grab samples of water at the time of the field visit and not monthly bulk samples. Thirdly the field visits are biased to spring/summer times when access to the cave system is less likely to be prevented by adverse weather conditions. The inaccessibility of the cave during high rainfall events further biases theδ18O data of the cave drip sites. Nevertheless, it is remarkable that the mean percolation values
10
the same as the annual mean amount-weighted value of precipitation (Table 1). A time-series plot of all the cave drip site δ18O throughout the surveillance period is given in Fig. 4. A number of points are worth noting. Firstly theδ18O of the cave drip sites appear to vary synchronously through time. Monitoring visits with the least drip waterδ18O variation occur at the end of the driest period (July 2004): this could
15
be indicative of overwhelming reliance on stored water by all cave drip water sites at this time. The range of δ18O values displayed by the drip waters is significantly attenuated when compared to those of the local precipitation and show little (much reduced) seasonality (Fig. 4d). This suggests that cave drip waters are well mixed and that the bulk of the water is stored in the overlying karst for periods in excess of 1 year.
20
5 Discussion
5.1 Relationship with climate
In this section, we examine whether the composition of atmospheric precipitation has a relationship to climate and whether such a relationship is likely to be stationary. There is no correlation between the monthlyδ18Opptvalues during the two year sampling period 25
HESSD
5, 547–577, 2008 Isotope hydrology of cave dripwaters L. Fuller et al. Title Page Abstract Introduction Conclusions References Tables Figures ◭ ◮ ◭ ◮ Back CloseFull Screen / Esc
Printer-friendly Version Interactive Discussion
EGU the δ18Oppt shows a negative linear correlation with local precipitation amount, with
anr-value of −0.42 which is statistically significant at the 0.01 level. Isotopically less
negative values occur during the summer months when monthly precipitation totals are lower (Fig. 2) and vice versa. This manifestation of the “amount effect” probably relates to the behaviour of synoptic weather systems, but has not been investigated further.
5
In contrast to this record, there is a positive (r=0.47) and statistically significant corre-lation between the monthly temperature andδ18Opptfor Valentia, Ireland (1960–2000),
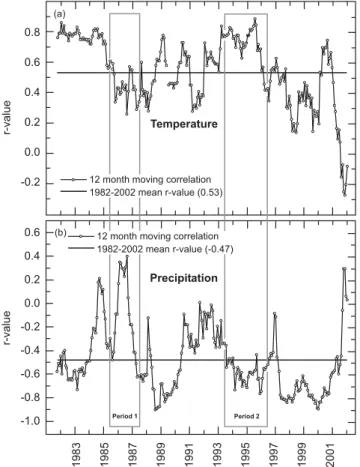
a site similar to Assynt in terms of latitude and proximity to the North Atlantic. This suggests that a longer monitoring period is required to reveal a temperature influence on isotopic composition. One way we can examine the adequacy of the monitoring
10
length in Assynt is to perform a moving correlation on a longer data series and assess whether ther-value observed between variables during any 24 month window differs significantly to that overall. For this we used the continuous 20-year data set for GNIP site Wallingford (Fig. 1), Central England (Fig. 5), since there are gaps in the Valentia record. Ther-values for the long-term (20-year) relationship between δ18Opptand
tem-15
perature (r=0.53) and precipitation (r=−0.47) are represented by the thick horizontal
lines. However, Fig. 5 highlights that for any shorter period at a given monitoring site the shorter term (c. 12–24 month) mean can vary significantly. For example, in period 1 (c. 1987–1989) in Fig. 5, if a monitoring study had been performed during this time the relationship betweenδ18Opptand climate (monthly PPT amount and T) would be 20
very different to both the long-term 20-year relationship and that which would be estab-lished during another shorter time-slice e.g. period 2 (1994–1997). In period 1 there is a positive relationship with precipitation amount and a weaker positive correlation with temperature, whereas in period 2, there is a stronger negative correlation to precipi-tation amount and a stronger positive relationship with temperature. In summary, the
25
non-stationary relationships ofδ18O with climate parameters in the UK context implies that empirical correlations must be used and modern speleothems can be used for this purpose.
HESSD
5, 547–577, 2008 Isotope hydrology of cave dripwaters L. Fuller et al. Title Page Abstract Introduction Conclusions References Tables Figures ◭ ◮ ◭ ◮ Back CloseFull Screen / Esc
Printer-friendly Version Interactive Discussion
EGU 5.2 Contemporary calcite
In this section, we explore whether the modern precipitates in the cave have an equi-librium composition as predicted from cave temperature and isotopic composition of the dripwaters. From the range of measured air temperatures within the Grotto (Ta-ble 4) and the range ofδ18O measured from drip sites SU96-7 and SU03-2 (Table 3),
5
a predicted range ofδ18O for calcite (δ18Oc) deposited under these conditions can be calculated (Table 5). These values are compared to actual values ofδ18Oc of the top
1 mm of two Cnoc nan Uamh stalagmites. Stalagmite SU96-7 (Proctor et al., 2000) was actively growing in 1996 when collected. Stalagmite SU03-2 from the same cave system was actively growing when collected in 2003. The top 1mm from SU96-7
rep-10
resents calcite deposited between AD 1960 and 1996, a period of 36±1 years (Proctor et al., 2000). A lamina count on the top of stalagmite SU03-2 (unpublished data) con-firms that this sample was deposited more recently and in a much shorter time period of approximately 9-10 years (between ∼AD 1995 and 2003).
The predicted δ18Oc calculated using mean annual air temperature and the mean
15
annualδ18O of the drip waters is −5.7‰ (Table 5). This compares with the measured
δ18Ocof −5.1‰and −5.3‰ for stalagmites SU96-7 and SU03-2 respectively (Table 6). The calcite values are closer to theδ18O of calcite predicted using cave minimum tem-perature (4.8◦C). This may suggest that a significant proportion of the deposited calcite
occurs during colder winter months. This would be logical since cave air CO2 concen-20
tration is lower during winter time leading to higher supersaturations for calcite (Fuller, 2007). Elsewhere, small (less than 1‰), but systematic offsets to higher δ18Oc val-ues have been interpreted as non-equilibrium deposition (McDermott et al., 2005), and larger kinetic effects were found in a Caribbean cave by Mickler et al. (2006). Alterna-tively, if the experimental data of Friedman and O’Neil (1977) are used for calibration,
25
a predicted mean calcite value of −5.0‰ is found suggesting equilibrium deposition. However in any case, the cold cave temperatures (minimizing evaporation), the steady non-flashy nature of the cave drip waters and the thick peat vegetation cover above the
HESSD
5, 547–577, 2008 Isotope hydrology of cave dripwaters L. Fuller et al. Title Page Abstract Introduction Conclusions References Tables Figures ◭ ◮ ◭ ◮ Back CloseFull Screen / Esc
Printer-friendly Version Interactive Discussion
EGU cave suggests that in this cave such kinetic effects on δ18O are likely to be minimal.
5.3 The sensitivity ofδ18O to record climate conditions
Using the monitoring data, the sensitivity ofδ18Oc to changing meteorological condi-tions over the instrumental period (1874 AD–present) can be tested. Firstly, the annual weighted meanδ18Oppt for each year is calculated. This is done using the corrected 5
Stornoway temperature and precipitation series (Proctor et al., 2000) which extend back from the present to 1879 AD and the multiple linear regression equations found betweenδ18Opptand climate at our field site (based on 2-year monitoring period) and
Valentia (IAEA GNIP site), based on a longer though discontinuous 44-year monitoring period.
10
The regression equations for the two locations are as follows: Inchnadamph :δ18O
ppt= −0.015 × PPT amount − 3.92 (2)
Valentia :δ18Oppt= 0.199 × T − 0.008 × PPT amount − 6.28 (3) Using the monthly climate data from AD 1879 to present (Proctor et al., 2000), the monthly and annual δ18Oppt from AD 1879 to present are hindcast. Because it has 15
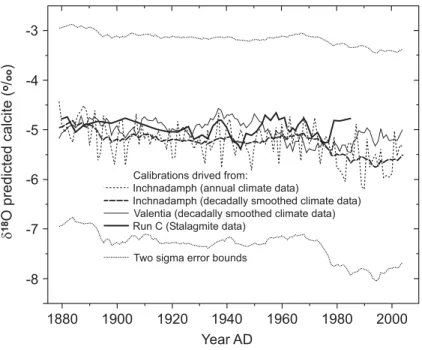
already been shown that the mean annual δ18Ow is close to mean annual δ18Oppt this value is inserted together with mean annual temperature into the equation of Kim and O’Neill (1997). Figure 6 shows the results in comparison with δ18Oc data from stalagmite SU96-7 at an average resolution of 2.5 years. The stalagmite chronology has been derived by cross-correlation with the annual fluorescent lamina width time
20
series (Proctor et al., 2000). A close similarity of the absolute values hindcast from both Valentia and the local rainfall, and measured in the stalagmite, can be observed. Theδ18Ocvalues display a slight trend towards lighter values over time, with a visually a closer match provided by Eq. (3) from the Valentia data than Eq. (2) from the local data, at least for the first half of the twentieth century. However, the local calibration is
HESSD
5, 547–577, 2008 Isotope hydrology of cave dripwaters L. Fuller et al. Title Page Abstract Introduction Conclusions References Tables Figures ◭ ◮ ◭ ◮ Back CloseFull Screen / Esc
Printer-friendly Version Interactive Discussion
EGU more limited since it depends mostly on rainfall variability, given that the 2-year
calibra-tion period (n=22) was too short to capture any significant temperature variation. The short local observation period also contributes to the width of the error bars associated with the hind-cast; the clustering of all three time series around the mean suggests that with a longer calibration period the hindcast data would still agree with stalagmite
5
observations within errors. From this hindcasting exercise it can be seen that isotopi-cally depletedδ18Oc is associated with wet and warm periods, whereas isotopically heavy calcite is characteristic of dry and cold years. Calcite deposited during dry and warm, or wet and cold years lies in-between. This result is of considerable interest in improving the climatic interpretations from this site over the past millennium, since the
10
published interpretations based on lamina thickness contrast warm, dry years (leading to enhanced growth) with cool, wet years (Proctor et al., 2000, 2002). Hence the two proxies should provide complementary information.
6 Conclusions
Monitoring of atmospheric precipitation found a range of 7.1‰ inδ18Oppt values. No 15
correlation is found betweenδ18Opptand temperature exists over the 2-year monitoring period, but a negative linear correlation is found with precipitation amount. Drip water
δ18O is attenuated compared to δ18Oppt: no drip displayed more than 1.2‰ variation
in the observation period and their mean composition was close to that of the annually-weighted precipitation. This indicates that the autogenic drip waters are dominated by
20
a large component of stored water (>1 year old) which is relatively well mixed. Drip
rate monitoring and measurements of EC reinforce this observation, drip rate being particularly constant for the drip that fed stalagmite SU96-7 that was analyzed for the hindcasting exercise. The predicted isotopic composition of calcite that should precipi-tate from these cave waters under the current range of cave temperatures is 0.5–0.7‰
25
heavier than that of contemporary calcite of two actively growing stalagmite tips, using the more recent fractionation factors. This small offset is diminished when the actual
HESSD
5, 547–577, 2008 Isotope hydrology of cave dripwaters L. Fuller et al. Title Page Abstract Introduction Conclusions References Tables Figures ◭ ◮ ◭ ◮ Back CloseFull Screen / Esc
Printer-friendly Version Interactive Discussion
EGU
δ18Oc values are compared to predictions made using minimum temperature, consis-tent with other evidence of faster winter growth. Hence, if there is a kinetic isotope effect during precipitation of calcite, it is relatively small. Kinetic fractionation is not thought to play a significant role during calcite deposition due to the cold cave temperatures, the steady non-flashy nature of the cave drips and the thick peat cover above the cave.
5
Hindcasting of the isotopic composition of calcite deposited during the instrumental climate record period (AD 1879–present) shows that this cave is sufficiently sensitive and has good potential for the development of a longer series of proxy climate records based on oxygen isotopes that will complement published interpretations derived from other proxies in the studied stalagmite.
10
Acknowledgements. We would like to thank: G. Moseley, C. Jex, C. Smith, C. Muller, J. Moss,
J. and L. Baldini for the help in the field, C. Rix for collection of water samples, and R. John-son for providing the field equipment. This research was funded by NERC (studentship NER/S/S/2003/11964) and formed part of the ASCRIBE project in the RAPID climate change thematic program.
15
References
Atkinson, T. C.: Diffuse flow and conduit flow in limestone terrain in the Mendip Hills, Somerset (Great Britain), J. Hydrol., 35, 93–110, 1977.
Baker, A. and Brunsdon, C.: Non-linearities in drip water hydrology: an example from Stump Cross Caverns, Yorkshire, J. Hydrol., 277, 151–163, 2003.
20
Baker, A., Barnes, W. L., and Smart, P. L.: Variations in the discharge and organic matter content of stalagmite drip waters in Lower Cave, Bristol, Hydrol. Process., 11, 541–555, 1997.
Baker, A., Proctor, C. J. and Barnes, W. L.: Stalagmite lamina doublets: a 1000 year proxy record of severe winters in Northwest Scotland, Int. J. Climatol., 22, 1339–1345, 2002. 25
Baldini, J. U. L., McDermott, F., Baker, A., Baldini, L. M., Mattey, D. P., and Railsback, L. B.: Biomass effects on stalagmite growth and isotope ratios: A 20th century analogue from Wiltshire, England, Earth Planet. Sc. Lett., 240, 486–494, 2005.
HESSD
5, 547–577, 2008 Isotope hydrology of cave dripwaters L. Fuller et al. Title Page Abstract Introduction Conclusions References Tables Figures ◭ ◮ ◭ ◮ Back CloseFull Screen / Esc
Printer-friendly Version Interactive Discussion
EGU
Baldini, J. U. L., McDermott, F., and Fairchild, I. J.: Spatial variability in cave drip water hy-drochemistry: Implications for stalagmite paleoclimate records, Chem. Geol., 235, 390–404, 2006.
Bar-Matthews, M., Ayalon, A., Matthews, A., Sass, E., and Halicz, L.: Carbon and oxygen isotope study of the active water-carbonate system in a karstic Mediterranean cave: Implica-5
tions for paleoclimate research in semiarid regions, Geochim. Cosmochim. Ac., 60, 337–347, 1996.
Begley, I. S. and Scrimgeour, C. M.: High-precision d2H and d18O measurement for water and volatile organic compounds by continuous-flow pyrolysis isotope ratio mass spectrometry, Anal. Chem., 69, 1530–1535, 1997.
10
Caballero, E., Jimenez De Cisneros, C., and Reyes, E.: A stable isotope study of cave seepage waters, Appl. Geochem., 11, 583–587, 1996.
Charman, D., Caseldine, C., Baker, A., Gearey, B., Hatton, J., and Proctor, C. J.: Paleohy-drological Records from Peat Profiles and Speleothems in Sutherland, Northwest Scotland, Quaternary Res., 55, 223–234, 2001.
15
Colman, A.: Prediction of summer central England temperature from preceding North Atlantic winter sea surface temperature, Int. J. Climatol., 17, 1285–1300, 1997.
Darling, W. G. and Talbot, J. C.: The O & H stable isotopic composition of fresh waters in the British Isles. 1. Rainfall, Hydrol. Earth Syst. Sci., 7, 163–181, 2003,
http://www.hydrol-earth-syst-sci.net/7/163/2003/. 20
Denniston, R. F. Gonzalez, L. A., Asmerom, Y., Baker, R. G., Reagan, M., and Bettis, E. A.: Evidence for increased cool season moisture during the middle Holocene, Geology, 27, 815– 818, 1999.
Destombes, J. L., Cordonnier, M., Gadat, Y. J., and Delannoy, J. J.: Periodic and aperiodic forcing of water flow through soda straw stalactites (Choranche, Vercors, France), 6th Con-25
ference on Limestone Hydrology and Fissured Media, Basel, Switzerland, 69–72, 1997. Fairchild, I. J., Borsato, A., Tooth, A. F., Frisia, S., Hawkesworth, C. J., Huang, Y., McDermott,
F. and Spiro, B.: Controls on trace element (Sr–Mg) compositions of carbonate cave waters: implications for speleothem climatic records, Chem. Geol., 166, 255–269, 2000.
Fairchild, I. J., Smith, C. L., Baker, A., Fuller, L., Sp ¨otl, C., Mattey, D., McDermott, F., and E. 30
I. M. F.: Modification and preservation of environmental signals in speleothems, Earth-Sci. Rev., 75, 105–153, 2006a.
HESSD
5, 547–577, 2008 Isotope hydrology of cave dripwaters L. Fuller et al. Title Page Abstract Introduction Conclusions References Tables Figures ◭ ◮ ◭ ◮ Back CloseFull Screen / Esc
Printer-friendly Version Interactive Discussion
EGU
Fairchild, I. J., Tuckwell, G. W., Baker, A., and Tooth, A. F.: Modelling of dripwater hydrology and hydrogeochemistry in a weakly karstified aquifer (Bath, UK): implications for climate change studies, J. Hydrol., 321, 213–231, 2006b.
Friedman, I. and O’Neil, J. R.: Compilation of stable isotope fractionation factors of geochemical interest, US Geological Survey Professional paper 440-KK, 49 pp., 1977.
5
Friederich, H. and Smart, P. L.: The classification of autogenic percolation waters in Karst Aquifers: A study in G.B Cave, Mendip Hills, England, Proceedings of the University of Bristol Spelaeological Society, 16, 143–159, 1982.
Fuller, L.: High-resolution multiproxy geochemical Holocene climate records from 1000-year old Scottish stalagmites, Unpublished PhD thesis, University of Birmingham, UK, 2007. 10
Genty, D. and Deflandre, G.: Drip flow variations under stalactite of the Pere Noel cave (Bel-gium), Evidence of seasonal variations and air pressure constraints, J. Hydrol., 211, 208– 232, 1998.
Gunn, J.: Hydrological Processes in karst depressions, Z. Geomorphol., 25, 313–331, 1981. Hoffmann, G., Werner, M., and Heimann, M.: Water isotope module of the ECHAM atmospheric 15
general circulation model: A study of timescales from days to several years, J. Geophys. Res., 103, 16 871–16 896, 1998.
Hurrell, J. W.: Decadal trends in the North-Atlantic oscillation – regional temperatures and precipitation, Science, 269, 676–679, 1995.
Kay, R. L. F., Andrews, J. N., Bath, A. H., and Ivanovich, M.: Groundwater flow profile and 20
residence times in crystalline rocks at Altnabreac, Caithness, UK, in: Isotope Hydrology, IAEA, Vienna, Austria, 231–248, 1984.
Kim, S. T. and O’Neil, J. R.: Equilibrium and non-equilibrium oxygen isotope effects in synthetic carbonates, Geochim. Cosmochim. Ac., 61, 3461–3475, 1997.
Lawson, T. J.: Caves of Assynt, The Grampian Speleological Group, Edinburgh, 1988. 25
Leng, M. J. and Marshall, J. D.: Palaeoclimate interpretation of stable isotope data from lake sediment archives, Quaternary Sci. Rev., 23, 811–831, 2004.
Mangin, A.: Contribution `a l’ ´etude des aquif `eres karstiques, Annales de Speleologie, 29, 21– 124, 1975.
McDermott, F.: Palaeo-climate reconstruction from stable isotope variation in speleothems: a 30
HESSD
5, 547–577, 2008 Isotope hydrology of cave dripwaters L. Fuller et al. Title Page Abstract Introduction Conclusions References Tables Figures ◭ ◮ ◭ ◮ Back CloseFull Screen / Esc
Printer-friendly Version Interactive Discussion
EGU
McDermott, F., Schwarcz, H., and Rowe, P. J.: 6. Isotopes in Speleothems, in: Isotopes in Palaeoenvironmental Research, edited by: Leng, M. J., Springer, Dordrecht, The Nether-lands, 185–225, 2005.
Mickler, P. J., Stern, L. A. and Banner, J. L.: Large kinetic isotope effects in modern speleothems, Geological Society of America Bulletin, 118, 65–81, 2006.
5
Mook, W. G.: Environmental Isotopes in the Hydrological Cycle, Volume II (Atmospheric Water) UNESCO, Paris/IAEA, Vienna, 2000.
Proctor, C. J., Baker, A., and Barnes, W. L.: A three thousand year record of North Atlantic Climate, Clim. Dynam., 19, 449–454, 2002.
Proctor, C. J., Baker, A., Barnes, W. L., and Gilmour, M.: A thousand year speleothem proxy 10
record of North Atlantic climate from Scotland, Clim. Dynam., 16, 815–820, 2000.
Rozanski, K., Araguas-Araguas, L. and Gonfiantini, R.: Isotopic patterns in modern global precipitation, in: Climate Change in continental Isotopic Records, edited by: Swart, P. K., Lohmann, K. L., McKenzie, J., and Savin, S., Geophysical Monograph 78, Americal Geo-physical Union, Washington D.C, 1–37, 1993.
15
Smart, P. L. and Friederich, H.: Water movement and storage in the unsaturated zone of a naturally karstified aquifer, Mendip Hills, England, Conference on Environmental Problems in Karst Terrains and their solution, National Water Well Association, Bowling Green, Kentucky, 57–87, 1987.
Smith, C. L., Baker, A., Fairchild, I. J., Frisia, S., and Borsato, A.: Reconstructing hemispheric-20
scale climates from multiple stalagmite records, Int. J. Climatol., 26, 1417–1424, 2006. Sp ¨otl, C. and Vennemann, T. W.: Continuous-flow isotope ratio mass spectrometric analysis of
carbonate minerals, Rapdid Commun. Mass. Sp., 17, 1004–1006, 2003.
Thornthwaite, C. W.: An approach towards a regional classification of climate, Geogr. Rev., 38, 55–94, 1948.
25
Tooth, A. F. and Fairchild, I. J.: Soil and karst aquifer hydrological controls on the geochemical evolution of speleothem-forming drip waters, Crag Cave, southwest Ireland, J. Hydrol., 273, 51–68, 2003.
Treble, P., Budd, W. F., Hope, P. K., and Rustomji, P. K.: Synoptic-scale climate patterns asso-ciated with rainfall delta O-18 in southern Australia, J. Hydrol., 302, 270–282, 2005a. 30
Treble, P., Chappell, J., Gagan, M. K., McKeegan, K. D., and Harrison, T. M.: In situ mea-surement of seasonal δ18O variations and isotopic trends in a modern speleothem from southwest Australia, Eearth Planet. Sc. Lett., 233, 17–32, 2005b.
HESSD
5, 547–577, 2008 Isotope hydrology of cave dripwaters L. Fuller et al. Title Page Abstract Introduction Conclusions References Tables Figures ◭ ◮ ◭ ◮ Back CloseFull Screen / Esc
Printer-friendly Version Interactive Discussion
EGU
Van Beynen, P. and Febbroriello, P.: Seasonal isotopic variability of precipitation and cave drip water at Indian Oven Cave, New York, Hydrol. Process., 20, 1793–1803, 2006.
Wang, Y. J., Cheng, H., Edwards, R. L., An, Z. S., Wu, J. Y., Shen, C. C., and Dorale, J. A.: A high-resolution absolute dated Late Pleistocene monsoon record from Hulu Cave, China, Science, 294, 2345–2348, 2001.
5
Wigley, T. M. L. and Brown, M. C.: The physics of caves, in: The Science of Speleology, edited by: Ford, D. C. and Cullingford, C. H. D., Academic Press, London, 329–358, 1976.
Williams, P. W. and Fowler, A.: Relationship between oxygen isotopes in rainfall, cave perco-lation waters and speleothem calcite at Waitomo, New Zealand, J. Hydrol. (NZ), 41, 53–70, 2002.
10
Yonge, C., Ford, D. C., Gray, J., and Schwarcz, H. P.: Stable isotope studies of cave seepage water, Chem. Geol., 58, 97–105, 1985.
HESSD
5, 547–577, 2008 Isotope hydrology of cave dripwaters L. Fuller et al. Title Page Abstract Introduction Conclusions References Tables Figures ◭ ◮ ◭ ◮ Back CloseFull Screen / Esc
Printer-friendly Version Interactive Discussion
EGU
Table 1. Summary data (per mil) ofδ18O andδ2H (values in parentheses) in monthly precipi-tation at Inchnadamph.
Year 1 Year 2
(Dec 2003–Nov 2004) (Dec 2004–Nov 2005)
Mean −6.6 (−49.9) −6.6 (−51.5)
Minimum −10.7 (−74.3) −8.6 (−68.8)
Maximum −3.6 (−26.5) −5.0 (−37.1)
Range 7.1 (47.7) 3.7 (31.7)
Summer mean (AMJJAS) −5.7 (−43.8) −6.4 (−52.0)
Winter mean (ONDJF) −7.5 (−56.0) −7.0 (−52.0)
Weighted mean −7.1 (−53.3) (data incomplete)
HESSD
5, 547–577, 2008 Isotope hydrology of cave dripwaters L. Fuller et al. Title Page Abstract Introduction Conclusions References Tables Figures ◭ ◮ ◭ ◮ Back CloseFull Screen / Esc
Printer-friendly Version Interactive Discussion
EGU
Table 2. Summary statistics for the Grotto drip site discharge data (assuming a drip volume
of 0.17 cm3, as in the study of Baker et al., 1997). A coefficient of variation of <50% defines seepage flow, whereas >50% is referred to a seasonal drip (Baker et al., 1997). Summary
statistics are based upon all discharge data collected including previous unpublished data of A. Baker (1997–2000). Note drip site S15 was monitored by A. Baker but was discontinued during this study. Conductivity data is only from the current study.
Drip Mean Coefficient Minimum Maximum Number of Mean Number of
site (stdeviation) of discharge discharge observations (standard observations
discharge variation (µl/s) (µl/s) deviation) of
(µl/s) (CVQ) electro-conductivity, µS/cm S1 36.9 (23.6) 64 1.6 90.9 11 502 (24) 9 S2 0.9 (0.8) 93 0.2 3.2 17 477 (14) 6 S3 0.4 (0.1) 34 0.1 0.6 17 456 (7) 9 S4 0.046 (0.1) 144 0 0.2 9 S5 0.7 (0.2) 29 0.4 1.1 15 463 (4) 7 S6 0.1 (0.1) 45 0.1 0.3 16 450 (13) 6 S7 0.4 (0.1) 14 0.3 0.6 18 454 (9) 8 S8 0.1 (0.1) 51 0 0.2 11 434 (29) 3 S12 16.4 (17.5) 107 0.5 56.0 22 483 (26) 9 S13 3.7 (6.5) 175 0.1 20.0 20 430 (25) 8 S15 5.0 (5.3) 106 0.1 12.5 14 SU96-7 0.051 (0.0) 6 0.05 0.06 8 469 (25) 3 SU03-1 0.3 (0.1) 23 0.2 0.4 10 537 (29) 9 SU03-2 0.5 (0.3) 56 0.1 0.8 10 547 (28) 7
HESSD
5, 547–577, 2008 Isotope hydrology of cave dripwaters L. Fuller et al. Title Page Abstract Introduction Conclusions References Tables Figures ◭ ◮ ◭ ◮ Back CloseFull Screen / Esc
Printer-friendly Version Interactive Discussion
EGU
Table 3. Summary statistics for theδ18O of Cnoc nan Uamh cave drip sites and pool waters through the monitoring period (December 2003–November 2005).
Drip site Mean StDev Min Max Range Number of
observations S1 −6.90 0.38 −7.17 −5.99 1.18 9 S2 −7.27 0.12 −7.41 −7.05 0.36 6 S3 −7.18 0.15 −7.38 −6.90 0.48 9 S4 −6.89 0.38 −7.34 −6.25 1.09 7 S5 −6.92 0.40 −7.23 −6.04 1.19 8 S6 −7.22 0.15 −7.41 −6.92 0.49 9 S7 −7.21 0.22 −7.47 −6.75 0.72 9 S8 −7.13 0.18 −7.34 −6.79 0.54 9 S12 −6.97 0.27 −7.22 −6.45 0.77 9 S13 −7.00 0.27 −7.22 −6.45 0.77 8 SU96-7 −7.07 0.36 −7.63 −6.47 1.17 8 SU031 −7.07 0.27 −7.46 −6.63 0.83 9 SU03-2 −7.30 0.20 −7.66 −7.11 0.56 7 Cave Pool −7.15 0.29 −7.39 −6.54 0.85 7
HESSD
5, 547–577, 2008 Isotope hydrology of cave dripwaters L. Fuller et al. Title Page Abstract Introduction Conclusions References Tables Figures ◭ ◮ ◭ ◮ Back CloseFull Screen / Esc
Printer-friendly Version Interactive Discussion
EGU
Table 4. Summary 12-month temperature logging data (2004–2005).
Monitoring location Mean Min Max Range
Grotto 7.2 4.8 9.5 4.7
HESSD
5, 547–577, 2008 Isotope hydrology of cave dripwaters L. Fuller et al. Title Page Abstract Introduction Conclusions References Tables Figures ◭ ◮ ◭ ◮ Back CloseFull Screen / Esc
Printer-friendly Version Interactive Discussion
EGU
Table 5. Predicted δ18O values for calcite (δ18Oc) on the V-PDB scale from measured temperature and water isotope composition (δ18Ow) on the V-SMOW scale, calculated from the work of Kim & O’Neil (1997). The oxygen isotope fractionation factor (α) between
cal-cite and water was experimentally determined by these authors to be=18.03∗(103/T )−32.42 where T is temperature in Kelvin. Calcite composition on the V-PDB scale is given by 0.97002∗(α∗(1000+δ18Ow)−1000)−29.98.
waterδ18O (‰)
Min (−7.66) Mean (−7.09) Max (−5.99)
Temperature (◦C)
Min (4.8) −5.6 −5.1 −4.0
Mean (7.2) −6.2 −5.6 −4.5
HESSD
5, 547–577, 2008 Isotope hydrology of cave dripwaters L. Fuller et al. Title Page Abstract Introduction Conclusions References Tables Figures ◭ ◮ ◭ ◮ Back CloseFull Screen / Esc
Printer-friendly Version Interactive Discussion
EGU
Table 6. Actualδ18Oc values of the top 1 mm and 0.5 mm of stalagmites SU96-7 and SU03-2.
SU96-7 SU03-2
(1mm) (0.5mm) (1mm) (0.5mm)
Mean −5.1 −5.1 −5.3 −5.3
Min −5.6 −5.4 −5.5 −5.5
HESSD
5, 547–577, 2008 Isotope hydrology of cave dripwaters L. Fuller et al. Title Page Abstract Introduction Conclusions References Tables Figures ◭ ◮ ◭ ◮ Back CloseFull Screen / Esc
Printer-friendly Version Interactive Discussion EGU (a) Study Location Stornoway Altnabreac Valentia Wallingford London Edinburgh REPUBLIC OF IRELAND ENGLAND & WALES SCOTLAND (b) Quinag (809m) Inchnadamph UAT Cave
Ben More Assynt (998m) Canisp (847m) Suilven (731m) Cul Mor (849m) Knockanrock Ullapool N 10 km
Fig. 1. (a) Location of Assynt study area and other significant geographic and monitoring
locations within the British Isles. (b) The Assynt area of NW Scotland and the location of the Tartair (UAT) cave system.
HESSD
5, 547–577, 2008 Isotope hydrology of cave dripwaters L. Fuller et al. Title Page Abstract Introduction Conclusions References Tables Figures ◭ ◮ ◭ ◮ Back CloseFull Screen / Esc
Printer-friendly Version Interactive Discussion EGU 350 300 250 200 150 100 50 0 Precipit
ation & Soil Moisture Budget (mm)
T emperature ( o C) 16 14 12 10 8 6 4 2 0 Nov 03 Dec 03 Jan 04 Feb 04 Mar 04 Apr 04 May 04 Jun 04 Jul 04 Aug 04 Sep 04 Oct 04 Nov 04 Dec 04 Jan 05 Feb 05 Mar 05 Apr 05 May 05 Jun 05 Jul 05 Aug 05 Sep 05 Oct 05 Nov 05 Dec 05
Fig. 2. Chart summarising calculations of monthly precipitation (bars) and monthly mean
HESSD
5, 547–577, 2008 Isotope hydrology of cave dripwaters L. Fuller et al. Title Page Abstract Introduction Conclusions References Tables Figures ◭ ◮ ◭ ◮ Back CloseFull Screen / Esc
Printer-friendly Version Interactive Discussion EGU δ δ y = 7.05x - 4.00 r = 0.97 P = <0.0001 Annual amount weighted mean
Study site
Global Meteoric Water Line (GMWL) Altnabreac
Trendline of data from study site
0 -10 -20 -30 -40 -50 -60 -70 -80 -90 -100 -14 -12 -10 -8 -6 -4 -2 d18O(o/oo) d 2H( o/oo )
Fig. 3. Relationship betweenδ18O andδ2H in monthly precipitation samples collected at the study site (stars). Data for Altnabreac (open circles) and the Global Meteoric Water Line (black line) are also shown for reference. The black triangle shows the annual amount weighted value for the first monitoring year (2003–2004).
HESSD
5, 547–577, 2008 Isotope hydrology of cave dripwaters L. Fuller et al. Title Page Abstract Introduction Conclusions References Tables Figures ◭ ◮ ◭ ◮ Back CloseFull Screen / Esc
Printer-friendly Version Interactive Discussion EGU 300 200 100 0 -100 Soil moisture excess/deficit (b) 300 250 200 150 100 50 Precipitation (a) -6.0 -6.2 -6.4 -6.6 -6.8 -7.0 -7.2 -7.4 -7.6 18 0 (permil) Error = 0.06 permil S1 S7 SU031 S4 S2 S8 SU032 S5 S13 S6 SU967 S12 CP1 S3
UAT Cave Drip Waters Inchnadamph Precipitation -4 -5 -6 -7 -8 -9 -10 d 18 O ( o/ oo ) Error = 0.06 permil Moisture Excess/Deficit (mm) Precipit ation (mm) (c) (d) 2003 2004 2005 2003 2004 2005 2003 2004 2005
Fig. 4. Hydrological conditions and dripwaterδ18O values during the monitoring period. (a) and (b) are respectively monthly precipitation and soil moisture budget calculated using Thorn-thwaite equation (1948), (c)δ18O of individual drip water sites, (d) mean dripwater values (plus range indicated by dashed lines) in comparison with bulk monthly precipitation values.
HESSD
5, 547–577, 2008 Isotope hydrology of cave dripwaters L. Fuller et al. Title Page Abstract Introduction Conclusions References Tables Figures ◭ ◮ ◭ ◮ Back CloseFull Screen / Esc
Printer-friendly Version Interactive Discussion EGU 0.8 0.6 0.4 0.2 0.0 -0.2 (a) (b) 0.6 0.4 0.2 0.0 -0.2 -0.4 -0.6 -0.8 -1.0 r-value r-value Temperature
12 month moving correlation 1982-2002 mean r-value (0.53)
12 month moving correlation 1982-2002 mean r-value (-0.47)
Precipitation
1983 1985 1987 1989 1991 1993 1995 1997 1999 2001
Period 1 Period 2
Fig. 5. Moving correlation through the continuous 20-year (AD 1982–2002) IAEA-GNIP Wallingford (Central England) data (a) shows 12-month moving correlation betweenδ18Oppt and temperature (b) shows 12-month moving correlation betweenδ18Opptand monthly precip-itation totals.
HESSD
5, 547–577, 2008 Isotope hydrology of cave dripwaters L. Fuller et al. Title Page Abstract Introduction Conclusions References Tables Figures ◭ ◮ ◭ ◮ Back CloseFull Screen / Esc
Printer-friendly Version Interactive Discussion EGU -3 1900 1880 1920 1940 1960 1980 2000 -4 -5 -6 -7 -8 Year AD Two sigma error bounds
Inchnadamph (annual climate data)
Inchnadamph (decadally smoothed climate data) Run C (Stalagmite data)
Valentia (decadally smoothed climate data) Calibrations drived from:
d
18O predicted calcite ( o/
oo
)
Fig. 6. Plot showing the predicted or hindcastδ18Oc values of Tartair stalagmites using cali-brations derived from both the 2-year study site monitoring data (solid lines) and also using the longer-term data recorded at the IAEA-GNIP Valentia site (dashed lines). Actualδ18Oc of a Tartair stalagmite (SU96-7) is also shown (thick black line).