HAL Id: hal-00264795
https://hal.archives-ouvertes.fr/hal-00264795
Submitted on 21 May 2012
HAL is a multi-disciplinary open access
archive for the deposit and dissemination of
sci-entific research documents, whether they are
pub-lished or not. The documents may come from
teaching and research institutions in France or
abroad, or from public or private research centers.
L’archive ouverte pluridisciplinaire HAL, est
destinée au dépôt et à la diffusion de documents
scientifiques de niveau recherche, publiés ou non,
émanant des établissements d’enseignement et de
recherche français ou étrangers, des laboratoires
publics ou privés.
On-chip thermal calibration with 8 CB liquid crystal of
micro-thermal device
Frédéric Gillot, Hideyuki F. Arata, Régis Guégan, Fabrice O. Morin, Hajime
Tanaka, Hiroyuki Fujita
To cite this version:
Frédéric Gillot, Hideyuki F. Arata, Régis Guégan, Fabrice O. Morin, Hajime Tanaka, et al.. On-chip
thermal calibration with 8 CB liquid crystal of micro-thermal device. Lab on a Chip, Royal Society
of Chemistry, 2007, 7, pp.1600. �10.1039/b709317a�. �hal-00264795�
On chip thermal calibration with 8CB liquid crystal of micro-thermal
device for biological applications.
Frederic Gillot,*
a,bHideyuki F. Arata,
aRégis Guégan,
aFabrice O. Morin,
a,bHajime Tanaka
aand
Hiroyuki Fujita
aReceipt/Acceptance Data [DO NOT ALTER/DELETE THIS TEXT]
5
Publication data [DO NOT ALTER/DELETE THIS TEXT]
DOI: 10.1039/b000000x [DO NOT ALTER/DELETE THIS TEXT]
A micro sensor integrated on a micro-thermal device for bio-experiments requires affordable, rapid and accurate thermal calibration. However, there has been no way to make thermal
10
calibration directly under the microscope. This was the limitations in making numbers of bioexperiments with micro thermal devices. We present in this paper an inexpensive, fast and accurate way to realise such thermal calibration directly under the microscope. We used a thermotropic liquid crystal: the
15
4-n-octyl-4-cyanobiphenyl(8CB) in order to reach the 313 K isothermal phase change on the device. Coupled with FEA simulations, we proved that this method enables us to make easy and accurate thermal calibration of micro-thermal device for biological application.
20
Rapid switching and measurement of the temperature in a liquid are of paramount importance for real time observation of activities of biomolecules such as protein folding-unfolding or enzymatic
reactions.1, 2 This rapid switching must be achieved under the
microscope. Controlling the temperature of small liquid volume is
25
the most promissing method. Due to the small heat energy required
for the temperature control, this realises fast response speed3 and
avoids the defocusing problem in conventional bulk heating device1.
There are several methods to achieve this, such as heating a small
30
liquid volume with a laser beam.4 However, this may damage the
observing biomaterials and a laser itself cannot be integrated on the microchip. The most convenient and widely applicable way is to fabricate a heater and a thermosensor on a glass plate at a
microscopic scale. 1, 5, 6 For those thermosensors on a microchip,
35
rapid and accurate thermal calibration is inevitable. The conventional way for such calibration consists in immersing whole chip into hot water or an oven, however, these methods are time consuming and often endanger the electric circuit.
40
Recently, calibration using light emiting particles such as
Rhodamine B has been reported.4, 7 However, this method is not
enough accurate due to photo bleaching. Scanning thermal
microscopie (SThM) offers a very accurate calibration means.8, 9 It
consists of an AFM used as a platform with a temperature sensing
45
probe, most of the time a very small thermocouple. Unfortunately, this kind of measure is not already fully and easly available and is difficult to achieve. The use of a IR camera presents the advantage
of being indirect measurement.10 Hence, the microthermal device
does not need to be modified or combined with other equipments.
50
Nevertheless, it can measure the thermal map only at the surface of the device and only works without water. Therefore, it doesn’t match the requirements for biological experiments. Some other ways to calibrate micro thermo device can be used, such as
transient thermo-reflectance.11 This can be realised considering that
55
the surface reflectivity of the heater, for exemple, is linearly proportional to the change in its surface temperature within a wide but finite temperature range. This calibration requires expensive and very fast equipments.
60
Therefore, a reliable and affordable method for calibrating a thermosensor on a chip under the microscope is required. However, this kind of calibration method has not been established yet due to the difficulty to measure the temperature in small area on a microdevice.
65
We propose a method using 8CB liquid crystal that we can use directly under a microscope without any modification of the microthermal device. We also demonstrate this method on a microthermal device which we have manufactured for biological
70
applications. This calibration process can be extended to other onchip micro thermal sensors.
Liquid crystal
The use of liquid crystal for nondestructive testing has been
referenced at early stage.12 Previous researches have mainly used
75
liquid crystal properties for real time temperature measurment of
electronics device, using a camera with image processing.13
For the thermal calibration process, we have chosen to use a thermotropic liquid crystal: the 4-n-octyl-4-cyanobiphenyl (8CB,
80
Fig. 1). The phases sequence of bulk 8CB on increasing temperature is crystal (X), smectic A (SmAd), nematic (N) and isotropic (I) with the following transition temperatures:
TXSmA=294.5 K, TNSmA=306.3 K and TNI=313 K(Fig. 1).
85
A recent calorimetry study led at several thermal rate and by the use of various kind of calorimeters (differential scanning calorimetry and modulation calorimetry) has shown the nature of
the order of the 8CB phase transitions. 14 The first transition
X-a LIMMS, University of Tokyo, 4-6-1 Komaba, Meguro-ku, Tokyo,
153-5805, Japan. Fax: 81-3-5452-6088; Tel: 81-3-5452-6036; E-mail: [email protected]
b Institute of Industrial Science, University of Tokyo, 4-6-1 Komaba,
Me-guro-ku, Tokyo, 153-5805, Japan. Fax: 5452-6250; Tel: +81-3-5452-6249;
† Electronic Supplementary Information (ESI) available: [details of any supplementary information available should be included here]. See http://dx.doi.org/10.1039/b000000x/
2 | [journal], [year], [vol], 00–00 This journal is © The Royal Society of Chemistry [year]
SmA is first order with a strong enthalpy of transition. The second
90
order SmA-N transition is characterized by a weak enthalpy of transition and presents the following character. In presence of disorder or impurities which can be present in various real materials (porous materials, dispersion of aerosils) this transition is suppressed and is replaced by the gradual occurrence of short range
95
smectic phase15, 16.The N-I transition has been recognized to be
pure first order transition. 14 The enthalpy of transition is weak and
can easily be understood. Indeed, the Nematic phase is identified by a microscopic orientation of the molecules along one direction which defined an orientational order parameter. The reorganization
100
of the molecules is rather weak because only one order is lost, by heating to the isotropic phase and involves a small difference of free energy between the two phases.
Within the framework of micro thermal calibration, we focus on
105
this last N-I transition which shows keys points. The Nematic phase transits at the isothermal temperature of 313 K which is close to the room temperature, and the transition can be remarkably identified by the use of microscopy techniques (conventional and polarized microscopy) due to the change of textures between the two phases.
110
Fig. 1 8CB representation and its differents phase transition
temperature (X is the crystaline, SmAd the smectic phase, N the
nematic phase and I the isotropic phase)
Indeed, in a planar cell, the modification of the textures between the
115
two phases is completely different. Without any specific anchoring selected, the Nematic phase presents some domains where it is observed some birefringence (black and white domains under polarized microscope) with texture organized around point disclinations, disclination lines and inversion walls. On the other
120
hand, the isotropic phase at higher temperatures appears then on dark under polarized light, as it can be oberved for the case of a simple liquid.
Proposed micro thermal device
We have manufactured a micro thermal device for biological
125
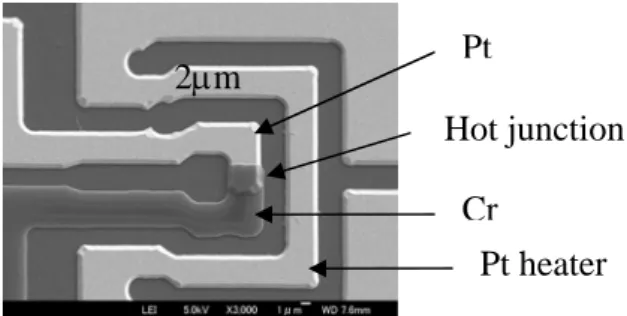
applications to demonstrate the proposed calibration method (Fig. 2). This device consist in a micro heater and a thermal sensor, both manufactured on quartz wafer. The micro heater is a 2 μm wide platinum micro wire. The thermal sensor is a Pt-Cr thin film thermo
couple (TFTC) with a hot junction area of 2.5x2.5 μm2
.17
130
The device manufacturing process consists of sputtering, lithographic and reactive ion etching (RIE). First titanium-platinum-SiO2 layers are sputtered on the wafer. The titanium layer is used as an adhesive layer for the platinum. The platinum layer
135
was patterned by RIE with a S18-05 photo resist mask. When platinum patterns are ready, chromium and SiO2 layers are
sputtered and once again lithographic and RIE processes are used to obtain the chromium patterns. At the end, a 100 nm thick layer of SiO2 is sputtered to provide electrical insulation between the
140
heater and the TFTC when used during biological experiments.
Fig. 2 SEM picture of the micro thermal device. Platinum heater and half thermo couple appear in white, chromium half thermo couple in dark.
Simulations of temperature distribution
145We have simulated the thermal device behavior in steady state using finite elements analysis (FemLab 3.1). Due to consideration of symetry, we have simulated half our device. Moreover, we have omitted the SiO2 insulation layer on top of TFTC and heater due to its thickness (100nm). We have used planar elements to represent
150
the heater and TFTC (thickness of 200 nm negligible) and considered that the device is initially at 297 K.
We have considered a 1μm thick layer of 8CB trapped between the device and a cover glass, as it will be realize for experiments.
155
For a given input voltage, the heater provides a given amount of heat generated by Joule effect. Heat diffusion is then simulated considering the heat equation for all meshes. As the observation time length is in minutes (observation of the steady state), we have
160
taken into account convection heating in the bulk 8CB. Finally, because of the low temperature range in the device, the radiations losses were considered negligible. Material thermal caracteristics used for simulations are given as follows in Tab. 1.
2μm
Pt heater
Cr
Hot junction
Pt
We have considered only the I phase of the liquid crystal for
165
simulation as it will be the relevant phase for the calibration and to avoid multi-phases simulations.
Table 1 Material thermal characteristics used for simulations. 8CB
properties are considered in Isotropic phase. 18
Material ρ, kg.m-3 Cp, J.(kg.K)-1 λ, W.(m.K)-1
Platinum 21450 133 71.6
Quartz 2203 703 1.38
8CB Iso. 870 2200 1.55
170
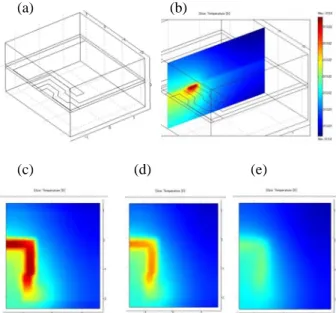
The temperature distribution is shown In Fig. 3. The nematic to isotropic change will occur at 313 K. For a small volume of Isotropic phase, simulations have shown a very low temperature variation inside the isotropic phase, i.e. it will be possible to consider that the temperature on the TFTC will be 313 K.
175
Fig. 3 Simulations results for the half device. (a) : Device in 3D, (b) : temperature distribution in a vertical plan containing the TFTC hot junction and a section of the heater. (c) : temperature distribution in an horizontal plan in the 8CB at 0.1μm, (d) 0.5μm
180
and (e) 0.9μm above the heater and TFTC.
Calibration methodology
We observe in real time 8CB liquid crystal Nematic – Isotropic phase transition which occurs at 313 K. As it is a first order transition, the thermal sensor output recorded when the phase
185
transition is located on it corresponds to a measured temperature of 313 K. Room temperature corresponds to null output. Considering the Pt-Cr thermo-couple linear behavior within 275 K - 375 K range, we can then obtain the thermo-couple calibration curve.
Experimental set up
190We observed our micro-thermal device with a BX 51 Olympus microscope fitted with a Nikon Coolpix 4500 digital camera with two adapters (Olympus C-DMA3 and Nikon CMD).
Polybeads of 1.0 µm in diameter (Polybead®carboxylate:
195
Polyscience, Inc. ) was mixed with liquid crystal (8CB, Wako supplier, ref. 320-23511) to act as spaces. The polybeads were washed 3 times by water to substitute stock buffer (Benzene, ethenyl-, homopolymer) to pure water; 10 µL from the stock were diluted 10 times and collected by centrifugator (10000 rpm, 5 min)
200
for each wash. After the final collection, beads were sustained in a 200 µL water. 1 µL of this beads contained water and 4 µL of 8CB were mixed at 313 K, then heated at 320 K to be easly manipulated and poured onto the thermodevice.
205
Liquid crystals were poured onto the microthermal device and a glass slide was placed on top of the droplet of liquid crystals so as to facilitate observation and delay evaporation. This also realise the same conditions during bioexperiments. We used a 20X objective (CF Plan: Nikon) for observation under both brightfield conditions
210
(reflected light) and polarized (transmitted) light.
We applied different heating voltage and observed the position of the isotherm. At the same time, we recorded the output current waveform of the micro TFTC coupled with a 471Ω CMS resistor
215
through a Keithley 428 current amplifier.
Results
The picture (a) in Fig. 4 shows the device at room temperature, i.e. at 297 K. At this temperature the liquid crystal is in Smectic phase. The device didn’t receive any chemical treatment for selecting any
220
preferential anchoring of the molecules. In this condition, it is well known that the smectic texture shows more or less regular arrays of lines under cross polarized microscopy. Another interesting point which can be underlined is the presence of the formation of smectic domains in droplet called also focal conic domains, cf. (d)
225
in Fig. 4. Details of these focal conic domains are represented in the picture (e) Fig. 4. The droplets show faceted structure due to the anisotropic surface tension of the Smectic A phase. In the Smectic A phase, this faceting is provided by the so called focal conic domains in the form of cones of revolution.
230
Fig. 4 Pictures taken by a BX 51 Olympus (20x and cross polarizers). Heater with (a) no input voltage, (b) 0.8V and (c) 1.2V. Smectic phase appears as gray (d, e), Nematic (f) as bright and Isotropic as dark (central dot in (c)).
235
(a) (b)
(c) (d) (e)
(a)
(b) (c)
4 | [journal], [year], [vol], 00–00 This journal is © The Royal Society of Chemistry [year]
The picture (b) in Fig. 4 shows the device under an applied voltage of 0.8 V. The situation is sensibly different. One can distinguish an obvisous modication of both texture and turbidity of the liquid crystal close and up to the hot junction area. This area appears
240
brighter than both Smectic A domains of the picture (a) in Fig. 4 but presents birefringence and a picture taken at higher magnification probes the existence of the 8CB Nematic phase (cf. (f) in Fig. 4) with the presence of point defects in the structure. The Nematic phase is separated of the Smectic phase by a large band of
245
severalmicrometers (bright domain in (b), Fig. 4).
The picture (c) in Fig. 4 confirms the simulation presented in the Fig. 3 when a voltage of 1.2 V is applied. Under cross polarizers, one can observed a black circle which covers the totality of the
250
microthermal heater. This phase which appears in black doesn’t present by consequently any birefringence and can be identified as the Isotropic phase of the 8CB. The existence separation between the Nematic to the Isotropic phase can be easily distinguished by the differences of both birefringence and texture of the two phases.
255
We have to notice again the advantage of this first order transition for the thermal calibration of the device since the differentiation between the Nematic and Isotropic phases is more evident than the SmA-N transition. Under such voltage of 1.2 V, the separation line between the Nematic to the Smectic phases moves. Numerous focal
260
conic domains of the Smectic phase present in the figure 4b melt into the Nematic phase which is preponderant in this last case. Then, by ramping the voltage by step of 0.1V, we recorded the TFTC output voltage as well as pictures from the microscope. The
265
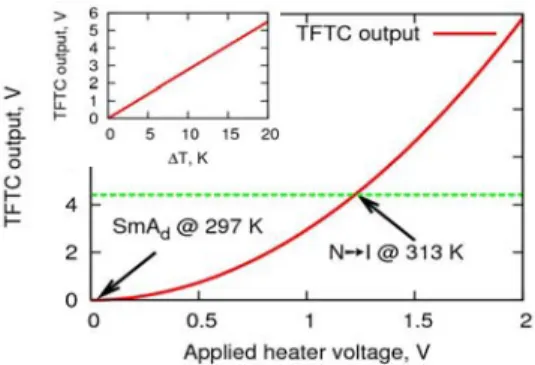
TFTC output as a function of the heater voltage input is illustrated in Fig. 5.
Fig. 5 TFTC output as a function of the applied heater voltage. Applied voltage step is 0.1V. The TFTC output under this heasting
270
voltage is 4.41V. In insert : TFTC output as a function of temperature difference between its hot and cold junction, ΔT. It is then possible to consider that the TFTC is calibrated and will
delivered, after amplification, 4.41/16≈27.5 10-2
V.K-1. After
275
ethanol washing using a cotton bud, the micro-thermal device is directly operational and can be used for biological applications without observation, control and acquisition set-up modification.
Conclusion
We have proposed and demonstrated a fast, easy and affordable
280
process for steady state thermal calibration of micro thermo device directly under the microscope. Our proposed method emphasizes on the use of 8CB crystal which has proved to be an inexpensive, accurate and robust way to obtain isotherms. Our method doesn’t
require any design modification of the microthermodevice, just to
285
pour a droplet of liquid crystal on the device as we do for samples in bioexperiments. We have demonstrated its feasibility on a micro-thermal device equiped with a Pt-Cr thin film thermo-couple. The results indicates the feasibility of this method to general microfabricated thermal device.
290
Aknowledgements
This work was supported by the Japan Society for Promotion of Science. Device manufacturing was carried out at the VDEC center.
Notes and references
295† Footnotes should appear here. These might include comments relevant to but not central to the matter under discussion, limited experimental and spectral data, and crystallographic data.
1. H. F. Arata, H. Noji and H. Fujita, Applied Physics Letters, 2006, 88,
300
083902-083903.
2. H. F. Arata, Y. Rondelez, H. Noji and H. Fujita, Anal. Chem., 2005,
77, 4810-4814.
3. K. Sato, A. Hibara, M. Tokeshi, H. Hisamoto and T. Kitamori,
Advanced Drug Delivery Reviews, 2003, 55, 379-391.
305
4. M. N. Slyadnev, Y. Tanaka, M. Tokeshi and T. Kitamori, Anal.
Chem., 2001, 73, 4037-4044.
5. T. Yamamoto, T. Nojima and T. Fujii, Lab on a Chip, 2002, 2, 197-202.
6. G. Mihajlovic, N. M. Brunet, J. Trbovic, P. Xiong, S. von Molnar
310
and P. B. Chase, Applied Physics Letters, 2004, 85, 1060-1062. 7. H. F. Arata, P. Low, K. Ishizuka, C. Bergaud, B. Kim, H. Noji and H.
Fujita, Sensors and Actuators B-Chemical, 2006, 117, 339-345. 8. L. Shi and A. Majumdar, Journal of Heat Transfer-Transactions of
the Asme, 2002, 124, 329-337.
315
9. A. Majumdar, J. Lai, M. Chandrachood, O. Nakabeppu, Y. Wu and Z. Shi, Review of Scientific Instruments, 1995, 66, 3584-3592. 10. L. Shi and A. Majumdar, Microscale Thermophysical Engineering,
2001, 5, 251-265.
11. C. A. Paddock and G. L. Eesley, Journal of Applied Physics, 1986,
320
60, 285-290.
12. J. L. Fergason, Applied Optics, 1968, 7, 1729-1737.
13. A. Csendes, V. Szekely and M. Rencz, Microelectronic Engineering, 1996, 31, 281-290.
14. D. Sharma, J. C. MacDonald and G. S. Iannacchione, J. Phys. Chem.
325
B, 2006, 110, 16679-16684.
15. T. Bellini, L. Radzihovsky, J. Toner and N. A. Clark, Science, 2001,
294, 1074-1079.
16. R. Guegan, D. Morineau, C. Loverdo, W. Beziel and M. Guendouz,
Physical Review E (Statistical, Nonlinear, and Soft Matter
330
Physics), 2006, 73, 011707-011706.
17. F. Gillot, H. F. Arata, F. O. Morin, D. Collard and H. Fujita, in
TRANSUCERS'07, Lyon, France, 2007.
18. M. Marinelli, F. Mercuri, S. Foglietta, U. Zammit and F. Scudieri,
Physical Review E, 1996, 54, 1604.