HAL Id: hal-01389712
https://hal.univ-reunion.fr/hal-01389712
Submitted on 29 Oct 2016
HAL is a multi-disciplinary open access archive for the deposit and dissemination of sci-entific research documents, whether they are pub-lished or not. The documents may come from teaching and research institutions in France or abroad, or from public or private research centers.
L’archive ouverte pluridisciplinaire HAL, est destinée au dépôt et à la diffusion de documents scientifiques de niveau recherche, publiés ou non, émanant des établissements d’enseignement et de recherche français ou étrangers, des laboratoires publics ou privés.
Seismic anisotropy and shear-wave splitting in
lower-crustal and upper-mantle rocks from the Ivrea
Zone : experimental and calculated data
Guilhem Barruol, Hartmut Kern
To cite this version:
Guilhem Barruol, Hartmut Kern. Seismic anisotropy and shear-wave splitting in lower-crustal and upper-mantle rocks from the Ivrea Zone : experimental and calculated data. Physics of the Earth and Planetary Interiors, Elsevier, 1996, 95, pp.175 - 194. �10.1016/0031-9201(95)03124-3�. �hal-01389712�
Seismic anisotropy and shear-wave splitting in lower-crustal and
upper-mantle rocks from the Ivrea Zone-experimental and
calculated data
Guilhem Barruol
a,* ,Hartmut Kem
b' Lahoratoire de Tectonophysique, URA CNRS 1764. Université Montpellier Il, 34095 Montpellier, France
b Mineralol(isch-Petrographisches Institut. 0/shausenstr. 40. D24098 Kiel. Germany Received 27 October 1994; accepted 31 August 1995
Abstract
To quantify the relationships between anisotropy. S-wave splitting and tectonics, we determined the seismic properties of lower-crustal and upper-mantle rocks outcropping in the lvrea Zone (Northem Italy). We obtained P- and S-wave seismic velocities by laboratory direct velocity measurements and/or by calculations based on the modal compositions of the rocks, the lattice preferred orientations (LPOs), and the single crystal stiffness coefficients. Measured P- and S-wave velocities (6.0-7 .5 km s - 1 and 3.6-4.2 km s - 1) are typical of the lower crust. The P-wave anisotropy is in the range 0- l 0%. Shear-wave birefringence is in the range 0.0-0.6 km s - 1, with typical values between 0.0 and 0.2 km s - 1• In many cases, the birefringence is clearly related to fabric elements (foliation, lineation). Mafic rocks such as anorthosite or pyroxene-bearing gabbros exhibit low P-wave anisotropies ( < 5%) and low shear-wave birefringences (less than 0.1 km s - 1 ). In contrast, the seismic properties of felsic rocks such as biotite-bearing gneisses and mafic rocks such as amphibolites display high V P anisotropy ( 10%) and strong birefringence (0.3 km s - 1 ). Biotite and amphibole preferred orientations clearly control seismic anisotropy and particularly shear-wave splitting. In these rocks, maximum splitting is observed in directions parallel to the foliation with the fast split shear wave polarized parallel to the foliation plane. To have an overview of the seismic properties of this lower-crustal section at a broader scale, we calculated from our data the anisotropie seismic properties of several hypothetical samples that are perhaps more representative of the regional anisotropy than each sample individually. For instance, the average lower-crustal sample displays an anisotropy of 5.5% for P waves and a birefringence around 0.14 km s I for S waves propagating parallel to the foliation. We observe little splitting for waves propagating at high angle
to the foliation.
1. Introduction
The Ivrea Zone, northem Italy, is considered to be one of the best examples of an exposed lower-crustal
· Corresponding author.
terrane. It provides a unique opportunity for geo physicists and petrophysicists to observe and study a large area (several tens of square kilometres) of rocks formed or metamorphosed at lower -crustal conditions. This zone has been studied by several workers as a potentially good example of layered lower crust (e.g. Hurich and Smithson, 1987;
Hol-liger and Levander, 1994). Fountain (1976) and Burke and Fountain (1990) made laboratory seismic measurements on Ivrea Zone rocks. In these studies, however, no birefringence measurements were made. Burlini and Fountain (1993) measured shear-wave splitting in Ivrea Zone samples, but their work was focused on mid-crustal metapelite of the 'Serie dei Laghi'. In this study, we concentrate on the shear wave velocities and particularly on birefringences of rocks from the westemmost part of the lvrea Zone, which represents the former, pre-tilting, lowermost level of the crust and possibly the uppermost mantle. The investigation of shear-wave splitting (SWS) in lower-crustal rocks is important for two closely related reasons. First, quantification of possible crùstal contributions to teleseismic SWS may lead to a more precise information of actual upper-mantle delay times and may therefore better constrain the location and magnitude of anisotropy in the Earth. Splitting of teleseismic S waves (SKS and SKKS waves, for instance) has been generally considered to occur in the upper mantle (e.g. Silver and Chan, 1991; Bormann et al., 1992), but particularly in continental regions, one cannot rule out that the crust may contribute to the total splitting. Second, SWS may be used to investigate the nature of the crust. Until now, most splitting measurements were per formed using either teleseismic sources and inter preted in terms of mantle flow, or using local, mid crustal seismicity and interpreted in term of upper crustal, microcrack-induced anisotropy related to up per-crustal stress states (e.g. Kaneshima et al., 1988; Peacock et al., 1988; Gledhill, 1991 ). Sorne recent seismic studies have nevertheless shown that it was possible to obtain an independent measurement of lower-crustal shear-wave splitting either by using P to S conversion at the Moho transition (McNamara and Owens, 1993) or by using wide-angle seismic reflection experiments to detect this phenomenon (Clement et al., 1994). In these two studies, a delay time in the range 0.1-0.2 s has been measured and attributed to lower-crustal anisotropy. Laboratory seismic measurements performed by Christensen ( 1966) have already shown that crustal rocks can be strongly anisotropie for shear waves. More recent petrophysical investigations indicate that there is generally a close relationship between the intrinsic anisotropy (generated by preferred crystal
orienta-tions), the birefringence, and the rock structure (foli ation and lineation). This relationship may yield information on the crustal structure from shear-wave splitting studies (Kem and Wenk, 1990; Kem et al., 1991; Barruol and Mainprice, 1993a). Thus, both petrophysical and seismological developments are pointing the way towards use of SWS as a tool to investigate crustal nature and structure. lt is therefore important to acquire new petrophysical data and particularly birefringence data on lower-crustal rocks. In this paper, after a brief description of the geologic setting of the study area, we characterize the seismic properties of selected lower-crustal-up per-mantle samples. We used two different ap proaches: ( 1) direct laboratory measurements of seis mic velocities on typical rocks from the lvrea lower-crustal section; (2) calculations of the com plete three-dimensional seismic properties of three samples based on the modal composition, the crystal lographic preferred orientation of major minerais and the single crystal elastic constants. Both methods (direct laboratory measurements and calculations) were applied on several samples. We compare results and analyse discrepancies in Section 5. ln Section 6, we attempt to characterize seismic properties at a more regional scale. Using the experimental data sets, we calculate average anisotropie seismic proper ties of hypothetical rocks that may be representative of the Ivrea lower crust. We finally discuss shear wave splitting in the lower crust in light of these new results.
2. Geological description
The Ivrea-Verbano Zone and the Serie dei Laghi are classically described as a crustal section through the lower crust of the Apulian plate which was uplifted and tilted during the alpine orogeny (e.g. Berckemer, 1968; Zingg et al., 1990). Generally, structures trend NE-SW (Fig. 1) and layering is steeply dipping. The Ivrea-Verbano Zone and the Serie dei Laghi are separated by vertical faults: the Pogallo line, which is interpreted as pre-tilting low angle fault (Hodges and Fountain, 1984; Handy, 1987), and the Cossato-Mergozzo-Brissago line (Boriani et al., 1990), whose nature remains unclear. Severa! high-temperature shear zones have been
rec-• Ultrnmafic rocks (pyroxenites, pcridotites)
1111
Gabbro, me1agabbro and amphibolitc.� • Gamet pyroxene gabbros (pyriclasitcs)D
Mctasedimcnts (stronalites and kinzigitcs) • Marblcs• Strona Ceneri Zone me!apelitcs
11ii
Pcrmian granitese Direct velocity mcasurcmcnls
o
Vclocity calculations (from LPO) 0 Vclocity obtained by calculationsand direct measurcmcnts
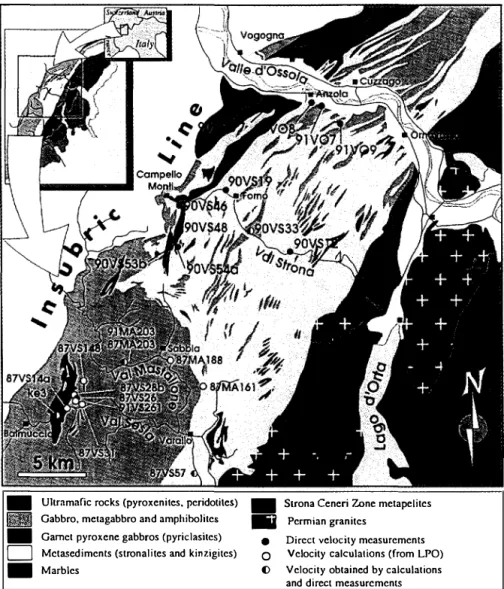
Fig. 1. Schematic map of the Ivrea Zone showing the various lithologie units (after Zingg, 1980; Bro<lie and Rutter, 1987). Sample locations and sample numbers are indicated.
e,
Sam pies used for the laboratory seismic measurements; 0, samples used for the velocity calculations; () . samp les for which both methods were applied.ognized in the exposed lowermost parts of the crust and interpreted as ductile normal faults that accom modated post-Hercynian crustal extension (Brodie and Rutter, 1987; Rutter et al., 1993). The regional metamorphism increases to the west from green schist to amphibolite facies in the Serie dei Laghi and from amphibolite to granulite facies in the Ivrea Zone (e.g. Si lis and Tarney, 1984). Our study
fo-cuses on the Ivrea-Verbano Zone, the lowermost level of this crustal section.
In the northem part of the study are a, in the V al Strona and Valle d'Ossola (Fig. 1), the outcropping section comprises mainly a metasedimentary se quence composed of metapelites (kinzigites and stronalites) and marbles, and metabasic rocks such as amphibolites and pyriclasites (gamet-bearing
7.2 7 .0 6.8 6.6 6.4 o. , ,D'
>
6.2 DI
6. 0 5.8 0 � 4.4 4.2î
4.0 � 3.8>
3.6 3.4 -0--0-0--Clz
..o--o--0-.o-.0- ----o----Yp-Z (Km/s) ... + ... Yp-Y (Km/s) -- ---6- - - - Yp-X(Km/s) V p average (Km/s) 8 0 0 0 0 0 0 0 0 N M sr"' ""
Vsxz (Km/s) ---0- Vsyz (Km/s) Vsxy (Km/s) ---0- Vszy (Km/s) Ysyx (Km/s) Vszx (Km/s)...
-...
0 0 0 08
0 0s
0 0 0 0 N"'
sr"' ""
0.5 ,;;; 0.4- Xl
0.3- �e=o-0--0--a--a-a-o,cô-�Ô'=Ô'�o Y � ... ,0 ... Ys(xz-yz) (Km/s) "' 0.2- D - ---{J- -- - Ys(xy-zy) (Km/s) ao.1- ---6--- Vs(yx-zx) (Km/s) 0 2 0 0 ... o .. --o .. -0---o--·0 ... 0 .. -0 ... 0 ... -0 ci'i-0.1- é?o ...z
-0.2 1 1 1 1 1 0 0s
0 0 0 0 0 0 0 0 0 0 N"'
sr v;""
Pressure (MPa) *'·'·'·'·*·'·'·'·'·*·'·'·'·'·"'·'·'·'·'·*- --- -4:.:.:.:-:$ • • • 1 1 • -� 0----o---O---D---0---0---D 1 1 1 1 1 1 0 0 0 0 0 0 0 0 0s
0 0 0 0 0 r-- N"'
sr"' ""
r=t=::=1-it:
•
�87=8
�§ §
q
0 0 0 08
8 8 0 0s
0 0 r-- N"'
sr V-.""
Ô"==à====t'F= ---8='---
�:e----
:tl=====l:l
0 ... 0 ... --0 ... 0 ... o ... o ... --0 1 1 1 1 1 1 0 0 0 0 0 8 0 0 0s
0 0 0 0 ,.... N"'
sr V"l""
Temperature (°C) 7.2 - 7.0 - 6.8 - 6.6 - 6.4 - 6.2 - 6.0a
5.8 0 0 r--4.4 4.2 4.0 3.8 3.6b
3.4 8 r--0.5-
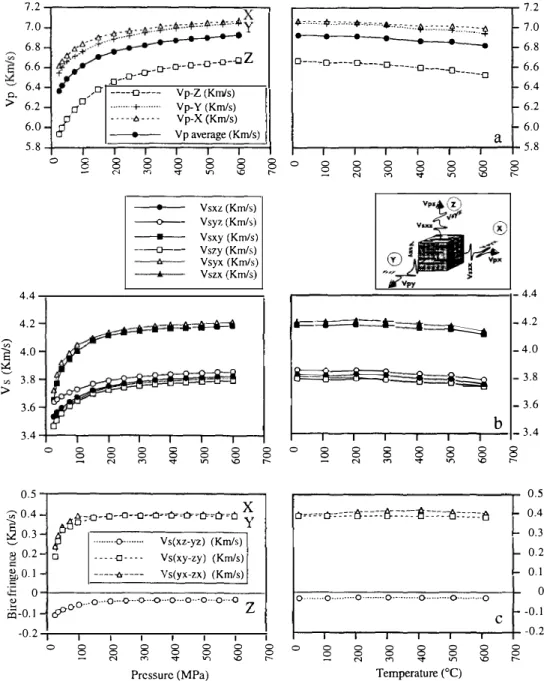
0.4 ,... 0.3 0.2 ,... 0.1 0 C - -0.1 -0.2 0 0r--Fig. 2. Effect of pressure (at room temperature) and of temperature (at 600MPa) on P- and S-wave velocities, for the amphibolite 90VS33. This rock is composed of hornblende (60%) and plagioclase (40%). The three P-wave velocities measured along the three structural directions ( x, lineation; y and z, pole of the foliation) and the corresponding average velocity are plotted in (a). The six shear-wave
velocities are presented in (b). The shear-wave notation carries information about orientation and is similar to stress and strain notation (e.g. Nye, 1972): the first index indicates the direction ofparticle motion and the second the direction ofwave propagation (see the insert). Ys,,, for instance, is a shear wave propagating along the z structural axis and polarized parallel to the x axis. The birefringence along each direction is plotted in (cl. The measured P- and S-wave velocities display hexagonal symmetry: P waves propagate with nearly identical velocities along the x and y structural directions, whereas they propagate at a significantly lower velocity along the z axis. The birefringence is also high and constant for propagation directions parallel to the foliation, whereas it is very low for waves propagating at high angle to the foliation. This property is generally due to a high amphibole or phyllosilicate content. The velocity anisotropy and the birefringence are not significantly affected by pressure and temperature.
metagabbros). The petrography and metamorphism of these units have been extensively studied (e.g. Schmid, I 967; Zingg, I 980; Pin and Sills, I 986; Zingg et al., 1990). The whole section displays layering at a I O m to 100 m scale. Several ultramafic bodies outcropping in the western part of the zone are thought to represent upper-mantle slices now incorporated within this lower-crustal section.
In the southem part of the area, in the Val Mastal lone and the Val Sesia, a large vertically layered mafic body, 10 km thick, is exposed. This body is clearly intrusive into the metasedimentary sequence and displays clear magmatic microtextures (e.g. Quick et al., 1992). It is mainly composed of gab broic material differentiated to diorites towards the top of the intrusion. The basal zone, defined as the Lower Layered Group by Rivalenti et al. ( 1981), is located between the Balmuccia peridotite massif and the mafic intrusion. It is about I km thick and made up by a layering (up to 50 m) of mafic to ultramafic materials such as gamet-bearing metagabbros, pyrox enites, dunites, and also some lenses of metapelitic felsic rocks such as stronalites. These rocks display microstructural evidence to varying degree of plastic deformation under high metamorphic grade condi tions. Numerous rock samples were collected from surface outcrops throughout the area in order to
Table I
Modal composition of the studied samples
Sample Lithology 90VS12 Amphibolite 90VS19 Stronalite 90VS33 Felsic amphibolite 90VS46 Stronalite 90VS48 Granulitic gabbro 90VS53b Plagio pyroxenite
90VS54a Quartzitic stronalite
90VS77b Pyriclasite
91V07 Metagabbro
91V08 Stronalite
87VS57 Kinzigite
9IMA203 Magmatic gabbro
91VS261 Gamet gabbro
91V09 Stronalite
ke3 Lherzolite
per. 475 Peridotite
select samples with typical petrography, modal com position and microstructures for the laboratory mea surements.
3. Experimental measurements of seismic veloci ties
3.1. Experimental deuices
Laboratory seismic velocity measurements were made in a 'cubic' pressure apparatus using the pulse transmission technique. Cubic samples (43mm edge) were eut parallel to the main structural directions x,
y and z (see insert Fig. 2). The P- and S-wave
velocities were measured simultaneously along these three directions, first at increasing confining pressure (up to 600 MPa) at room temperature, and then at
increasing temperature (up to 600 or 700°C) at
600 MPa confining pressure. Splitting of shear waves is obtained for each direction of propagation by two sets of oriented transducers with perpendicular polar ization planes, and with the fast and the slow shear waves polarized parallel and normal to the main structural planes ( xy, yz and xz ). Each set of results is composed of nine velocities: three P-wave veloci ties and six S-wave velocities.
Modal composition
4.0 qz, 35.0 plagia, 59.0 hom, 1.0 ox 55.0 qz, 10.3 Kspar, 8 sill, 25.2 gar, 1.5 ox 35.8 plagia, 54.2 hom, 8 pyrox, 2.0 ox 35 qz, 55 felds, 10 pyrox
58 plagio, 23 pyrox, 19 hom 25.4 plagio, 68.5 pyrox. 4.5 spi, 1.6 ox 48.4 qz, 37.0 Kspar, 13.8 pyrox, 0.8 ox 47.0 plagio, 52 pyrox, 1 ox
54 hom, 34 plagia, 1 1 pyrox, 1 ox
42 qz, 28 plagia, 7 Kspar, 14 biot, 7 gar, 2 sill 45 biot, 22 Kspar, 20 qz, 8 sill, 5 gar 76 plagio, 19 pyrox + hom, 5 ox 30 plagio, 55 pyrox, 8 gar, 7 spi
35 qz, 23 Kspar, 17 plagio, 8 biot, 7 sill, 10 gar 75 ol, 16 opx, 6 cpx, 3 spi
80 ol, 12 opx, 3 cpx, 3 serp. 2 ox
qz, quartz; plagio, plagioclase: Kspar, K-feldspar; hom, hornblende; gar, gamet; sill, sillimanite; pyrox, pyroxene: cpx, clinopyroxenc; opx, orthopyroxene; biot, biotite; spi, spinel; ol, olivine; serp, serpentine; cr, chromite; ox, oxide.
Tabl e 2
P- and S-wave velocities, anisotropy ( A) , and S-wave birefringence along the three structural axes ( x, lin eation; pole of foliation) measured at 600 MPa for the 16 Ivrea-V erbano Zone samples
Samples Vp/ / X Vp/ /y Vp//z AVp Vs,, Vs,x Vs.,y Vs,y Vs,, Vsy, VS(,:- y:) Vs(.n-- ,y> VS(yx- :.,)
(km s-1) (kms 1> (kms-1) (%) (kms-1) (kms-1) (km s-1) (kms-1) (km s-1) (kms-1) (km s- 1) (kms· 1) (km s- 1) 90VS12 7.48 7.04 6.53 12.74 4.07 3.95 4.09 3.84 3.79 3.92 -0.128 0.250 0.120 90VS19 7.25 6.92 6.55 9.61 4.02 3.99 4.04 3.87 3.86 3.86 0.000 0.172 0.025 90VS33 7.06 7.04 6.66 5.69 4.21 3.81 4.19 3.79 3.82 3.86 -0.032 0.393 0.401 90VS46 6.13 6.03 6.13 1.75 3.83 3.88 3.87 3.83 3.84 3.79 0.057 0.023 -0.047 90VS48 6.86 6.78 6.89 1.74 3.81 3.82 3.82 3.81 3.79 3.78 0.016 0.009 -0.003 90VS53b 7.33 7.16 7.19 2.35 4.09 4.09 4.04 3.97 3.97 4.10 -0.123 0.0730 1.001 90VS54a 7.36 7.10 6.63 9.96 4.29 4.26 4.17 4.23 4.15 4.13 0.015 -0.060 0.028 90VS77 7.29 7.20 7.19 1.37 4.14 4.05 4.13 4.06 4.01 4.03 -0.020 0.074 0.093 91V07 7.47 7.05 7.02 6.24 4.10 4.11 4.08 3.96 3.92 4.10 -0.184 0.123 -0.014 91V08 6.94 6.71 6.58 5.29 3.99 4.00 4.08 3.94 4.01 4.00 0.002 0.140 -0.010 87VS57 6.71 6.49 5.72 15.57 4.09 3.48 4.11 3.47 3.52 3.49 0.028 0.640 0.615 91MA203 6.94 6.97 6.94 0.39 3.77 3.75 3.78 3.78 3.84 3.74 0.099 0.007 0.021 9IVS261 7.10 7.01 6.85 3.48 3.91 3.88 3.92 3.85 3.81 3.86 -0.057 0.069 0.024 91V09 6.41 6.22 5.89 8.42 3.75 3.59 3.84 3.71 3.54 3.72 -0.182 0.134 0.161 k e3 8.49 8.38 7.90 7.15 4.87 4.70 4.83 4.62 4.73 4.65 0.077 0.215 0.176 P er. 475 8.67 8.32 8.12 6.34 4.73 4.74 4.84 4.65 4.76 4.59 0.170 0.190 -0.001 Averages Metapelit es 6.85 6.62 6.23 9.38 3.99 3.76 4.04 3.75 3.73 3.79 -0.067 0.292 0.234 Transition 7.02 6.84 6.74 4.58 4.02 4.01 4.02 3.96 3.95 3.96 -0.008 0.062 0.012 Crust 7.02 6.84 6.63 5.55 4.01 3.90 4.01 3.87 3.85 3.88 -0.036 0.146 0.101 Mean sample 7.22 7.03 6.80 6.13 4.10 4.01 4.11 3.96 3.96 3.98 -0.016 0.153 0.099
Significanc e of shear-wave notation is described in insert, Fig. 2, and its figure caption. In the lower part of the table are grouped the anisotropie seismic prop erties of hypothetical average sampl es representative of larg er lithological units, which are deduced from the direct velocity measurements (see text for more explanations).
Table 3
Bulk densities, average P- and S-wave velocities and pressure and temperature derivatives of wave velocities
Samples Density P oiss on Average
(g cm-3) velocities (km s-1) Vp Vs 90VSl2 3.183 0.27 7.02 3.94 90VSl9 3.096 0.26 6.91 3.94 90VS33 3.111 0.26 6.92 3.95 90VS46 2.753 0.17 6.09 3.83 90VS48 2.897 0.28 6.85 3.80 90VS53b 3.280 0.27 7.23 4.04 90VS54a 3.016 0.22 7.03 4.21 90VS77 3.154 0.27 7.22 4.07 9IV07 3.087 0.27 7.18 4.05 91V08 3.01 l 0.23 6.74 4.00 87VS57 2.864 0.24 6.31 3.69 91MA203 2.942 0.29 6.95 3.80 9lVS26l 3.255 0.28 6.99 3.87 9lV09 2.847 0.22 6.17 3.69 ke3 3.360 0.25 8.25 4.75 Per. 475 3.316 0.27 8.37 4.72 Averages Metapelites 2.962 0.24 6.57 3.84 Trans iti on 3.030 0.24 6.87 3.98 Crust 3.035 0.25 6.83 3.92 Ali samples 3.070 0.25 7.01 4.02 3.2. Experimental results
Fourteen lower-crustal samples and two mantle rocks were selected for the laboratory seismic mea surements. Sample numbers, along with the modal compositions of the rocks, are listed in Table 1. The modes were determined by scanning electron mi croscopy (SEM) image analysis techniques using backscattered electrons (e.g. Lloyd, 1985).
The P- and S-wave velocities of the 16 specimens measured at 600 MPa confining pressure (room tem perature) are summarized in Table 2. For each sam
ple we report the three P-wave velocities, the V P
anisotropy, the six shear-wave velocities and the three corresponding birefringence values. At increas ing pressure, P- and S-wave velocities typically show a steep non-linear velocity increase up to 200-300 MPa, which is interpreted as closure of microc racks (e.g. Kem, 1990). At higher pressures, a slight, linear increase of velocities is observed (see Fig. 2). lncrease of temperature at high confining pressure (600 MPa) results in a slight, linear decrease of the
Pressure derivatives Temperature derivatives
(r o om temperature) (600MPa) (lo-4 kmÇ I MPa-1) (-l0-4kms-10
c-
1) dVp/dP dVs/dP dVr/dT dV5/dT 3.62 l.73 2.71 l.66 4.52 2.04 5.51 2.45 3.21 1.26 1.92 1.26 4.52 1.80 4.68 1.49 2.34 1.48 3.48 1.02 3.99 l.99 2.79 1.05 5.77 1.58 3.91 1.31 3.24 1.95 5.28 2.00 l.74 1.17 4.22 l.9 l 5.54 2.50 5.81 2.35 5.20 2.54 3.80 0.83 2.33 1.24 5.64 l.93 2.79 1.91 7.34 2.57 3.48 1.57 2.16 0.36 6.43 4.82 2.36 0.95 4.94 3.93 5.35 2.12 4.09 1.99 4.02 1.52 4.40 l.99 4.49 1.66 3.58 l.79 4.21 1.54 3.86 2.14wave velocities. These linear velocity variations re flect the intrinsic rock properties which are con trolled by the volume percentage of major minerais, their single crystal elastic properties, and their lattice preferred orientations (LPO). The pressure and tem perature derivatives (see Table 3) were calculated from these linear trends and they allow one to ex trapolate seismic velocities for any P-T condition within the stability field of the constituent assem blage of rock-forming minerais. On the basis of the isotropie seismic velocities of these lower-crustal rocks, we also calculated their Poisson's ratios.
4. Calculation of seismic velocities from lattice preferred orientations
Seismic properties of three rock samples were calculated through the Christoffel equation (Crosson and Lin, 1971) combining single crystal densities, single crystal stiffness coefficients and LPO of the constitutive minerai phases, in their modal
propor-tions. This enables us to determine the 21 elastic coefficients (the 6 X 6 symmetric matrix) character izing the aggregate intrinsic elastic behaviour and the
complete anisotropie seismic velocities (Vp, V51, V52,
seismic birefringence, orientation of the shear-wave polarization planes ... ). Details of the calculation methods may be found in several studies (e.g. Baker and Carter, 197 2; Peselnick et al., 1974; Siegesmund et al., 1989). We used a computer program devel oped by Mainprice ( 1990) for the calculations and the spatial representation of the seismic velocity variations. We made these velocity calculations on three samples: an amphibolite, a kinzigite and a lherzolite. Obviously, these three samples cannot be representative of the whole study area but they repre sent important lithologies and they add new and complementary data to the work of Barruol and Mainprice (1993b). The crystallographic measure ments were perfonned with an optical microscope equipped with a universal stage using the methods already described by Barruol and Mainprice (1993b).
4.1. Amphibolite 90VS33
Automorphous and elongated grains of amphibole define a clear lineation. The grain size is typically in the range 0. 2-1.0 mm. The hornblende crystallo graphic c-axes (Fig. 3(a)) form a strong maximum close to the lineation. b-Axes are grouped around the
y structural axis and the poles of the ( 100) planes are
statistically oriented close to the pole of the foliation. Subautomorphous plagioclase grain size is around 0.5 mm. In thin section, most of grains exhibit an albite twin (parallel to the (010) crystallographic plane) roughly parallel to the foliation. This kind of microstructure is typical of those observed in other Ivrea Zone mafic rocks. For this reason, we took as representative the plagioclase LPO measured in the pyroxene-rich gabbro 87VS14a sampled in the Val Sesia, in the same metamorphic grade (Barruol and
Mainprice, 1993b). This plagioclase fabric is charac terized by b-axes concentrated close to the pole of the foliation and c-axes statistically oriented close to the lineation.
Single crystal elastic stiffness coefficients used in these calculations were reported by Aleksandrov and Ryzhova ( 1961) for hornblende and by Aleksandrov et al. (1974) for plagioclase. P-Wave velocities in the hornblende single crystal exhibit a maximum close to the c-axis and a minimum close to the pole of the (100) plane. In the plagioclase single crystal, the
maximum Vp is sub-parallel to the b-axis and the
minimum is close to the a-axis. Despite the fact that plagioclase and hornblende fabric have some de structive effects on the resulting anisotropy when summed together, hornblende (60% of the rock) clearly controls the resulting P-wave velocity distri
butions. The maximum Vp (7.2 km s-1) corresponds
to the amphibole lineation and the minimum
(6.5 km s-1) to the pole of the foliation (Fig. 3(b)).
The P-wave anisotropy is significant (10.9%). The shear-wave properties of the amphibolite are also controlled by the amphibole fabric. The plagioclase single crystal birefringence displays a complex pat tern (e.g. Siegesmund and Kruhl, 1991) and induces a weak birefringence for the plagioclase aggregate. On the other hand, the high birefringence (greater than O. 7 km s - 1 ) of hornblende single crystals in the (100) crystallographic plane and the low birefrin gence parallel to the a-axis are responsible for the pronounced shear-wave splitting (greater than
0.25 km s -1) parallel to the foliation ( xy-plane) with
the fast shear wave polarized parallel to the foliation. Birefringence is very weak for propagation direc tions normal to the foliation.
4.2. Kinzigite 87VS57b
This metapelite (sedimentary rock metamor phosed in the amphibolite facies) was sampled in the
Fig. 3. (a), (c) and (e): lattice preferred orientations (LPOs) of three selected samples, presented on equal-area projection, in the structural reference frame (x, y and z). Foliation is north-south (continuous line) and lineation north-south. Contour intervals: 1, 2, 3, 4, 6, 8, 12, 14%. (b), (d) and (f): three-dimensional variations of the elastic properties of the corresponding rocks: P-wave velocities (left), variations of birefringence (middle) and orientation of the polarization planes of the fast split shear waves (right); each arc segment is part of a great circle corresponding to the orientation of the polarization plane. The modal composition of each rock is displayed in the pie diagram (right). (Note that contour intervals are not the same.)
X=lineation CD Z=pole of the foliation
œ
. Mox. •6.39 Vp distribution(I)
Amphibolite 90VS33 Amphibole 100 groins • Mox . ., 15.22 plagioclase 193 groins a [J Plagie 87VS14a • Homblende VS33b
W
,c Biotite Kinzigite 87VS57 150 groin, • Ma,. .15 50CD'
Olivine .• 1 165 groins b Birefringence •Mox '"'111.4 •Mo.11. .350 Vs 1 orientation Orthapyroxene 55 groins composition C Il Biotite 87VS161 ŒI Plagto tso.D Quartz tso.
d
Lherzolite ke3 • Ollvineke3 G Opxke3 eVal Sesia (Fig. 1). The rock exhibits a foliation strongly marked by fiat biotite crystals. Biotite and sillimanite crystals are automorphous and their grain long axis is about 5 mm. The biotite main cleavage (crystallographic plane (001)) is systematically ori ented parallel to the foliation. Biotite LPO (Fig. 3(c)) was measured in a similar kinzigite (87MA161; see location, Fig. 1) by Barruol and Mainprice (1993b). The quartz is xenomorphous and the grain size ranges from 0.2 to 1.0 mm. Plagioclase grains are subauto morphous and their grain size is 0.5-1.0 mm.
Thin section study revealed that quartz and pla gioclase do not display evidence of preferred orienta tion. We therefore assumed a random orientation for these two minerais. The seisrnic properties of this metapelite were hence calculated using the biotite LPO. Muscovite single crystal stiffness coefficients (Vaughan and Guggenheim, 1986) were used for these calculations. Sillimanite has not been taken into account in these calculations. Burlini and Foun tain ( 1993) quantified the role of the sillimanite in the seismic properties of the 'Serie dei Laghi' metapelites by direct velocity measurements and cal culations. They showed that the crystallographic c axes oriented close to the lineation generate a high P-wave velocity in that direction. Sillimanite-rich metapelites (volume content greater than 15%) there fore display orthorhombic properties for compres sional waves. Sillimanite content in the kinzigite VS57 being around 5%, we assumed this minerai may have only a second-order effect on the seismic properties. The whole-rock seismic properties (Fig. 3(d)) display a P-wave pattern with high velocities (greater than 6.8 km s-1) for waves propagating par allel to the foliation and significantly lower veloci-ties (Jess than 5 .8 km s - 1 ) normal to the foliation, giving rise to a high P-wave anisotropy (21 %). The shear-wave birefringence pattern displays a band of
very high values (greater than 0.55 km s -1 ) parallel
to the foliation. Fast split shear waves are further more systematically polarized parallel to the foliation plane. On the other band, birefringence is very weak
(Jess than 0.05 km s - 1 ) for shear waves propagating
normal to the foliation.
4.3. Lherwlite ke3
This lherzolite crops out within the Balmuccia peridotite massif. It is characterized by a typical
coarse granular texture and displays evidence of plastic deformation. Olivine shows a classic LPO {Fig. 3(e)) with a strong maximum of [010]-axes close to the pole of the foliation whereas the [100] are parallel to the lineation. The orthopyroxene LPO is typical of upper-mantle rocks (e.g. Boudier et al., 1984): a-axes are grouped in a maximum close to the pole of the foliation. The c-axes form a band in the foliation plane with a maximum close to the lineation.
The stiffness coefficients of the olivine and py roxene single crystals used for the calculations are those determined by Kumazawa and Anderson (1969) and by Weidner et al. (1978), respectively. The whole-rock seismic properties, and particularly the P-wave properties, are controlled by olivine, which represents the major volume of the rock (about 80%). The rock slow P-wave direction (7.95 km s- 1) is parallel to the olivine [O 10]-axes (Fig. 3(f)). The [100]-axes (fast P-wave direction in olivine single crystals) concentrated close to the lineation induces a
high V P (8.87 km s - i) in this direction. The shear
wave properties of this rock are also controlled by the olivine fabric. The [010] olivine single crystal crystallographic direction is characterized by a weak birefringence. This explains the very weak birefrin gence (Jess than 0.05 km s - 1) for shear waves propa gating at high angle to the foliation. The olivine single crystal maximum birefringence is located be tween the [100] and [001] crystallographic axes. The band of [001]-axes parallel to the foliation with a
maximum corresponding to the y structural axis
generates a highly birefringent zone (greater than 0.20 km s - 1) within the foliation, with a maximum
(0.40 km Ç 1) close to y. S-Wave seismic properties
of kimberlite nodules (Mainprice and Silver, 1993) display the same patterns of high birefringence close
to the y direction. In the foliation plane, fast split
shear waves are systematically polarized parallel to the foliation.
S. Comparison between measured and calculated seismic properties
Seismic properties were determined using labora tory measurements made on rock samples and/or calculations from petrofabric data. Both methods were applied to several samples. This enables us to
compare the data and to analyse the discrepancies of the results obtained by both methods on four sam ples: the three samples studied in the present work (the metapelite VS57, the lherzolite ke 3 and the amphibolite VS 3 3) and one sample (the magmatic gabbro MA203) for which calculations were per -formed by Barruol and Mainprice (1993b). In this section, we compare measurements obtained at 600 MPa confining pressure (to minimize the influ ence of the microcracks) with those calculated from the LPO.
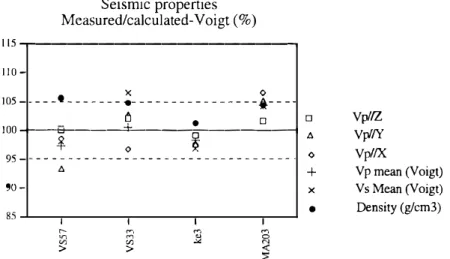
Fig. 4 displays the ratio (in per cent) between measured and calculated seismic properties consider ing the medium as anisotropie for the P-waves using the seismic velocities measured along each structural axis ( x, y or z) and considering the corresponding P and S velocities. Severa! features stand out: ( 1) most of the calculated values show discrepancies in the
range of about
±
5% compared with the measuredones; (2) for a given sample. variations between the various structural axes show little scattering (in a range of about 5%); the average value between the three directions may hence be considered as repre sentati ve and suitable for the comparison; (3) there is no systematic trend. The measured velocities are sometimes higher but also sometimes lower than calculated ones. The only parameter displaying a
systematic variation is density. The measured density (obtained from the size and the weight of the cubic specimen) is systematically higher than the calcu lated density (obtained from the rock modal compo sition and the single crystal densities). Calculation derived densities are smaller than those derived from the volume and the mass of the sample cubes be cause the calculations do not take into account high density accessory minerais, such as Fe-oxides.
5.1. Rock composition
The modal composition of the rock is one of the main factors that contrais the final results. Composi tions were determined by image analyses of digitized views of thin sections obtained from SEM backscat tered electrons. This approach enables us to deter mine directly for each image the surface area of each
minerai phase. Samples (about 10cm2) were digi
tized in several images (10-20, depending on the rock grain size). Discrepancies between our mea sured and calculated results arise in two ways: ( 1) The composition measured from thin sections may differ from the cube specimen; (2) in the calculations we do not take into account minerai phases that represent Jess than 5% of the rocks. For example, oxides may strongly influence the seismic properties. Seismic properties Measured/calculated-Voigt ( % ) 115 -.---, 110 -X 0 105 • .. · -2 e D 100
-t---iî=J---40�----,î=---t
95- - - -- - --- 90-85 1 1 1 1 r-- cr, "' "' "' .l;l V) > > D Vp//Z t,. Vp//Y 0 Vp//X + Vp mean (Voigt) X Vs Mean (Voigt)•
Density (g/cm3)Fig. 4. Comparison between measured and calculated seismic properties of four samples on which both methods were applied. Ratio (in per cent) between the measured and calculated values of the P-wave velocities (Voigt average) along the three structural axes ( x, lineation; y
and z, pole of the foliation) and also between the measured and calculated density, and V5• A ratio of 100% means that we obtained the same results from laboratory measurements and calculations. This diagram clearly shows that the differences between measured and calculated properties are in the range ± 5%.
Vp (km/s) 8.0--.---, 7.5 Sample 7·0 VS57 6.5 Kinzigite 6.0
-a-- Yp//X voigt ---•---- Yp/Nvoigt ·· · ··•· ··· y�-1(!igt � .... Ji.
... ..
5 . 5 ��,--,--,--,--:;:-..-..--..-J � � " " N M 0 6 6 0 N M -.;;t N 6 6 6 0 \0 \0 V) V) 2ê 2ê %biot-%plag-%qtz 8.0-.---� 7.5 Sample VS33 7·0 Amphibolite 6.5 6.0 � ·-·---·---··&•...
··· ···-....
5 .5 -'--.---r---.--..---.,..-.J � %amph-%plagio 9.0-,---, 8.5 Sample 8·0 ke3 7.5 Peridotite 7.0 6.5 6.0•···•···•·---···• ···•
5 .5 -'--r---.---.--..---.,..-.J � ;:s %oliv-%opx 8.0 ... ---7.5 Sample 7.0 MA203 Magmatic 6·5 Gabbro 6_0 ,; "' ;:ls %plagio-%opx Birefringence (km/s) 0.8-.---� 0.6 0.40.2 -a-- Birefr.//X voigt ·· · · ·•-· · · Birefr.//Y voigt···•··· Birefr.//Z voigt
0.8 ... ---0.6 0.4 0.2 � o/oamph-o/oplagio 0.8-.---, 0.6 0.4 0.2
•...•.
--· ;:ls o/ooliv-o/oopx 0.8....---0.6 0.4 0.2 6 ,;"
;:ls %plagio-%opx Densities 3.4....---, 3.3 3.2 3.1 3.0 2.7 zj zj" "
N N ("') Ng � g � �
� � � � � 2ê 2ê %biot-%plag-%qtz 3.4-,---, 3.3 3.2 3.1 3.0 2.9 2.8 2.7 2.6...._...--�-�----.,... � %amph-%plagio 3.4 ... ---, 3. 3 ---3.2 3.1 3.0 2.9 2.8 2.7 2.6....L...,....-..,..-...--... -... ..J ,; "' � %oliv-%opx 3.4 ... ---, 3.3 3.2 3.1 3.0 2.9 2.8 2.7 2.6 _._...,...._..,.._...,.._...,.._....,..__. 6 zj � %plagio-%opxTo quantify the influence of the composition on the resulting seismic properties, we calculated for the four samples the three most important seismic pa rameters for various compositions: the P-wave veloc ity, the birefringence and the rock density, and we compare these values with the measured ones. Re sults for each sample are grouped together in Fig. 5. Each diagram displays the values measured at 300 and 600 MPa confining pressure (this allows one to have an idea of the pressure derivatives), the calcu lated values for measured composition, and the cal culated values with slightly different compositions: for each rock we calculated the seismic properties
considering variations of
±
10% in the proportionsof each minerai phase (see explanation in the figure caption).
The diagrams in Fig. 5 display the following general features:
1. there is no systematic variation. Calculated V P is
generally higher than measured for the kinzigite and the lherzolite sample but the gabbro MA203 displays lower calculated P-wave velocities. 2. The general behaviour of the anisotropy compares
fairly well: for both P-wave velocities and bire fringences, the hierarchical organization between the three structural axes is well preserved (for
example VP,· > VPy > Vp), except when the abso
lute differences are small. For instance, the kinzigite VS57 has the following birefringence pattern: a very small value along the z structural axis and high values along the x and y axes. The highest measured birefringence is along the y axis whereas the highest calculated birefringence is along the x axis, but in both cases the interme diate birefringence is very close to the maximum. This qualitatively important discrepancy (the maximum calculated is oriented along the x and not the y structural direction as measured) is not quantitatively fondamental because the absolute variations are small. The measured and calculated
birefringence patterns of the gabbro MA203 are differently organized but the absolute values are very weak (Jess than 0.10 km s- 1) and this differ ence may not be considered as inconsistent. 3. Fig. 5 shows that a relatively small number of
minerai phases controls the main seismic proper ties. Biotite and amphibole control the anisotropy of the kinzigite and the amphibolite, respectively. On the other hand, plagioclase does not appear to play an important role: the variations of the pla
gioclase content (
±
10%) in the gabbro MA203generate minor variations in the P-wave velocities and weak and complex variations in the birefrin gence.
5.2. Densities
The difference between the measured and the calculated densities cannot directly explain the dif ferences between the two methods. Comparisons of densities in Fig. 5 show that calculated values are generally lower than measured. On the other hand, calculated P-wave velocities are generally higher than measured. For a given rock, characterized by its elastic stiffness matrix, the effect of a higher density in the velocity calculations would be to increase the calculated velocities and therefore to separate the calculated velocities from the measured slightly more.
Only the gabbro MA203 displays compatible V P and
density trends: both calculated velocities and densi ties are lower than measured velocities and densities.
5.3. Microfractures and porosity
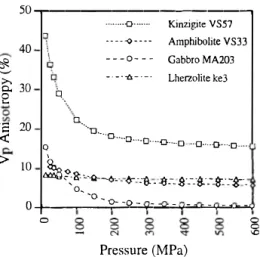
The effect of microfracturing on seismic anisotropy may be inferred from Fig. 6, in which the
measured V P anisotropy is plotted against the confin
ing pressure. These curves display the variation of anisotropy, i.e. the variations of the differences be
tween the minimum and maximum V p· In a medium
Fig. 5. Influence of the rock composition in the comparison between measured and calculated seismic properties for the four samples on which both techniques were applied. V P is shown on the left, birefringence in the middle and density on the right. The diagrams show the measured properties for the three structural directions (at 300 and 600 MPa) and the calculated ones for different modal compositions. From the initial composition of the rock, seismic properties were calculated for variations of ± 10% of the amount of each minerai phase in the rock. For the kinzigite VS57, for example, 50-30-20 (horizontal axis) means that the calculation was perfonned using 50% biotite, 30% plagioclase and 20% quartz.
50....,....---, 40 � � 30
e
� 20>
10 ti. o. .. 0 -·-···O-··· Kinzigite VS57 ----�---- AmphiboLiteVS33 -- -o- - - Gabbro MA203 -· -· -o- · -· Lherzolite ke3 · ·u.···o .... D·-··D·--·�----o � ··D····-D···-0---·1�&c�--Q---o-..
o, -�--_-"ê---�---�·--:s.·.--s-:.-�.·-0 4--�---o_, ... o-__.-o._-�-'-"""�=-o..=,/.=-".=.; 0 § Pressure (MPa)Fig. 6. Effect of confining pressure on P-wave anisotropy for the four samples on which seismic properties were calculated and experimentally determined. The large variations of anisotropy for the kinzigite and the gabbro indicate that these rocks are affected by non-randomly oriented microfractures. The velocity vs. pres sure relations of the amphibolite and the lherzolite indicate that either there are few initial microcracks or that the microcracks are randomly oriented.
with a randomly distributed crack fabric, the overall anisotropy should remain constant with increase of pressure (isotropie sample compaction). The lherzo lite ke3 and the amphibolite VS33 do not display strong variations of anisotropy with increasing pres sure. This means that either there are no cracks in the specimen or these cracks have no preferred orienta tions. Above 300 MPa, anisotropy varies slightly and the slope is quasi-linear. This is controlled by the preferred orientation of minerais (e.g. Kem and Wenk, 1990; Siegesmund and Vollbrecht, 1991). Below 200-300 MPa, the anisotropy may be strongly affected by pressure variations. This is related to the preferred orientation of microcracks which are pro gressively closed as pressure increased. The strong variation of seismic anisotropy for the kinzigite VS57 and the gabbro MA203 clearly indicates the presence of preferred orientation of the microfractures in the specimen.
5.4. Measured lattice preferred orientations (LPO)
Two major problems related to the petrofabric data may arise when calculating seismic properties:
1. owing to the difficulty of acquiring the
crystallo-graphie orientations of some minerais, caused by their low crystallographic symmetry (the plagio clase triclinic, for instance), or because of the small grain sizes, the orientation fabrics of these minerai species may have to be considered as random. We made this assumption for the quartz and the plagioclase in the kinzigite sample, and in that particular case the comparisons with the di rect velocity measurements show fairly good agreements. This is a result of the overwhelming control of the biotite on the seismic properties. 2. The measured LPO may not be representative for
the rock. This can arise if the number of mea sured grains is too small. Moreover, a representa tive measurement of the LPO for low-symmetry minerais (monoclinic and triclinic minerais; pla gioclase, for instance) is difficult to obtain, be cause many crystals are not appropriately oriented to be measurable. This may result in a grain selection in the fabric. To avoid or at least to minimize this problem, plagioclase crystallo graphic orientations were measured on two per pendicular sections (Barruol and Mainprice, 1993b).
5.5. The calculation assumptions
The calculation of the elastic properties of polymineralic aggregates is based on the Voigt, Reuss or Hill approximations. The Voigt average assumes a uniform strain inside the sample, the Reuss average a uniform stress, and the Hill assumption corresponds to the arithmetic mean of the Voigt and Reuss bounds. Mainprice and Humbert ( 1994) showed that the differences between the two approximations in crease with increase in the aggregate anisotropy. In particular, shear waves are more affected than P waves. We have calculated the velocities of these rocks with the different average assumptions and compared the results with the data. The results show no systematic trend. The V oigt assumption is more consistent with the measured values for samples VS57 and VS33, but the Reuss assumption is slightly better for the Iherzolite ke3 and the gabbro MA203. Except for the gabbro MA203, the calculated P-wave velocities generally give a better fit (in the range ± 5%) to the measurements than do the S-waves (in the range ± 10%). These observations clearly
indi-cate that some differences between measured and calculated velocities may be explained by these as sumptions.
In conclusion, the calculated and measured seis mic properties are comparable, at least to a first approximation. Despite some simplifications used for two samples (minerai phase considered as isotropie and LPO obtained on a different sample), qualitative (orientation of fast and slow velocities, for example) and quantitative (magnitude of the velocities, bire fringence) results are in reasonable agreement, within the 95% confidence interval. Part of the observed discrepancies may be attributable to inaccuracies in the determination of the modal composition of the rock, to the calculation assumptions, to inaccuracies in the single crystal elastic constants (particularly for the plagioclase) and to non-modelled variations of the lattice preferred orientations. But we cannot rule out other factors, such as the degree of alteration and the effect of grain shapes and phase contiguity that are not taken into account in the calculations. Also, experimental problems such as the fixed shear-wave transducer orientations or the presence of large ve locity gradients within some samples may affect our results.
6. Bulk anisotropie properties of the lower crust
The extrapolation of laboratory measurements to results from field seismic experiments is problematic for seismologists and petrophysicists. Laboratory-de rived seismic properties are obtained using a wave length of a few millimetres and the results are
inter-7.2 �---�
î
:'::. 7.0 >, w � 6.8 � 6.6 ci. '''' '''' ,,,,,, ... ''"' '''' '''' '''' X Anisotropy:;;: 5.55% y z 0 4.0i
" 3.9 [; 3.8 Xpreted at a scale of a few centimetres. ln seismic field experiments, by contrast, seismic waves sample the anisotropy at scales of hundreds of metres to tens of kilometres. Geophysicists therefore require an overview of the crustal seismic properties at a larger scale. To characterize better the regional seismic anisotropy of the lower crust in the lvrea Zone, we calculated the seismic properties of hypothetical samples which could be more representative of the 'average' lower crust than each sample considered individually. The seismic properties of these hypo thetical samples are obtained by averaging individual seismic properties of rocks that can be found in the same area, based on the velocities measured at 600 MPa confining pressure and room temperature (see Table 2) or on the calculated velocities. The regional structure (foliation and lineation) of the study area is found to be roughly constant so that most of the rock samples were similarly oriented originally. Averaging the physical properties is there fore based on the assumption that their structural axes Oineation, pole of the foliation) have similar orientations in the geographic reference frame (Burlini, 1994). This enables us to average simply the seismic velocities measured along the various structural axes.
From the laboratory data, we calculated the aver age properties of the crust, using the 14 crustal samples and the average properties of the lvrea Verbano Zone through the 16 crustal and mantle rocks. A striking feature is that the average velocities of the 14 crustal samples do not yield an isotropie result. Furthermore, there are clear relationships be tween the anisotropy and the structural reference
y z 0.15
-,---==----,
:'::. 0.10 5 � J: 0.05 i:: ,,,,, ''''' ''''' ,,,,, ,,,,, ''''' ,,,,, ''''' , ... ,,,''''' ''''' ''''' ''''' X '''' '''' '''' '''' ,,,, ,,,, , ... ,, ,v .. , ,,,, '''' '''' ,,,, ,,, ... '''' '''' '''' ... ,,, ,, ... , '''' '''' y zFig. 7. Anisotropie seismic properties of the hypothetical sample representing the mean properties of the lower crust in the lvrea Zone. The data correspond to the average of the laboratory-derived seismic properties of the 14 crustal samples. Despite the number of samples taken into account and their different natures, the P-wave velocities Oeft), the S-wave velocities (middle) and the birefringence (right) for the three structural axes (x, y and z) clearly indicate that the average sample is not isotropie at all.
frame: the average crustal P-wave velocities (Fig. 7, left) are fast (7.0 km s - i) parallel to the lineation ( x structural direction) and slow ( 6.6 km s - 1 ) normal to the foliation. The calculated average velocity anisotropy for P waves is 5.55%. The average crustal S-wave velocities are also strongly related to the structural reference frame. The mean anisotropie shear-wave velocities display a variation pattern al ready described in several samples (e.g. amphibolite VS33). The mean velocities calculated from the 14 crustal samples (Fig. 7, middle) display the follow ing properties: S-waves propagate at high velocities
( 4.01 km s -1) when the y are polarized parallel to the
foliation plane (Vsy, and V5,/ S waves have much
lower velocities (average 3.87 km s- 1) when they are polarized normal to the foliation. The birefringence (Fig. 7, right) is therefore high for waves propagat ing parallel to the foliation (O. JO I and 0.146 km s - 1 parallel to x and y, respectively), and smaller (0.036 km s- 1) in directions at a high angle to the foliation plane.
Considering the fact that seismic waves in real seismic experiments may not sample the whole Ivrea Zone, we calculated the seismic properties of two other hypothetical samples more representative of the actual geology: one sample representing the metapelitic part of the study area and the other representing the lower-crust-upper-mantle transition zone. We based our calculations on lithologies that can be found in Val Strona and Valle d'Ossola (Fig. 1). The hypothetical 'metapelite' sample could be representative of the eastem part of the Val Strona or Valle d'Ossola, which is dominated by metapelitic lithologies. The seismic properties of this sample are calculated on a basis of 75% of metasediments (using the seismic properties of the kinzigite VS57 and stronalites V08 and V09) and 25% of mafic rocks (metagabbro V07 and amphibolites VS33 and VS 12). These ratios roughly represent the outcropping pro portions of the different lithologies.
'Metapelite' seismic properties
= [vos+ V09 + VS57 + ( V07 /3) +(VS33/3) + (VS12/3)]/4
The second hypothetical sample, called 'transi tion', could be representative of the crust-mantle transition of the northem Ivrea Zone, i.e. of the
westermost 5 km of the study area. The lower part of this crust is not dominated by a particular lithology and therefore we calculated the 'transition' sample properties from the arithmetic mean of the seven westemmost samples:
'Transition' seismic properties
= [V08 + V077 + VS46 + VS19 + VS48 + VS54a + VS53b ]/7
The 'metapelite' sample is characterized by much
lower mean seismic velocities (V p = 6.57 km s - 1, V5
= 3.84 km s- 1) than the 'transition' sample (Vp=
6.87 km s - 1, V5 = 3.98 km s- 1 ). The main difference
between these two samples is their birefringence. The 'metapelite' sample displays a birefringence pat tern typical for metasedimentary rocks: a weak bire fringence (0.067 km s- 1) for waves propagating nor mal to the foliation and a relatively high birefrin
gence (greater than 0.23 km s -1) for waves propagat
ing parallel to the foliation. On the other band, the 'transition' sample is weakly birefringent (less than 0.06 km s - 1) in the three structural directions. This is mainly due to mafic rocks (gabbros, pyroxenites), which are generally Jess anisotropie than biotite- or amphibole-bearing rocks.
The lithologies found in the northem part of the Ivrea Zone cannot be extrapolated to the southem part of the studied area (Val Sesia and Val Mastal lone). For this reason, we have calculated the elastic properties of two supplementary hypothetical aver age samples that characterize the large-scale seismic properties of the Val Sesia section, from the petro fabric data obtained by Barruol and Mainprice (1993b).
The seismic properties of the 'transition Val Sesia' sample are the average of five typical samples that can be found in the I km thick layered mantle-crust transition at the contact with the Balmuccia peri dotite body (the pyroxenite VS28b, the dunite VS 148, the sheared pyroxenite VS 14a, the sheared gabbro VS26 and the stronalite VS31). The seismic proper ties of this hypothetical sample are almost isotropie for both P waves (2.2% anisotropy) and shear waves (maximum anisotropy 1.7%). This is a consequence of the weak anisotropy of mafic rocks such as pyrox enites and gabbros. Among these five samples, only
the dunite displays an important Vp anisotropy (9.7%)
The 'intrusion Val Sesia' sample is our attempt to characterize the seismic properties of the gabbro to diorite mafic intrusion. Its elastic constants were determined using 75% of the magmatic gabbro MA203 and 25% of the diorite MA188. The corre sponding calculated seismic properties define the same pattern as the gabbro MA203, but the overall anisotropy is lower than for this rock ( V P anisotropy 3.5% and maximum birefringence 0.1 O km s - 1 ).
We used the nine seismic velocities (three P waves and six S waves; see Table 2) of each hypo thetical sample to determine the stiffness coefficients characterizing their elastic properties (Table 4). These constants enable one to extrapolate the seismic ve locities to the whole space. The number of direct measurements enables us to determine only the elas tic coefficients assuming the medium has an axial
Table 4
symmetry. We used the transformation relationships reported by Christensen and Crosson (1968) and made the two required assumptions: (1) the medium has transversely isotropie elastic properties around the z structural axis (this holds particularly for the S waves; see, for instance, Fig. 7, but is sometimes Jess true for the P waves); (2) the P-wave velocity in a
direction at 45° between the x and z structural axes
corresponds to the average value between Vr, and Vr,· The calculation of the elastic stiffness coeffi
cients is based on the P-wave velocity parallel to the z-axis. on the P-wave velocities parallel to the folia
tion (defined as V Px= Vry= (V Px+ Vpy)/2), on the
values of the two fast shear waves (defined as Vsyx
= Vs,y = (Vs,y + Vsy)/2), and on the other four
S-wave velocities corresponding to the average of
the four velocities (V5,, = Vs,y =Vs,,= Vsy: =
Calculated stiffness coefficients of the elastic tensor C,1 characterizing the elastic properties of the three selected samples and the hypothetical average sam pies
ci} Average Average Average Average Amphibolite Kinzigite Lherzolite Transition Intrusion
(GPa) metapelites a transition • lvrea Zone lvrea Zone VS33 b VS57 b ke3 b Val Sesia c Val Sesia c
( 14 crustal (16 samples) • samples) • C11 134.47 145.52 145.76 156.07 158.15 125.53 260.06 193.74 136.78 C22 134.47 145.52 145.76 156.07 126.42 88.60 210.10 199.19 144.29 C33 114.89 137.65 133.41 141.96 139.46 131.11 236.46 194.96 140.44 C44 41.85 47.76 45.45 48.63 38.66 35.60 73.80 65.74 45.16 Cs, 41.85 47.76 45.45 48.63 45.45 47.49 83.83 64.83 43.44 c66 47.83 48.97 48.80 51.73 38.45 35.32 77.63 65.10 44.81 C,2 38.80 47.58 48.15 52.60 57.73 29.70 70.57 64.99 53.05 Ci, 42.89 46.34 49.34 52.57 58.99 33.63 74.55 65.36 50.71 C14 0.00 0.00 0.00 0.00 -1.10 0.49 0.04 -0.11 0.21 C15 0.00 0.00 0.00 0.00 -0.56 -1.54 -2.70 0.02 0.15 C16 0.00 0.00 0.00 0.00 1.44 -0.14 1.79 1.15 -1.52 C2.1 42.89 46.34 49.34 52.57 53.84 29.59 72.47 65.27 53.49 C2• 0.00 0.00 0.00 0.00 1.38 1.71 -0.79 1.57 0.28 Cz5 0.00 0.00 0.00 0.00 -1.31 0.34 -0.07 0.46 0.01 C26 0.00 0.00 0.00 0.00 -0.56 0.26 1.74 0.69 -1.59 C34 0.00 0.00 0.00 0.00 1.99 4.31 -1.89 0.77 0.36 C35 0.00 0.00 0.00 0.00 -0.59 -1.86 -3.50 0.69 0.53 c36 0.00 0.00 0.00 0.00 0.19 -0.30 0.77 0.20 -0.05 C45 0.00 0.00 0.00 0.00 0.15 -0.36 0.81 0.72 0.56 c46 0.00 0.00 0.00 0.00 -0.24 -0.33 -1.60 0.40 0.05 Cs6 0.00 0.00 0.00 0.00 1.34 2.02 -0.40 0.58 0.05
a
c,
1 characterizing geologic units but calculated from direct velocity measurements. Null values are derived from the fact that the ninemeasured seismic velocities do not enable one to determine the complete elastic tensor.
b C,1 characterizing a single rock elastic properties, calculated from the lattice preferred orientations (LPO) of the constitutive minerai phases, the single crystal elastic constants and densities.
(VSzx + Vszy + Vsxz + Vsy)/4). The resulting stiff ness tensors (C;) describing the average elastic properties of these hypothetical samples are listed in Table 4.
7. Shear-wave splitting in the lower crust
Our calculations clearly show that the mafic rocks such as gabbros and pyroxenites are not efficient generators of significant shear-wave splitting. On the other band, as already shown by several workers (Siegesmund et al., 1989; Burlini and Fountain, 1993; Ji and Salisbury, 1993; Barruol and Mainprice, 1993a), amphibole- and phyllosilicate-bearing rocks are strongly anisotropie and may generate shear-wave splitting in the lower crust. Considering the wave length of a teleseismic shear wave such as an SKS wave, the crust may contribute to the total splitting if the crustal anisotropy appears at a similar scale. Thus, one may expect a crustal contribution to the teleseismic shear-wave splitting if the crustal compo sition and structure are homogeneous enough at a large scale. From the calculated average samples, the birefringence displays some pervasive features: high birefringences for waves propagating parallel to the foliation and weak birefringences for waves propa gating at high angle to the foliation. The regional structure of the study area has furthermore a region ally nearly constant orientation. The present-day lay ering is generally oriented NE-SW and is steeply dipping. In a seismic shear-wave experiment record ing crustal splitting of vertically propagating shear waves, one can expect to measure fast split shear waves oriented NE-SW (i.e. parallel to the regional foliation and particularly to the kinzigite foliation). The magnitude of the delay time is more difficult to predict because it depends on the thickness of the anisotropie layer and on the magnitude of its anisotropy. For a seismic ray propagating in a given direction, the S-wave anisotropy is controlled by the composition of the medium but also by the orienta tion of the layering (Barruol and Mainprice, 1993a). The laboratory data and the seismic properties of the hypothetical mean rock calculated above may give some quantitative constraints and a reasonable upper and lower bound for the delay time. A maximum delay may be obtained by considering the kinzigite
sample VS57. We calculated delay times of about 0.3 s for waves propagating parallel to the foliation through a 10 km thick layer with this composition. This value may be considered as an upper bound for the delay time because the rock is strongly anisotropie and because the calculations do not take into account several factors that would be included in a real field seismic experiment using longer wavelengths, such as lithological heterogeneities, fractures of the upper crust and variation of structural orientations. These three factors will almost systematically reduce the delay time except if microcracks are oriented parallel to the regional foliation. A second calculation has been done using the seismic properties of the aver age crustal sample. The calculated delay times are in this case about 0.1 s per 10 km of rock. Given the method by which the seismic properties were ob tained, one may assume this calculation takes into account important compositional heterogeneities and that this delay time may represent a more realistic lower bound.
8. Conclusions
We investigated the seismic properties, particu larly the shear-wave birefringence, of lower-crustal rocks by combining two different methods: (!) labo ratory seismic measurements at various pressures and temperatures; (2) velocity calculations, based on modal composition, LPOs of major minerais, and single crystal stiffness coefficients and densities. Both methods were applied to four samples.
The measured seismic velocities, particularly of P waves, are typical of those of the lower crust. In numerous samples, significant velocity anisotropy is evident, and shear waves generally display strong splitting parallel to the foliation. At normal incidence to the foliation, shear-wave splitting is practically absent. The laboratory-derived and calculated veloci ties are in good qualitative and quantitative agree ment. We discussed the basic effects that may ex plain the discrepancies, such as rock composition, density, microfracturing, accuracy of the LPO and the basic assumptions used in the calculations.
To make a link between direct velocity measure ments performed on hand specimens and large-scale seismology, we determined the elastic properties of