HAL Id: hal-02476655
https://hal.archives-ouvertes.fr/hal-02476655
Submitted on 25 May 2020
HAL is a multi-disciplinary open access
archive for the deposit and dissemination of sci-entific research documents, whether they are pub-lished or not. The documents may come from teaching and research institutions in France or abroad, or from public or private research centers.
L’archive ouverte pluridisciplinaire HAL, est destinée au dépôt et à la diffusion de documents scientifiques de niveau recherche, publiés ou non, émanant des établissements d’enseignement et de recherche français ou étrangers, des laboratoires publics ou privés.
Copyright
Monosodium Glutamate Supplementation Improves
Bone Status in Mice Under Moderate Protein
Restriction
Anne Blais, Gael Rochefort, Manon Moreau, Juliane Calvez, Xin Wu, Hideki
Matsumoto, Francois Blachier
To cite this version:
Anne Blais, Gael Rochefort, Manon Moreau, Juliane Calvez, Xin Wu, et al.. Monosodium Glutamate Supplementation Improves Bone Status in Mice Under Moderate Protein Restriction. JBMR Plus, 2019, 3 (10), pp.e10224. �10.1002/jbm4.10224�. �hal-02476655�
Version postprint
Monosodium glutamate supplementation improves bone status in
mice under moderate protein restriction
Anne Blais
1, Gael Y. Rochefort
2, Manon Moreau
1, Juliane Calvez
1,
Xin Wu
3, Hideki Matsumoto
4, François Blachier
11
UMR PNCA, AgroParisTech, INRA, Université Paris-Saclay, 75005, Paris,
France
2
EA 2496, Dental School Faculty, Université Paris Descartes, 92120 Montrouge,
France
3
Key Laboratory of Agro-ecological Process in Subtropical Region, Institute of
Subtropical Agriculture, Chinese Academy of Sciences, 410125 Changsha,
China
4
Institute for Innovation, Ajinomoto Co. Inc, Kawasaki 210-8681, Japan
Accepted
Article
This article has been accepted for publication and undergone full peer review but has not been through the copyediting, typesetting, pagination and proofreading process which may lead to
Version postprint
Abstract
Adequate protein intake during development is critical to ensure optimal bone gain and to attain a higher peak bone mass later on. Using a mild protein restriction model in Balb/C mice consuming 6% of their total energy intake as soy protein (LP-SOY), and for which we observed a significant lower femoral cortical thickness, bone volume, trabecular number and thickness reduction, we evaluated the effects of monosodium glutamate (MSG) supplementation at different concentration (0.5, 1, 5, 10 and 20 g/kg of diet) on bone characteristics in LP-SOY-fed mice.
After 6 and 12 weeks, LP-SOY-fed mice had lower bone mineral density (BMD) reduced body weights related to a lower lean mass, which was associated with a reduced IGF-1 level. The negative effect of the LP-SOY diet on BMD was correlated with an impaired bone formation. MSG supplementation at 5, 10 and 20 g/kg of diet and PTH injection, used as a positive control, were able to improve BMD, to increase osteoblast activity markers (P1NP and osteocalcin) and glutamine plasma concentration. Analysis of bone microarchitecture shown that the cortical bone was less sensitive to protein restriction than the trabecular bone, and that MSG ingestion was able to preserve bone quality through an increase of collagen synthesis, although it did not allow normal bone growth.
Our study reinforces the view that glutamate can act as a functional amino acid for bone physiology and support clinical investigation on glutamate supplementation in adults characterized by a poor bone status, notably in situations of insufficient protein intake.
Key-word: Bone µCT, Bone turnover, Collagen synthesis, Monosodium glutamate, Dietary protein restriction, mice model
Disclosure of Potential Conflicts of Interest: None
Accepted
Version postprint
Introduction.
Monosodium glutamate (MSG) is a worldwide-used flavor enhancer. Added glutamate represents approximately 0.4 g/day in Europe and 1.5 g/day in Asia (1). The average glutamate intake from dietary sources (proteins and free glutamate) is between 10 and 20 g/day (2). Glutamate, apart from its role as a quantitatively major amino acid precursor for protein biosynthesis, is involved as a precursor of compounds that play many roles in cell metabolism, regulation of cell metabolism, and cell physiology in mammals including humans (3, 4). In addition, glutamate is involved in several aspects of taste and gastro-intestinal physiology (5, 6). Finally, glutamate is well known to be an excitatory signaling molecule in the central nervous system (7), and to act as an energy substrate in many cell types (8, 9).
Regarding the implication of glutamate in bone physiology, recent in vitro studies suggested a physiological role for this amino acid in the regulation of bone mass. Glutamate, as a so-called “functional amino acid”, has been suggested to play a role in bone formation and mass maintenance (10). As a matter of fact, glutamate appears to be implicated in osteoblast and osteoclast differentiations (11, 12). Glutamate displays a mitogenic effect on osteoblasts (13), and prevents decreased bone mineral density in femur and tibia after systemic administration (14). A recent study also suggests that high glutamate concentration can promote differentiation and activation of osteoblasts (15). Moreover glutamate signaling involve both binding to specific receptors and its transport in osteoblasts (11, 16, 17, 18). However, from in vivo experiments, it appears that virtually all the enteral glutamate in the diet is metabolized by the gut during absorption, and thus relatively large doses of glutamate in supplements have to be used to increase the glutamate concentration in the portal blood, and to a lower extent in the arterial blood (19, 20, 21) thus questioning the way by which glutamate from dietary origin would contribute to intervene in bone physiology and metabolism.
Overall, bone mass and bone quality determine bone strength. Bone mineral density (BMD) and bone microarchitecture (µCT) depend on osteoblast and osteoclast activity to maintain adequate bone remodeling. Low bone mass can be associated for instance with estrogen deficiency which increases bone resorption over bone formation (22), or with inadequate protein intake (23), that reduces bone formation. The deleterious consequences of insufficient protein intakes are numerous (24, 25), and both protein quantity and quality have been shown to affect bone quality and muscle mass under moderate protein restriction. We previously shown, in mice fed with low protein diet (6% of the total energy being supplied by soy protein), reduced body weight related to a lower lean mass and reduced bone mineral density when compared with mice receiving a sufficient protein supply (26).
When protein intake is lower than the estimated average requirement, as observed in specific groups of individuals like the elderly, notably in case of hospitalization (27), and in younger individuals in several developing countries (28), utilization of dietary supplements in the forms of dietary protein and/or amino acids including glutamate represents a nutritional strategy that may improve osteoblast activity and bone status.
In that overall context, the aim of the present study was to identify the modifications of biological parameters associated with the beneficial effect of glutamate used in its monosodium salt form (MSG). To investigate the effect of different concentrations of MSG on the bone status, we used a mice model under mild protein restriction (6% of total energy being brought by soy protein), a model that has been recently implemented in our laboratory. In this experimental model, reduced lean body mass and bone formation are observed (26), thus appearing convenient for testing the effect of MSG on osteoblast activity. In the present study, we have included a normal protein control diet (NP, with protein representing 20% of
Accepted
Version postprint
the total energy), and seven groups of mice with soy protein-restricted isocaloric diet (LP, protein representing 6% of the total energy) and receiving different amount of MSG. An additional group of animals used as a positive control received a daily parathyroid hormone (1-34 PTH) injection.
Materials and methods Animals
Eight-week-old Balb/C female mice (Harlan) were housed at 22 °C under a 12/12 h light cycle. Initially five animals per cage were used for the first week of habituation. The mice were then moved to individual cages for another week. During the two weeks of habituation, the mice were fed a standard AIN-93M diet containing 20% of total energy as soy protein. The soy protein used in our study did not contain any phytoestrogens in order to avoid interference with bone metabolism. The design of this study was approved by the French Government (APAFIS#10768-20170521316215762v2). After the habituation period, ten-week-old mice were divided into 8 groups of twelve animals.
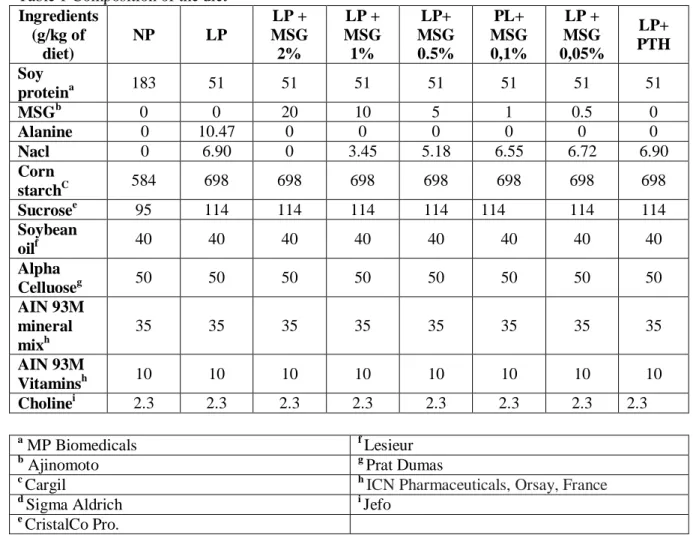
One group stayed on the 20% soy protein diet used as a normo-protein (NP) control group and the 7 other groups were shifted to a low protein (LP) diet containing only 6% of total energy as soy protein. One group of mice, which was shifted to the 6% soy protein diet, was also treated for five days per week with a subcutaneous injection of 40 μg/kg of 1-34 PTH (Sigma-Aldrich, France) as an anabolic control (LP + PTH). Different concentrations of monosodium glutamate (MSG) (2%, 1%, 0.5%, 0.1% and 0.05%) were added to the diet, and the groups were respectively identify as (LP +2%, LP +1%, LP +0.5%, LP +0.1% and LP +0.05% MSG). The last group (control group) was shifted to the 6% soy protein diet (P6 soy) and did not received MSG, but was supplemented with an iso-nitrogenous amount of alanine and an iso-amount of sodium in the form of NaCl (Table 1). To maintain an equal amount of energy intake in the NP and LP diets, the protein was replaced by starch and sucrose in the 6% protein diets. To avoid the protein leverage effect in our study, and to allow equal energy consumption, we pair-fed all the LP groups in comparison with the NP control group. Then, every day the food consumption of the NP soy group was measured to determine the amount of diet for the other groups. The LP groups not receiving PTH were injected daily with the vehicle alone.
Body composition
The body composition (fat mass and lean mass) was measured at the beginning, after 3 and 6 weeks, and at the end of the study by dual energy X-ray absorptiometry (DEXA), using a Lunar PIXImus densitometer (DEXA-GE PIXImus). The stability of the device was controlled by the measurement of a phantom before each session. The mice were anesthetized by isoflurane inhalation during the measurement. Analysis of the images was performed with the software provided with the device (Lunar PIXImus v2.10), using auto-thresholding. After 12 weeks, the night before anesthesia, the mice were starved overnight, and a meal of 1g was given in the morning 90 minutes before anesthesia with isoflurane. Blood was drawn by cardiac puncture and the mice were immediately decapitated to ensure death. Body composition was determined by dissection: liver, uterus, spleen, kidneys and pancreas, four white adipose tissue (WAT) pads (periovarian, retroperitoneal, mesenteric and total subcutaneous), interscapular brown adipose tissue (BAT) and the carcass (muscle and bone) were removed and weighed.
Accepted
Version postprint
Determination of free amino acid profile in plasma
Free amino acids profile in the plasma was measured using ultra-high-performance liquid chromatography (UHPLC). Blood was collected 90 min after ingestion of a 1g-meal. Norvaline was added to plasma as internal standard. Plasma were first deproteinized with sulfosalicylic acid (10 g/l), stored at 4°C and then centrifuged at 3,000 × g (4℃) for 30 min. The supernatant were centrifuged for 5 min at 12,000g and 10µl was derivatized using AccQ
TagTM Ultra Derivatization kit (Waters SAS, France) according to the manufacturer
instructions. UHPLC analyses were performed on an Acquity UPLC H-Class system with a PDA detector (Waters SAS, France).
Isolation and determination of the femur protein fraction.
The left femur of each mouse was cleaned from muscles and crushed with a scalpel in an ice cold buffer (50 mM Tris·HCl (pH 7.4), 50 mM NaF, 10 mM β-glycerophosphate disodium
salt, 1 mM EDTA, 1 mM EGTA, and 1 mM activated Na3VO4 (all chemicals being obtained
from Sigma-Aldrich)) including a complete protease inhibitor cocktail tablet (Roche, West Sussex, UK) used at 10 µl/µg tissue. The homogenates were centrifuged for 10 min, and the pellets were solubilized in 0.3 M NaOH for 24 hours. The solubilized protein fraction was separated by centrifugation. A second extraction with NaOH was performed, followed by a subsequent extraction with 0.5 M acetic acid. The solubilized fractions were pooled and precipitated with 1 M perchloric acid. The pellets were dried and weighted. Pellets (3 mg) were hydrolyzed using HCl 6 N for 24 hours, dried and resuspended in water (100 µl). For the
amino acid analysis, the samples were derivatized using the AccQ TagTM Ultra Derivatization
Kit (Waters SAS, France) and measured using UHPLC as plasma samples. Biochemical analysis
Blood from fasted animals was collected from the tail, and 100 µL of blood were collected after 6 and 12 weeks. N-terminal propeptides of type I procollagen (PINP) and C-terminal crosslinking telopeptides of type I collagen (CTx) were measured by enzyme immunoassay (EIA) according to the instructions of the manufacturer (Immunodiagnostic Systems). Plasma osteocalcin (OC) and total IGF-1 levels were determined by enzyme-linked immunosorbent assay (ELISA) after inactivation of the IGF binding proteins according to the instructions of the manufacturer (Immunodiagnostic Systems).
Measurement of microarchitectural parameters
Micro architecture of the femurs was analyzed using a high-resolution X-ray Micro-CT device (Quantum FX Caliper, Life Sciences, Perkin Elmer, Waltham, MA, United States), hosted by the PIPA Platform, EA2496, Montrouge, France. The X-ray source was set at 90 V and 160 μA. Samples up to 65 mm diameter and 200 mm in length were imaged with a Full 3D high-resolution, and raw data were obtained by rotating both the X-ray source and the flat panel detector 360° around the sample, with a rotation step of 0.1° (scanning time: 3 min). The corresponding 3,600 image projections were then automatically reconstructed (RigakuSW software, Caliper) into a Dicom stack of 512 files using standard back-projection techniques (reconstruction time: less than a minute). The multiplanar reconstruction tools allowed to display grey-level images in axial orientation. The lowest grey/dark pixels matched with empty spaces, and the highest grey/bright pixels represented the densest mineralized tissues. The scans for trabecular bone were initiated from the distal femoral growth plate moving proximally along 50 slices, and then 100 slices were analyzed in order to eliminate
Accepted
Version postprint
the primary spongiosa. The different aspects of trabecular bone were quantified at a 3D
isotropic voxel size of 10x10x10 μm3. The structural indices included the ratio of the
segmented bone volume to the total volume of the region of interest (BV/TV, %), trabecular number (Tb.n, 1/mm), trabecular separation (Tb.Sp, µm), which were calculated by the Mean Intercept Length method, structure model index (SMI) and degree of anisotropy (DA). Trabecular thickness (Tb.Th, µm) was calculated on 3D images using CtAn® Skyscan software through a method described by Hildebrand and Ruegsegger (29, 30). Cortical thickness and diameters (mm) were measured directly and manually on the image, at the
mid-diaphysis level. Cortical porosity (Ct.Po, %), cortical bone area (B.Ar, mm2) and moment of
inertia (mm4) were measured at the mid-diaphysis level as previously described (31). All
details of these measurements have been published elsewhere by Lespessailles et al. (32). Bone characteristics
The left femur of each mouse was cleaned from muscles and dried overnight at 110°C, weighed, and then ashed at 550°C for 48 h, and the weight of the ash was then evaluated. The difference between the dry weight and the ash gives an indication of the protein fraction in bone.
Statistical analysis
Results were expressed as means ± SD together with the number of independent experiments. Results were compared using a one-way analysis of variance (ANOVA) and a Tukey multiple comparison test to assess the effect of treatment. Significance was established at P< 0.05. All statistical analyses were performed using Prism® Version 6.05 (GraphPad Software Inc.). Results
Effects of MSG on body composition
As indicated in Table 2, the body weight of mice ingesting the low protein (LP) diet for 6 and 12 weeks remained almost unchanged when compared with the initial weight, whatever was the amount of MSG used as dietary supplement.
According to DEXA measurements, the LP diet appeared to affect only the lean mass, as the fat mass gain was similar to the values recorded in the NP group. When the animals receiving the LP diet were treated with PTH, no effect of this anabolic hormone on body weight and composition was measured. Final body and organ weights are presented in figure 1. The final body weight of the mice in all the LP groups was significantly lower than the weight measured in the control NP group (fig 1A). The significant lower body weight of LP animals was correlated with a lower carcass weight (fig 1B) but not with a decrease of the total fat mass, this parameter being similar for the NP and LP groups (fig 1C). This confirms that moderate reduction of protein intake has a significant impact only on the lean body mass gain. Analysis of the weight of different organs showed that the LP diet also reduced uterus (fig 1D) and kidney (fig 1E) weight, but did not modify liver weight (fig 1F). The MSG supplementation or PTH injection did not show any significant effect on those parameters. As the low protein diet reduces the lean body mass, the muscular strength was evaluated by using the grip test. Values of 85.7 ± 2.7 vs. 83.3 ± 1.9 newton were measured for the NP and LP group respectively, thus indicating that the muscular strength appears proportional to the body weight of the animals.
Accepted
Version postprint
Effect of MSG on free amino acids in the plasma
We evaluated in mice the plasma amino acid concentrations 90 min after ingestion of a 1g meal without or with different doses of MSG. Table 3 shows that, when compared to values recorded in the NP group, the ingestion of the LP diet decrease plasma concentration of all amino acids measured except, as expected, alanine. This latter results is due to the fact that the LP control group was supplemented with an iso-nitrogenous amount of alanine. Ingestion of the diet containing 1 and 2% of MSG increased significantly the plasma concentration of glutamine, by 25 and 49% respectively when compared to the concentrations measured in the control LP diet group. The highest concentration of MSG used was also able to increase the alanine plasma concentration by 30% compared to the concentrations measured in the control LP diet group. All the other amino acid concentrations in plasma, notably the glutamate concentration, remained unchanged whatever the dose of MSG used. The treatment of protein-restricted mice with the lowest MSG concentration or PTH has no significant effect on any of the circulating amino acid concentrations measured in plasma (data not shown). Effects of MSG on bone mineral density
BMD gain, as a function of time, is shown on figure 2A. The LP diet reduced significantly BMD gain after 3, 6 and 12 weeks when compared to the BMD measured in NP animals. Although the two lowest concentration of MSG used for supplementation were not able to improve BMD gain, the 0.5, 1.0 and 2.0 % doses were able to significantly improved this parameter as soon as after 3 weeks of treatment and thereafter. As previously shown by Rouy et al. (21) sub-cutaneous injection of PTH was able to preserve the BMD in our model, and the MSG used at 1 and 2% doses were nearly as efficient as PTH to preserve the BMD. Analysis of femoral and lumbar spine BMD (figure 2B and 2C), after supplementation with MSG for 3 months shows that MSG ingestion, when used at 1 and 2% doses, was more efficient to preserve BMD at the vertebral than at the femoral level. Indeed, the 2% dose of MSG was as efficient as PTH injection to maintain the lumbar spine BMD.
Effects of MSG on IGF-1 and bone remodeling marker plasma concentration
As indicated on Figure 3A, the LP diet reduced the IGF-1 plasma concentration by nearly 50%. MSG supplementation or PTH injection did not have any effect on IGF-1 level. Plasma concentration of CTX, the osteoclast activity marker, was severely decreased when mice ingested the LP diet. MSG supplementation or PTH injection did not have any effect on CTX level. The LP diet also reduced the plasma concentrations of PINP and osteocalcin, two markers of bone formation. However, the positive control PTH and the highest concentration of MSG (i.e. 2%) where able to increase both markers suggesting that osteoblast activity was largely restored by MSG supplementation.
Effects of MSG on bone microarchitecture
As indicated on figure 4 and 5, and table 4, LP diet reduced both trabecular and cortical bone microarchitecture. However, the trabecular bone was found to be more sensitive than cortical bone to the LP diet. DEXA and μCT data are in agreement with this latter result, identifying a negative effect of the LP diet on bone microarchitecture. MSG supplementation from 0.5 to 2% dose-dependently improved bone µCT and, as previously shown, PTH injection, used as positive control, was able to preserve bone µCT. Lower doses of MSG were inefficient to preserve bone microarchitecture (data not shown).
Accepted
Version postprint
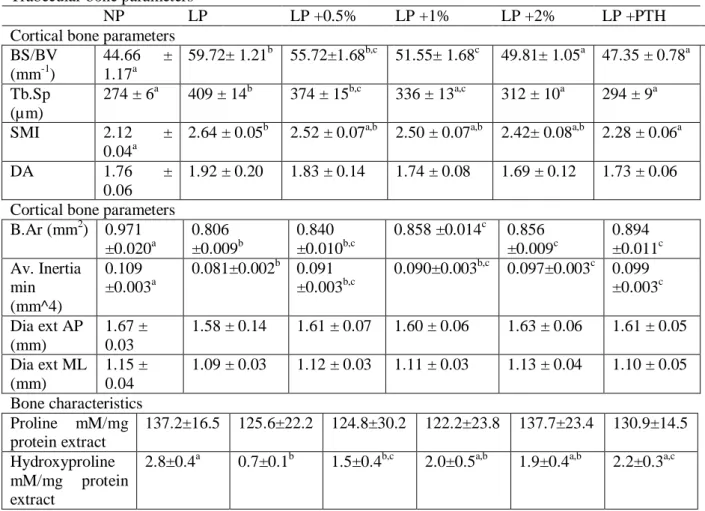
In the femur, the LP diet decreased BV/TV, Tb.Th, Th.N and increase BS/BV, Tb.Sp and SMI but did not display any effect on DA. Ingestion of the LP diet for 12 weeks decreases BV/TV and Tb.N by 63% and 61% respectively. MSG ingestion dose dependently improved trabecular bone characteristics. The highest concentration of MSG used (i.e. 2%) was almost as efficient as PTH to preserve trabecular bone.
The analysis of the bone microarchitecture characteristics confirmed that LP diet did have less impact on cortical than on trabecular bone. We report a reduction of 19% of the cortical thickness and an increase of the cortical porosity. Moreover, PTH used as a positive control, or MSG were not able to completely reverse the impact of LP diet on the cortical bone. Indeed, 10% of cortical bone was lost when mice ingested the LP + MSG 2% or LP + PTH diets. We reported the same results for the B.Ar, Av. Inertia max and Av. Inertia min. However the Ct.Po was restored in the LP + PTH and significantly improved in the LP + 2% MSG experimental groups of animals.
To better understand the effect of MSG and PTH, different bone characteristics were analyzed. Femur length measured at the beginning (15.00 ± 0.07 mm) and at the end of the experiment, are presented in figure 6. Ingestion of the LP diet arrested bone length growth and, as shown for the analysis of the cortical bone, the bone length in the LP + 2%, and LP + PTH groups increased when compared to the LP group. However, these treatments did not allow to catchup the normal bone length when compared to the NP group. Bone dry weight measurement showed that the LP diet reduced not only the length but also bone size indicating that such a dietary restriction is related not only to a reduction of the mineral part but also to a reduction of the protein fraction. MSG as PTH were able to improve bone mineral content. However the mineral part of the bone never catchup with the NP group. As the calcium content of all the diets are similar, the results emphasize the importance of the protein content to maintain bone quality. Evaluation of the protein content by subtraction of the ash component from the dry weight shown that only the highest concentration of MSG was able to increase significantly the bone protein content when the LP diet was ingested. Finally, bone protein were extracted and the hydroxyproline contents, used as an amino acid specifically found in collagen, were determined. The LP diet lowered the hyproxyproline content, but MSG ingestion and PTH injection were able to increase this content. Regarding proline which is not specifically found in collagen, we found no modification of this amino acid in bone protein after MSG supplementation.
Discussion
The data obtained in the present study indicate that MSG, used as a dietary supplement, is efficient to largely restore, in a dose-dependent manner, the impaired bone status in a mice model receiving a restricted amount of protein in the diet. The effects of MSG on bone mineral density, bone remodeling biochemical markers, and microarchitecture characteristics were associated with a dose-dependent effect of the supplementation on the glutamine plasma concentration that was markedly increased, although glutamate circulating concentration remains unchanged. As a matter of fact, due to an intense catabolism of glutamate in the intestine (3), very large doses of glutamate in supplements are necessary for increasing the concentration of this amino acid in the portal vein, and more weakly in the arterial blood (21). The concentrations of all the other amino acids were not changed after MSG supplementation, with the notable exception of alanine that was increased by the highest dose of MSG. Such an increase corresponds to the high capacity of intestinal epithelial cells to transaminate glutamate in the presence of pyruvate allowing alanine and alpha-ketoglutarate production (3).
Accepted
Version postprint
It is then tempting to propose that the effects of MSG on bone would be largely related to its capacity to increase glutamine concentration in blood. Several evidences argue in favor of this interpretation. Firstly, glutamate supplementation has been shown to increase glutamine circulating concentrations in several experimental models (33, 34). Secondly, glutamine represents a major oxidative fuel in osteoblasts fulfilling an important part of energy requirement and promoting protein synthesis (35). Although, out of the scope of the present study, the way by which glutamate supplement increase glutamine plasma concentration is worth to be briefly discussed. One plausible possibility is that dietary MSG supplementation would increase glutamate intake in enterocytes and thus its intracellular concentration. Since intestine is well known to represent a major site for glutamine catabolism in the body through glutaminase activity (36), and since glutaminase in intestinal epithelial cells has been shown to be strongly inhibited by glutamate (37), this would correspond to a sparing effect of glutamate on glutamine catabolism in intestine (21). Another way to increase glutamine concentration is through the activity of glutamine synthetase. This latter activity is expressed at very low level in intestine (38), in contrast with the situation in peri-venous hepatocytes (39). In other words, glutamate would limit glutamine utilization in the intestine and be released in the portal vein for glutamine synthesis in the liver. Further work is obviously required to decipher the ways by which glutamate increases glutamine plasma concentrations. Addition of 2% of MSG to the diet was nearly as efficient as the treatment of animals with PTH thus indicating a robust effect of this amino acid on the bone status. Interestingly, although both the lumbar spine and femoral bone mineral density were improved by MSG supplementation, the effect was more marked at the vertebral than at the femoral level indicating different efficiency of the dietary intervention according to the type of bone considered. Knowing that different skeletal sites do express different sensitivity to estrogen withdrawal or to pharmaceutical treatments, this result is not unexpected.
As previously reported, low protein diet used in our study induced a marked reduction of BMD gain (26), and this decrease was correlated to decreased plasma level of IGF-1, CTX, PINP and OC. IGF-1 is a growth factor with both endocrine and paracrine/autocrine anabolic actions on bone (22) moreover its plasma correlation is well correlated not only to protein level but also the protein quality (40), while CTX is a marker of bone resorption and PINP/OC are markers of bone formation. Furthermore, the LP diet markedly altered bone microarchitecture thus confirming that LP diet in the growing mice model displayed severe effects on the bone status. Our results show that addition of 2% MSG to the diet preserved bone quality as efficiently as PTH used as a positive control. In a previous study we have shown that the changes measured by µCT in the femur of mice receiving the LP diet were associated with an increase adipocyte volume in the marrow and to a lower osteoid surface compare to NP and LP+PTH. These results indicate that PTH injection is able to preserve bone formation. In the present study we evaluated the osteoblasts activity through the hydroxyproline content in femur which is specific for measurement of the bone collagen content. Ours results indicate that both PTH and MSG were able to preserve osteoblast activity.
The low protein diet reduced not only BMD gain but lean mass gain, uterus and kidney weight supporting a reduction of protein synthesis not only in bone but also in other tissues sensitive to the protein restriction. However, MSG supplementation, although improving bone physiology, had no effect on the weight of the lean mass, uterus and kidney. Regarding the inability of MSG and PTH to counteract the negative effect of LP diet on the lean mass, this result is associated with the inability of both treatments to restore a normal IGF-1 plasma concentration.
Accepted
Version postprint
Our data show that MSG efficiently preserves BMD, PINP and OC plasma level and bone hydroxyproline content, this latter parameter being directly correlated to collagen synthesis in the bone. This suggests that glutamine specifically stimulates the activity of osteoblasts in bone. These results are in agreement with the µCT analysis showing that both MSG and PTH were able to preserve trabecular and cortical bone microarchitecture. However detailed analysis of bone characteristics showed that even if MSG and PTH improves bone quality, they did not allow a complete catchup of femur growth. Our results are in accordance with a study showing that the bone anabolic effects of PTH were attenuated in rats fed a LP diet (41). Although our in vivo data clearly show that MSG supplementation is an efficient way to preserve bone quality in a model where this latter is greatly compromised, questions remained on the way glutamate exert its beneficial effect on the bone status. The fact that MSG failed to increase the IGF-1 level in the LP animals implies that this amino acid acts on bone independently of this growth factor. There is an intriguing question on the ways glutamate, likely through its capacity to serve as a substrate for glutamine synthesis and as a regulator of glutamine degradation, can preserve bone status without furnishing all the other amino acids required for increased protein synthesis in bone. In order to answer this important question, it is worth considering that PTH, in the absence of any amino acid given as supplement, can markedly restore the bone quality. In other words, it is likely that glutamine (just like PTH), by stimulating the osteoblast activity, increases the uptake of the circulating amino acids needed for increasing the protein synthesis in these cells. However, under moderate protein restriction, even under condition of MSG supplementation, we found that the bone length was reduced, raising the view that MSG favors bone quality at the expense of bone growth in length. As MSG improved the plasma concentration of glutamine but PTH did not, the mechanisms presumably involved for the stimulation of osteoblast activity by MSG must implicate different pathways than the one’s involved in the PTH action. Recent studies shown that stimulating glycolysis in preosteoblasts increase bone formation in vivo (42).Our results showing a good correlation between preservation of bone quality and glutamine plasma level are in agreement with previous in vitro studies showing that glutamine import was required by calvarias osteoblast for matrix mineralization (43). Moreover previous data have shown that increase glutamine level favors energy metabolism in osteoblasts (44), and that decrease glutamine consumption by bone marrow stromal cell in elderly mice has been linked with impaired osteoblast differentiation (45). These data support that glutamine can be an important osteoblast regulator.
Conclusion
Our results gives evidence that relatively large doses of MSG in situation of moderate protein restriction, likely by allowing an increase of glutamine plasma concentration stimulates osteoblast activity and improves the altered BMD and bone microarchitecture. Our study thus reinforces the view that glutamate supplementation can be useful in situation of poor bone status. From a more applied point of view, our results aimed at encouraging future clinical investigation on the efficiency of glutamate supplementation in adult volunteers characterized by poor bone status, notably in situation of insufficient protein intake.
Acknowledgments
Accepted
Version postprint
Author’s roles: Study design: AB, HM and FB. Methodology: AB, GYR and JC. Study conduct: AB, GYR, MM, XW and JC. Data collection: AB, GYR, MM, XW and JC. Data analysis: AB and GYR. Data interpretation: AB, GYR and FB. Drafting manuscript: AB. Revising manuscript content: AB, GYR and FB. Approving final version of manuscript: AB, GYR, MM, JC, XW, HM and FB
We also thank Jean-Louis Le Floch and Alexia Couallet for their technical assistance. This work was supported by Ajinomoto as and industrial partner and by Agricultural innovation project of Hunan Province (2018ZD12).
References:
1. Beyreuther K, Biesalski HK, Fernstrom JD, Grimm P, Hammes WP, Heinemann U, Kempski O, Stehle P, Steinhart H, Walker R. Consensus meeting: monosodium glutamate - an update. Eur J Clin Nutr. 2007:61(3):304-13.
2. Tomé D. The Roles of Dietary Glutamate in the Intestine. Ann Nutr Metab. 2018;73 Suppl 5:15-20. doi: 10.1159/000494777
3. Blachier F, Boutry C, Bos C, Tomé D. Metabolism and functions of L-glutamate in the epithelial cells of the small and large intestines. Am J Clin Nutr. 2009;90:814S-821S. doi: 10.3945/ajcn.2009.27462S.
4. Hou Y, Wu G. L-Glutamate nutrition and metabolism in swine. Amino Acids. 2018;50:1497-1510. doi: 10.1007/s00726-018-2634-3.
5. Vandenbeuch A, Kinnamon SC. Glutamate: Tastant and Neuromodulator in Taste Buds. Adv Nutr. 2016;7(4):823S-7S. doi: 10.3945/an.115.011304.
6. Burrin DG, Stoll B. Metabolic fate and function of dietary glutamate in the gut. Am J Clin Nutr. 2009;90:850S-856S. doi: 10.3945/ajcn.2009.27462Y.
7. Mayer ML. Structural biology of glutamate receptor ion channel complexes. Curr Opin Struct Biol. 2016;41:119-127. doi: 10.1016/j.sbi.2016.07.002.
8. Kovacevic Z, McGivan JD. Mitochondrial metabolism of glutamine and glutamate and its physiological significance. Physiol Rev. 1983;63(2):547-605.
9. Jenstad M, Chaudhry FA. The Amino Acid Transporters of the Glutamate/GABA-Glutamine Cycle and Their Impact on Insulin and Glucagon Secretion. Front Endocrinol 2013;4:199. doi: 10.3389/fendo.2013.00199.
10. Brakspear KS, Mason DJ. Glutamate signaling in bone. Front Endocrinol 2012;3:97. doi: 10.3389/fendo.2012.00097.
11. Cowan RW, Seidlitz EP, Singh G. Glutamate signaling in healthy and diseased bone. Front Endocrinol 2012;3:89. doi: 10.3389/fendo.2012.00089.
12. Lin TH, Yang RS, Tang CH, Wu MY, Fu WM. Regulation of the maturation of osteoblasts and osteoclastogenesis by glutamate. Eur J Pharmacol. 2008;589:37-44. doi: 10.1016/j.ejphar.2008.04.060.
13. Fatokun AA, Stone TW, Smith RA. Hydrogen peroxide-induced oxidative stress in MC3T3-E1 cells: The effects of glutamate and protection by purines. Bone.
2006;39:542-51. Epub 2006 Apr 17.
14. Hinoi E, Takarada T, Uno K, Inoue M, Murafuji Y, Yoneda Y. Glutamate suppresses osteoclastogenesis through the cystine/glutamate antiporter. Am J Pathol.
2007;170:1277-90. DOI: 10.2353/ajpath.2007.061039
15. Xie W, Dolder S, Siegrist M, Wetterwald A, Hofstetter W. Glutamate Receptor Agonists and Glutamate Transporter Antagonists Regulate Differentiation of
Osteoblast Lineage Cells. Calcif Tissue Int 2016;99:142-54. doi: 10.1007/s00223-016-0129-3.
Accepted
Version postprint
16. Devine A, Dick IM, Islam AF, Dhaliwal SS, Prince RL. Protein consumption is an important predictor of lower limb bone mass in elderly women. Am J Clin Nutr. 2005;81:1423-8. DOI: 10.1093/ajcn/81.6.1423
17. Musante I, Mattinzoli D, Otescu LA, Bossi S, Ikehata M, Gentili C, Cangemi G, Gatti C, Emionite L, Messa P, Ravazzolo R, Rastaldi MP, Riccardi D, Puliti A. Phenotypic
characterization of Grm1crv4 mice reveals a functional role for the type 1 metabotropic
glutamate receptor in bone mineralization. Bone. 2017;94:114-123. doi: 10.1016/j.bone.2016.10.025. Epub 2016 Oct 27.
18. Taylor AF. Osteoblastic glutamate receptor function regulates bone formation and resorption. J Musculoskelet Neuronal Interact. 2002;2(3):285-90.
19. Reeds PJ, Burrin DG, Jahoor F, Wykes L, Henry J, Frazer EM. Enteral glutamate is almost completely metabolized in first pass by the gastrointestinal tract of infant pigs.
Am J Physiol. 1996 270:E413-8.
20. Janeczko MJ1, Stoll B, Chang X, Guan X, Burrin DG. Extensive gut metabolism limits the intestinal absorption of excessive supplemental dietary glutamate loads in infant
pigs. J Nutr. 2007;137:2384-90.
21. Blachier F, Guihot-Joubrel G, Vaugelade P, Le Boucher J, Bernard F, Duée P, Cynober L. Portal hyperglutamatemia after dietary supplementation with monosodium glutamate in pigs. Digestion. 1999;60:349-57.
22. Malet A, Bournaud E, Lan A, Mikogami T, Tomé D, Blais A. Bovine lactoferrin improves bone status of ovariectomized mice via immune function modulation. Bone. 2011;48:1028-35. doi: 10.1016/j.bone.2011.02.002.
23. Bonjour JP. The dietary protein, IGF-I, skeletal health axis. Horm Mol Biol Clin Investig. 2016;28:39-53. doi: 10.1515/hmbci-2016-0003.
24. Devine A, Dick IM, Islam AF, Dhaliwal SS, Prince RL. Protein consumption is an important predictor of lower limb bone mass in elderly women. Am J Clin Nutr. 2005;81(6):1423-8
25. Mao X, Zeng X, Qiao S, Wu G, Li D. Specific roles of threonine in intestinal mucosal integrity and barrier function. Front Biosci. 2011 3:1192-200.
26. Rouy E, Vico L, Laroche N, Benoit V, Rousseau B, Blachier F, Tomé D, Blais A.
Protein quality affects bone status during moderate protein restriction in growing mice. Bone 2014 59:7-13. doi: 10.1016/j.bone.2013.10.013.
27. Bonjour JP. Dietary protein: an essential nutrient for bone health. J Am Coll Nutr. 2012;24:526S-36S.
28. Schönfeldt HC1, Gibson Hall N. Dietary protein quality and malnutrition in Africa. Br J Nutr. 2012 108:S69-76. doi: 10.1017/S0007114512002553.
29. Hildebrand T, Ruegsegger P. A new method for the modelindependent assessment of thickness in the 3D-dimensional images. J Microsc 1997;185:67–75
30. Hildebrand T, Ruegsegger P Quantification of bone microarchitecture with the structure model index. Compu Methods Biomech Biomed Engin 1997;1:15–23 31. Chappard C, Bensalah S, Olivier C, Gouttenoire PJ, Marchadier A, Benhamou C,
Peyrin F. 3D characterization of pores in the cortical bone of human femur in the elderly at different locations as determined by synchrotron micro-computed tomography images. Osteoporos Int. 2013 24:1023-33.
32. Lespessailles E, Chappard C, Bonnet N, Benhamou CL. Imaging techniques for evaluating bone microarchitecture. Joint Bone Spine 2006;73:254–61
33. Boutry C, Matsumoto H, Airinei G, Benamouzig R, Tomé D, Blachier F, Bos C. Monosodium glutamate raises antral distension and plasma amino acid after a standard meal in humans. Am J Physiol Gastrointest Liver Physiol. 2011;300:G137-45. doi: 10.1152/ajpgi.00299.2010.
Accepted
Version postprint
34. Rezaei R, Knabe DA, Tekwe CD, Dahanayaka S, Ficken MD, Fielder SE, Eide SJ, Lovering SL, Wu G. Dietary supplementation with monosodium glutamate is safe and improves growth performance in postweaning pigs. Amino Acids. 2013;44:911-23. doi: 10.1007/s00726-012-1420-x.
35. Karner CM, Lee SY, Long F. Bmp Induces Osteoblast Differentiation through both Smad4 and mTORC1 Signaling. Mol Cell Biol. 2017 Feb 1;37(4). pii: e00253-16. doi: 10.1128/MCB.00253-16.
36. Windmueller HG, Spaeth AE. Intestinal metabolism of glutamine and glutamate from the lumen as compared to glutamine from blood. Arch Biochem Biophys. 1975 171:662-72.
37. Curthoys NP, Watford M. Regulation of glutaminase activity and glutamine metabolism. Annu Rev Nutr. 1995;15:133-59
38. Andriamihaja M, Davila AM, Eklou-Lawson M, Petit N, Delpal S, Allek F, Blais A, Delteil C, Tomé D, Blachier F. Colon luminal content and epithelial cell morphology are markedly modified in rats fed with a high-protein diet. Am J Physiol Gastrointest Liver Physiol. 2010 299:G1030-7. doi: 10.1152/ajpgi.00149.
39. Watford M, Chellaraj V, Ismat A, Brown P, Raman P. Hepatic glutamine metabolism. Nutrition. 2002 18:301-3.
40. Chaumontet C, Azzout-Marniche D, Blais A, Piedcoq J, Tomé D, Gaudichon C, Even PC. Low-protein and methionine, high-starch diets increase energy intake and
expenditure, increase FGF21, decrease IGF-1, and have little effect on adiposity in mice. Am J Physiol Regul Integr Comp Physiol. 2019 316:R486-R501. doi: 10.1152/ajpregu.00316.2018.
41. Ammann P, Zacchetti G, Gasser JA, Lavet C, Rizzoli R. Protein malnutrition attenuates bone anabolic response to PTH in female rats. Endocrinology. 2015 156:419-28. doi: 10.1210/en.2014-1033.
42. Regan JN, Lim J, Shi Y, Joeng KS, Arbeit JM, Shohet RV, Long F.Up-regulation of
glycolytic metabolism is required for HIF1alpha-driven bone formation. Proc Natl
Acad Sci U S A. 2014 10;111:8673-8. doi: 10.1073/pnas.1324290111.
43. Brown PM, Hutchison JD, Crockett JC. Absence of glutamine supplementation prevents differentiation of murine calvarial osteoblasts to a mineralizing phenotype. Calcif Tissue Int. 2011 Dec;89(6):472-82. doi: 10.1007/s00223-011-9537-6.
44. Karner CM, Long F. Wnt signaling and cellular metabolism in osteoblasts. Cell Mol Life Sci. 2017 74:1649-1657. doi: 10.1007/s00018-016-2425-5
45. Huang T, Liu R, Fu X, Yao D, Yang M, Liu Q, Lu WW, Wu C, Guan M. Aging Reduces an ERRalpha-Directed Mitochondrial Glutaminase Expression Suppressing Glutamine Anaplerosis and Osteogenic Differentiation of Mesenchymal Stem Cells. Stem Cells. 2017 Feb;35(2):411-424. doi: 10.1002/stem.2470.
Accepted
Version postprint
Figure legend
Figure 1 Effect of restricted protein diet with increasing amounts of MSG on body weight and body composition.
The mice were fed for 12 weeks with either normal protein (NP) diet (20% soy protein) or with a 6% soy protein diet (low protein, LP), without or with increasing amounts of MSG, and for the positive anabolic control with 1-34 PTH injection (LP+PTH). Body and organs were weighed immediately after sacrifice. A) Body weight B) Carcass weight, C) Total fat mass, D) Uterus weight, E) Kidney weight and F) Liver weight. Data are presented as box and whiskers, n=12 per group. Each group is compared with the others by a one-way ANOVA on repeated measures followed by Tukey post hoc test. Means that are significantly different (p < 0.05) according to the Tukey multiple comparison test have different letters.
Figure 2 Effect of restricted protein diet with increasing amounts of MSG on whole body, femoral and lumbar spine bone mineral density.
The mice were fed for 12 weeks with either normal protein NP diet (20% soy protein) or with a 6% soy protein diet (LP) without or with increasing amounts of MSG, and for the positive anabolic control with 1-34 PTH injection (LP+PTH). A) Evolution of whole-body BMD as function of time. BMD gain was evaluated compared to the T0 values. Values are expressed as mean ± SD, n = 12. B) Effect after 12 weeks-treatment with increasing amounts of MSG or PTH on femoral BMD and C) Effects after 12 week-treatment with increasing amounts of MSG or PTH on lumbar spine BMD. Data are presented as box and whiskers for femoral and lumbar spine BMD, with n=12 per group. Each group is compared with the others by a one-way ANOVA on repeated measures followed by Tukey post hoc test. Means that are significantly different (p < 0.05) according to the Tukey multiple comparison test have different letters.
Figure 3 Effect of restricted protein diet with increasing amounts of MSG on IGF-1, CTX, PINP, and osteocalcin plasma concentrations.
The mice were fed for 12 weeks with either normal protein (NP) diet (20% soy protein) or with a 6% soy protein diet (LP) without or with increasing amounts of MSG, and for the positive anabolic control, with 1-34 PTH injection (LP+PTH). Then IGF-1 (A) and the bone remodeling markers CTX (B), PINP (C) and osteocalcin (D) were measured in the plasma. Data are presented as box and whiskers, n=12 per group. Each group is compared with the others by a one-way ANOVA on repeated measures followed by Tukey post hoc test. Means that are significantly different (p < 0.05) according to the Tukey multiple comparison test have different letters.
Figure 4 Effect of restricted protein diet with increasing amounts of MSG on trabecular bone. The mice were fed for 12 weeks with either normal protein (NP) diet (20% soy protein) or with a 6% soy protein diet (LP) without or with increasing amounts of MSG, and for the positive anabolic control, with 1-34 PTH injection (LP+PTH). Then the bone
microarchitecture was determined. Typical and representative examples of ex vivo µCT reconstruction of trabecular bone in different conditions (upper panel) and in lower panel
Accepted
Version postprint
comparison of (A) The bone volume to the total volume of the region of interest (BV/TV), (B) Trabecular thickness (Tb. Th), and (C) Trabecular number (Tb. N) in different conditions. Figure 5 Effect of restricted protein diet with increasing amounts of MSG on cortical bone. The mice were fed for 12 weeks with either normal protein diet (20% soy protein (NP)) or with a 6% soy protein diet (LP) without or with increasing amounts of MSG, and for the positive anabolic control, with 1-34 PTH injection (LP+PTH). Then the bone
microarchitecture was determined. Typical and representative examples of ex vivo µCT reconstruction of cortical bone in different conditions (upper panel) and in lower panel
comparison of (A) Cortical thickness, (B) Cortical porosity (Ct.Po), and (C) Bone area (B.Ar) in different conditions.
Figure 6 Effect of restricted protein diet with increasing amounts of MSG on bone characteristics.
The mice were fed for 12 weeks with either normal (NP) protein diet (20% soy protein) or with a 6% soy protein diet (LP) without or with increasing amounts of MSG, and for the positive anabolic control with 1-34 PTH injection (LP+PTH). A) Femur length, B) Femur dry weight, C) Ash weight and D) Protein weight. Data are presented as box and whiskers for femoral and lumbar spine BMD, with n=12 per group. Each group is compared with the others by a one-way ANOVA on repeated measures followed by Tukey post hoc test. Means that are significantly different (p < 0.05) according to the Tukey multiple comparison test have different letters.
Accepted
Version postprint
Table 1 Composition of the diet
Ingredients (g/kg of diet) NP LP LP + MSG 2% LP + MSG 1% LP+ MSG 0.5% PL+ MSG 0,1% LP + MSG 0,05% LP+ PTH Soy proteina 183 51 51 51 51 51 51 51 MSGb 0 0 20 10 5 1 0.5 0 Alanine 0 10.47 0 0 0 0 0 0 Nacl 0 6.90 0 3.45 5.18 6.55 6.72 6.90 Corn starchC 584 698 698 698 698 698 698 698 Sucrosee 95 114 114 114 114 114 114 114 Soybean oilf 40 40 40 40 40 40 40 40 Alpha Celluoseg 50 50 50 50 50 50 50 50 AIN 93M mineral mixh 35 35 35 35 35 35 35 35 AIN 93M Vitaminsh 10 10 10 10 10 10 10 10 Cholinei 2.3 2.3 2.3 2.3 2.3 2.3 2.3 2.3 a MP Biomedicals f Lesieur b
Ajinomoto g Prat Dumas
c
Cargil h ICN Pharmaceuticals, Orsay, France
d
Sigma Aldrich i Jefo
e
CristalCo Pro.
Accepted
Version postprint
Tableau 2. Effect of restricted protein diet with increasing amounts of MSG on body weight and body composition.
The mice were fed for 6 and 12 weeks with either normal protein (NP) diet (20% soy protein) or with a 6% soy protein diet (low protein, LP) without or with increasing amounts of MSG, and for the positive anabolic control, with 1-34PTH injection (LP + PTH). Gain of lean and fat mas were evaluated by DEXA between the beginnings and after 6 weeks (6W) or 12 weeks (12W). Data are expressed as mean ± SD, n=12. Means that are significantly different (p < 0.05) have different letters.
NP LP LP + 0.05% LP + 0.1% LP + 0.5% LP + 1% LP + 2% LP + PTH Initial weight (g) 20.1 ± 0.8 19.9 ± 0.9 20.0 ± 0.7 20.0 ± 1.1 19.6 ± 1.0 20.4 ± 1.1 19.8 ± 1.1 20.1 ± 0.8 Weight gain after 6W (g) 1.7 ± 0.2a - 0.2 ± 0.5b - 0.1 ± 0.4 b - 0.2 ± 0.5 b - 0.4 ± 0.5 b - 0.1 ± 0.5 b - 0.2 ± 0.6 b - 0.2 ± 0.6 b Weigth gain after 12W (g) 3.8 ± 0.4 a - 0.2 ± 0.4 b 0.4 ± 0.5 b 0.8 ± 0.6 b 0.7 ± 0.6 b 0.0 ± 0.5 b 0.1 ± 0.8 b 0.1 ± 0.3 b Lean body
mass gain after 6W (g) 0.9 ± 0.3 a - 0.7 ± 0.2 b - 0.6 ± 0.3 b - 0.7 ± 0.2 b - 0.3 ± 0.2 b - 0.3 ± 0.2 b - 0.4 ± 0.4 b - 0.2 ± 0.3 b Lean body
mass gain after 12W (g) 1.8 ± 0.2 a - 0.2 ± 0.4 b - 0.3 ± 0.2 b - 0.3 ± 0.2 b - 0.2 ± 0.4 b - 0.2 ± 0.3 b - 0.4 ± 0.5 b 0.0 ± 0.3 b Fat mass gain
after 6W (g)
0.7 ±
0.1 1.0 ± 0.2 1.5 ± 0.3 1.2 ± 0.3 1.2 ± 0.2 1.4 ± 0.3 1.4 ± 0.4 1.0 ± 0.2 Fat mass gain
after 12W (g)
2.0 ±
0.1 2.6 ± 0.4 2.1 ± 0.3 2.8 ± 0.4 2.6 ± 0.3 2.0 ± 0.1 1.9 ± 0.2 2.5 ± 0.2
Accepted
Version postprint
Table 3
Plasma amino acid concentration after ingestion of a 1g meal
LP LP + 0.5% LP + 1% LP + 2% NP Ala 553.3 ± 33.7a 555.9 ± 57.1a 526.2 ± 48.7a 718.4 ± 97.8b 575.4 ± 71.4a Arg 50.9 ± 7.7 a 51.9 ± 4.7 a 54.1 ± 4.0 a 48.3 ±3.4 a 125.4 ±9.9 b Asn 60.1 ± 9.8 a 60.0 ± 4.2 a 59.1 ± 4.3 a 71.3 ± 9.4 a 149.07 ± 19.7 b Asp 2.69 ± 0.78 a 3.01 ± 0.72 a 3.12 ± 1.02 3.24 ± 1.27 a 3.98 ± 1.45 b Gln 343.3 ± 38.8a 357.7 ± 26.5a 428.9 ± 26.4a,b 512.1 ± 68.2b 684.8 ± 91.6c Glu 57.8 ± 7.0 a 58.2 ± 3.2 a 59.9 ± 4.8 a 54.8 ± 3.2 a 99.9 ± 13.7 b Gly 172.5 ± 20.8 a 171.2 ± 11.0 a 195.6 ± 13.4 a 184.3 ± 13.3 a 259.3 ± 24.8 b His 51.0 ± 9.32 a 51.1 ± 3.38 a 54.4 ± 2.8 a 55.5 ± 5.0 a 75.54 ± 6.4 b Ile 35.6 ± 4.2 a 34.0 ± 3.8 a 35.8 ± 2.8 a 38.7 ± 4.8 a 119.6 ± 11.6 b Leu 37.1 ± 6.4 a 37.9 ± 4.8 a 36.9 ± 4.6 a 41.1 ± 5.1 a 160.1 ± 15.1 b Lys 211.0 ± 23.6 a 201.6 ± 15.1 a 204.9 ± 26.8 a 198.0 ± 15.2 a 369.09 ± 38.8 b Met 26.2 ± 4.0 a 26.6 ± 2.4 a 28.2 ± 2.8 a 29.2 ± 2.0 a 65.1 ± 5.3 b Phe 41.8 ± 6.2 a 40.7 ± 4.5 a 42.4 ± 4.1 a 44.7 ± 3.3 a 87.5 ± 6.8 b Pro 92.7 ± 8.5 a 93.3 ± 6.8 a 92.2 ± 8.2 a 105.2 ± 11.7 a 165.8 ± 16.2 b Ser 139.8 ± 11.6 a 133.7 ± 8.8 a 137.5 ± 11.8 a 127.0 ± 16.0 a 214.8 ± 22.0 b Thr 113.8 ± 15.2 a 115.4 ± 9.2 a 127.8 ± 7.0 a 127.9 ± 10.2 a 329.9 ± 27.8 b Trp 57.7 ± 10.6 a 58.1 ± 8.0 a 63.1 ± 12.6 a 57.5 ± 8.1 a 121.8 ± 13.8 b Tyr 33.9 ± 4.9 a 26.1 ± 3.8 a 29.5 ± 5.4 a 29.9 ± 5.8 a 97.6 ± 9.2 b Val 76.8 ± 4.9 a 80.8 ± 9.0 a 86.6 ± 4.9 a 87.6 ± 6.5 a 304.1 ± 31.1b The mice fed with either the normal protein (NP) diet (20% soy protein) or receiving the low protein diet (LP, 6% soy protein) without or with increasing amounts of MSG, received a 1g-test meal, and the blood was recovered 90 min after the ingestion of the meal for amino acid analysis. In the LP group (not receiving MSG), mice were supplemented with an isonitrogenous amount of alanine. Data are expressed as mean ± SD, n=12. Means that are significantly different (p < 0.05) have different letters.
Accepted
Version postprint
Table 4 Effect of restricted protein diet with increasing amounts of MSG on bone microarchitecture characteristics and hydroxyproline content.
Trabecular bone parameters
NP LP LP +0.5% LP +1% LP +2% LP +PTH
Cortical bone parameters BS/BV (mm-1) 44.66 ± 1.17a 59.72± 1.21b 55.72±1.68b,c 51.55± 1.68c 49.81± 1.05a 47.35 ± 0.78a Tb.Sp (µm) 274 ± 6a 409 ± 14b 374 ± 15b,c 336 ± 13a,c 312 ± 10a 294 ± 9a SMI 2.12 ± 0.04a
2.64 ± 0.05b 2.52 ± 0.07a,b 2.50 ± 0.07a,b 2.42± 0.08a,b 2.28 ± 0.06a
DA 1.76 ±
0.06
1.92 ± 0.20 1.83 ± 0.14 1.74 ± 0.08 1.69 ± 0.12 1.73 ± 0.06 Cortical bone parameters
B.Ar (mm2) 0.971 ±0.020a 0.806 ±0.009b 0.840 ±0.010b,c 0.858 ±0.014c 0.856 ±0.009c 0.894 ±0.011c Av. Inertia min (mm^4) 0.109 ±0.003a 0.081±0.002b 0.091 ±0.003b,c 0.090±0.003b,c 0.097±0.003c 0.099 ±0.003c Dia ext AP (mm) 1.67 ± 0.03 1.58 ± 0.14 1.61 ± 0.07 1.60 ± 0.06 1.63 ± 0.06 1.61 ± 0.05 Dia ext ML (mm) 1.15 ± 0.04 1.09 ± 0.03 1.12 ± 0.03 1.11 ± 0.03 1.13 ± 0.04 1.10 ± 0.05 Bone characteristics Proline mM/mg protein extract 137.2±16.5 125.6±22.2 124.8±30.2 122.2±23.8 137.7±23.4 130.9±14.5 Hydroxyproline mM/mg protein extract
2.8±0.4a 0.7±0.1b 1.5±0.4b,c 2.0±0.5a,b 1.9±0.4a,b 2.2±0.3a,c
The mice were fed for 12 weeks with either normal protein (NP) diet (20% soy protein) or with a 6% soy protein diet (LP) without or with increasing amounts of MSG, and for the positive anabolic control, with 1-34 PTH injection (LP + PTH), and then the bone µCT characteristics and hydroxyproline content were determined. Values are expressed as mean ± SD, n = 12. Each group was compared with the others by a one-way ANOVA on repeated measures followed by Tukey post hoc test. Means that are significantly different (p < 0.05) according to the Tukey multiple comparison test have different letters.
Accepted
Version postprint
Accepted
Version postprint
Accepted
Version postprint
Accepted
Version postprint
Accepted
Version postprint
Accepted
Version postprint