Antibody drug discovery: From Idea to Biotherapeutic Molecule
ByKatherine A. D. Davis
B.S. Mechanical Engineering & B.A. Medieval Studies Rice University, 2011
SUBMITTED TO THE DEPARTMENT OF MECHANICAL ENGINEERING IN PARTIAL FULFILLMENT OF THE REQUIREMENTS FOR THE DEGREES OF
MASTER OF SCIENCE IN MECHANICAL ENGINEERING AND
MASTER OF BUISNESS ADMINISTRATION AT THE
MASSACHUSETTS INSTITUTE OF TECHNOLOGY JUNE 2016
@ Katherine Davis All Rights Reserved
MASSACHUSETS INSTITUTE
OF TECHNOLOGY
JUN
0
2 2016
LIBRARIES
ARCHVES
The author hereby grants to MIT permission to reproduce and to distribute publicly paper and electronic copies of this thesis document in whole or in part in any medium now known of hereafter created.
Signature redacted
Signature of Author:
Certified By:
Department of Mechanica Engineering and Sloan School
____________
Signature redacted
Retsef Levi, Thesis Supervisor
Certified By:
Accepted By:
J. Spencer Standish Professor of Operations Management and Co-Director of LGO Program
______________
Signature redacted
Daniel WhitheyJ1sis Supervisor Senior Research Scientist, Emeritus, MIT Institute for Data, Systems and Society
Signature redacted
Rohan Abeyaratne, Chairman of the Committee on Graduate StudentsA
Accepted By:
Department of Mechanical Engineering
Signature
redacted
r
-(gvauraHerson, Direct'~r of MIT Sloan MBA Program
MIT Sloan School of Management
I- - I
Anti body
drug
discovery: From I
dea to
Bi otherapeuti
c Molecule
by
Katherine A.D. Davis
Submitted to the Department of Chemical Engineering on May 20,2016 in partial fulfillment of the requirements for the Degrees of
Master of Science in Mechanical Engineering and Masters of Business Administration
Abstract:
Graybel (a fictitious name used for privacy reasons) is a large developer of pharmaceuticals. GrA'bel'j Antibody Protein Engineering Group (APEG) is responsible for early stage drug development of biotherapeutic molecules. Part of this responsibility is delivering high quality molecules while meeting tight deadlines. Across the industry there is constant pressure to decrease timelines, while at the same
time the complexity of molecules is increasing. In order to meet this challenge, APEG must be highly
adaptable. Unfortunately, unanticipated biology, long project lead times, unpredictable workflows and inadequate workflow tracking systems make it difficult to precisely determine what causes delays. This
uncertainty, combined with the inability to quickly pilot changes to process or methodology, makes each potential change both risky and costly. The goal of this project was to provide APEG with two things: the
knowledge needed to build a robust workflow tracking system and simulations that would assist in finding root causes of issues and allow for low-cost piloting of potential solutions. Combined, a workflow
tracking database and decision tool would greatly reduce the risk associated with implementing
changes, allowing APEG to adapt to meet increasingly difficult industry standards.
Multiple avenues were used to collect the data needed on APEGT[]workflow. The primrYy[Duirceof data is interviews, with both management and experienced bench workers. These interviews provided data
on workflow paths and estimates for workflow stage durations that could not be found elsewhere. In
addition, they provided a way for APEG members to be involved in the project. Additional data was gathered from rudimentary systems that are used to track workflow within some functional groups. This
data was then used to create detailed process maps, and simulations. Once validated, simulation results were analyzed and experimented with to determine current bottlenecks, potential future issues and possible fixes for these problems. In addition, a new metric was introduced for quantitatively evaluating the difficulty of a project called the Technology Readiness Level (TRL). Essential project decisions were identified, and recommendations made to track those issues. Bottlenecks were identified through queue analysis. Potential changes to fix these and other issues were piloted to determine effect. Future states, both with and without these changes, were simulated to determine potential problems. From this, causes of current and potential future delay were identified and recommendations developed.
Recommendations included staffing changes, cross training, real-life piloting and developing a deeper
understanding of certain processes.
The author wishesto adwledge the Leaders for Gobal Operations Progcam
for its support of this work
Table Gf Contents
Ab5tract,... ... - ... ... ... - ... ... ... ... - .2
Chapter 1: Introdudion ... -- ... - ... ... --.- ... ... 7
Project O verview ... ... ... 7
APEG Backg ound and Prrject Objective ... ... 9
Scientific ... ... ... -.- ... --- ... 10
Generic Drug Cliscovery.... ... - ... ... ... ... ... ... _ 10 Anti bDdy Drug Devdoprm nt... I ... ... 11
Chapter 24. ProcessAnalysis Challenges ... ... -.- ... ... - .13
Caff pl ex I nterconnected Process ... ... 13
Overal I Process Understanding ... ... ... ... - 14
M culty Deterrrini ng M etrics for Smcess. ... ... -- ... 14.
Accountabi I ity, Ownersh p, and Competi ng Objectiw s ... ... ... -... 15
M anacem ent Changes& Staff Restructuring ... ... 17
Chapter 3: SDlution Approach ... ... _ _... 19
Process M appi ng ... -- ... ... ... 19
M odeling ... ... ... ... ... 21
Chapter 4- Co rTple>dty FratTem rk Devd opment ... ... ... _.. 24
-r MNX-.- rf J -4- Ancir-- -NA * YVVLa XJI X.AJI I tJSIEZ:" Ly C& t-4 ... ... ... ... ... z-+ Purpose of Fram ework ... ... ... 24
Fram ework DeM o pn-ent ... ... 25
Chapter 5, SolLtion Development and Results ... ... -- ... ... 28
Proce% Bo oration ... ... ... ... 28
... ... -- ... 28
Data Gathering and ... ... -- ... ... -- ... 29
Process Flow M appi ng ... ... ... ... 29
Examiple Process M ... ... '! n Process ... - - ... ... ... ... 31 Data ... ... 31 SirnJabon ... ... ... - ... 32 ... 34 Page 14
M .odel As uTpb ons ... ... 35
m odel ... ... I ... M M odel Experi m entalion ... 36
Exam ple M odel Malidakion and Experimentation ... 38
Chapter 6. Recom n-endations ... 41
I n-# en-ent Fr&m vork ... ... ... 41
Data-Traddrig ReconTnendations ... 41
Reoornrrended Future Changes ... ... 42
... 43
Appendix A Prooess M aps and Data Details by Group ... 44
Section a. Overall ProcEffi M ap ... 44
Section A-1: Group.A... ... ... Section A.2: Group 131 ... ... 46
Section A 3: Group B2 ... ... 47
Section A.4: Group C ... 48
Section A.5-. Group D ... ... 49
Section A & Group E ... 50
Appendix D. Results by Group ... 51
Section R I Group ... ... 51
Prelim i nary Results ... 51
Queue Am ount Shapshots/day for 100 years ... ... 52
Proposed Bottlev & at Step 5 Fixes ... ... I ... F3 Effectsof IRI-Vadation...-... ... ... ... 55
AM ysis of Future and Step 5 ... ... . ... 56
Section B.2: Group 131 ... 58
Prel in-i nary Results ... ... 58
Queue Am ount ShapshoN day for 100 years ... 60
Effects of Usi ng Step 5.2 ... 62
Effectsof Analysis of Futm e and a ep, 5 Distribution ... ... 65
Section B.3: Group B2
67
Queue Amount 9nashots/day for 100 years.-... . ----... 68
Proposed Bottleneck at 5tep 5 Fixes....-.. ....-...-...-.. 69
Effects of ITRL Variation.-... --...-... ...---.... 70
Additionas Staff at step 5 and Harder Future...-...~.-....--72
Section 8.4: Group C...-..-.-...---- --...---.. 73
Pre.im.naryRsuts...--...7
Queue Amount Snapshots/Day for 100 years... ... 74
Effects of TRL Variation.... ...-... --... 74
Section B.5: Group
D...
-- ....77
Preliinary Results... .. ... . . ... ... 77
Queue Arount Snapshots/day for 100 years...-..-78
Effectsof TRLVariation ... ... ... 79
Section B.6: Group E ... -...- ----... 82
PreliminaryResults. ...---.... .82
Queue Arrount Snapshots/day for 100 years ... ... ... 83
Effectsof TRL Variation ...-... ... . . .. .-...--. ... 83
Analysis of Extra aff for Lower Branch.. .. ... 87
Works Cted... .. ...- ... ....- --... 0
Pace
1
6Chapter 1:
Introduction
Project Overview
The goal of this project is to provide pharnaorrpany Graybel'd(name disguised) Antibody Protein Engineering Group (APEG) with tools to reduce their drug development tineli nes while maintaining
quality by inproving their proceses. Drug disovery isa omplex eperirnental process with inherent rework and churning that cannot be avoided. APEG is responsible for antibody based drug disovery,
which has two development paths called In-Vvo and In-Vitro. In-Vivo development is conducted utilizing the immune reactions of animals, and In-Vitro developnent is entirely laboratory based. [bth of these
methodsare utilized by APEG. APBGisdMded into 7 fuctional goups, which forthe purposesof this thesiswill be called GroupsA B1, B2, C, D, Eand F. GroupsA-Ewill be etensively anayzed; Group Fwill not, dueto its small sizeand theeAremelytechnical processesthat it is responsible for.
A nubTer of challengelwere encountered while analy~fngAPEG] procEDTl APEG'procieffiocomplex
and extrermely interconnected. At a high level, flow is generally linear, but this is very deceptive. A given project will bad drack multiple timesthroughout its development cyde, transitioning between groups and churning within those goups. This is partially due to the aforementioned inherent variability of
experimental drug li[overy and partially due to artifidal variability due to APEGOT] proce[Ijand Graybel']overall organiFption. Combined, these introduce extreme variability into APEGsdevelopment
timelinesthat is difficult to predict. This is compounded byAPEG'ltfractured undeianding of ito
processes. Exectiveswithin APEG understand thing a a high level, but are rrissing details Bench workers (the scientific equivalent of front-line workers) understand the detailsof their own process, but may mi[flthe bigger picture, and do not underfand the detaillof other group'oproce[I{J Management within APEG'groupoiiin between the two, but foctod within their own goup. As a result, there is no one who understands the entire picture at both the high and detail levelsfor all goups There isa general lack of workflow tracking data that maks obtaining this understanding nearly impossible Bench workers are tom between competing rnetricsfor suoessfor APEG and other Graybel Groups involved in the project, which makes it difficult to deterrmine where improvements should occur and healy
influences APEG's project load. In addition, there are emergent autornation opportunities which may be benefidal to APEG']proce[iM but they require extensive capital investment and may not be fully utilized byAPEG scientists, making it difficult to determine which are worthwhile. On top of all this,
APEG had undergone restructuring during the last year, which has resulted in the formration of new
goups and the fusing of old groups. Many of these new groups hae not Wt fully established their processes and have no history, which makes analyzing them difficult.
Extensive proce% mapping was done in order to gain an understanding of APEGs process. Bench workers, management and executives representing all groups within APEG were interviewed for 2-3 hours each to build these process maps. These interviews served multiple purposes: (i) anecdotal information gathering; (ii) involvingAPEG rrembers with the process to obtain bWin; and (iii) obtaining understandingof the process at multiple levels. Intervews concerned workflow paths, step durations, identification of decision points and gatheri ng of docurrented historical data, which was only available for Groups A and E The resulting data was then analyzed and used to estimate duration of process
steps Process Maps were then created and contributors were re-interviewed to ensure acracy. Typicallythis resulted in 2-3 revisions of the process map, with a final product that all goup members
ageed upon. Process maps were built at three levels; Leie 1, the executive le\eA, was rreant to represent an overal1, generally linear interpretation of the process that an executive would have. Level 2, or management leve, mapped the general steps within each group, as management would see them Level 3, the bench level, was the rrost complex and represented actual bench work done.
During interviews, it becarre dear that APE3 needed aformalized framework for evaluating and communicating individual project complexity as project complexty heavily influenced project set duraion and repetition likelihood. Interviews identified three characteristics that contr buted to cornpexty (i) disease complexity (ii) solution corplexity; and (iii) solution platform conplexity. A
frameworkwas developed based on these three characteristics, called the Technology Readiness Level (TRL) framework. The framework consisted of 3 axes, each one dedicated to the aforementioned
characteristics. Cbmplexity was indicated nurrrically from1-3, with 1 being easy and 3 being hard, for
each ax[ 'EW', VMedium' and 'Hard' were defined bythe arrount and quality of exiing prior work applicableto the project. Thisthen igives umulative TPLvalues from3-9, with 8-9 being hard, 5-7 being
medium and 3-4 being easy. This gave a defined method for evaluating overall project difficulty aswel as a built-in rrethod of breaking down that conplexity into informativecorrponents This could then be used to evaluate APEG'capaity and im-prove internal and external cormunication.
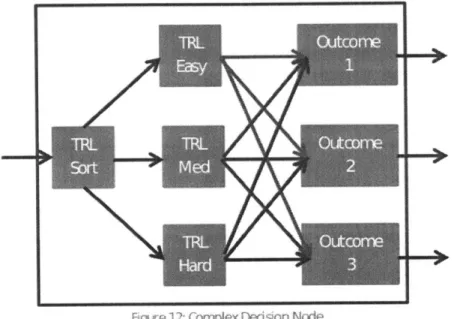
Srmuations based upon the process map and TRL lewIs were then built. The process maps were used to
build workflow paths and deterrrine stepduration. The previously discussed TRL determined the
outcomes of decisions and duration of steps which were often dependent on project difficulty. The simulation modeled rework and churning as part of these decisions; a potential outcome was often "return to previou[jep." Thorough the simulation building additional interviews were conducted when
necesxry to obtain estimates of needed values. Some values had to be deterrmined ermprically through sirrulation experimentation. Smuiations were then validated iterativey through comparison to
historical and anecdotal data and additional interviews Due to lirrited data for some goups, perfect accuracy could not always be achieved.
Once the simulations were validated, analysis and experimentation were conducted to identify
bottlenecksand potential solutions This identified bottlenecks of varying severity in four groups, one of which would greatly benefit from additional personnel or autornation. Further experimentation was then conducted with TRLvariations, testinga total of 9 potential variations, The first three were the slight variations on the current situation, designed to deternine sirrulation sensitivityto TRfLvariables Then extreme TRs were tested, to ensure that the simulation reacted appropriately and give an idea of
the responsivity that should be expected for the last three TPLs The last three TRLs were designed to test potential future TRLs. These TRLs revealed another bottleneck in Group E, which is currently being
hidden by Group E utilizing extreme effort to maintain production times. Potential future TRLs were also
tested with potential improvements, to ascertain potential future impact of those changes
Overall, the project delivered 3 recommendationsto APEG along with the sirnulations themselves First, irmpantation of the TRLfrarrework, which is aflexible, qualitative and nuanced method for evaluating
project difficulty with a number of potential applications. In addition, it can be used to comrnunicate nuanced understandings of project difficulty in an easy to understand manner. Second,
recorrrnendations on what data should be tracked in order to best understand their processes Finally, recorrrmendations on process changes that could potentially benefit their work and accorrpanying information on where to watch for developing problems.
APEG Back ugr ud andk11 r ojec kbed
Graybei' ilone of the world'oleading pharnaceutical companiel] Within Graybel is the Antibody
Protein Encjneering Group (APEG), an P&D qoup located in the U.S. In order to understand Graybel and APEG[motivationQ goa nd operatior]it ilimportant to underitand drug di[Dovery and
Biotherapeutics. Drug discovery is a corrplex, costly process. APEG is responsi ble for supporting early drug-discovery; from idea to pre-clinical validation. Within the organization, theyare positioned as shown in Figure 1.
I
SI
A, an R&D group, APEG'Oproce:iflhiclyvariable and prone to changejand culoi[ption to rneet project sped fic needs. The projects that they are responsible for are increasing in complexity and difficulty. Consequently, in spite of their highly intelligent, experienced workforce, it is becoming increasingly challenjng to maintain and improve project compOetion times. APE'goal i[to shorten their cyde times without negatively irrpacting quality or greatly increasing cost. Paul, et al. suggests four
methods for shortening drug discovery R&D cyde time.
1, Use cydetirre (i.e. how long it would take to develop the drug) as part of the dedsion to develop a drug
2. Identify the critical chain of project tasks and adapt as needed
3. 1 rrprove processes
4. Reduce wait times (Paul, et al, 2010)
It is the goal of this project to assist all of these methods through the creation of process maps and simulations. Process maps will be used to identify critical tasks and how they connect, and then used as the basisof the simulations. The sirulations themselves will allow APEG to independently test the
potential impact of future changes Finally, the sirnulations will be used to identify bottlenecks and recommend methods for fixing them
Narre obscured for confidentiality
Ud Unif Back ground, cl
There are three stages of drug developrnent: (i) Drug Discovery; (ii) Pre-Ginical; and (iii) Clinical (See Figure 2). This project concerns the first.
Kr
Phase I
Dev opr-Xt zhase 3
Submission Total 13 5 $877,8
Drug discovery consists of three stages. Prior to the process start, a potential rrolecular target assocated with the disease is identified, generally by academria or internal ly within the organization.
During this pre-step, , the target is evaluated in rnuItiple in-vAitro and in-vivo experimental laboratory
systerrs designed to confirm the assodation of the target with the disease (Kumar & Gopinath, 2013)
Step 1 of drug discovery is Target to H t, the first section in Figure 2. i ts are molecules that meet the basic requirenents to potentially treat the disease, such as chemically reacting to the target in favorable ways The second step is Lead Identification, the second section in Figure 2. This stage consists of taking a wide array of potential treatment rroleculesor "Hit{' and putting them through repeated tests to narrow down the nunter of potential molecules. For exarrple, finding the molecules that bind most strongly to the target. Step 3 is Lead Optimization, the third section in the above figure. This involves iteratively engineering the rrolecules to irrprove their properties, rmost often potency in mrodels of the disease. At the end of these three stage a drug candidate is selected. This is the best rrolecules to potentially treat the disease. This isalso done through iterative testincj some of which is done in animal rmodels of the disease. After a candidate is selected, Preclinical trails can begin. (Kumar & Gopinath, 2013) There are rrultiple approaches to developing mrolecular entities, from small-molecule or rredidnal chemistry to large rmlecules. .Certain methods are more suitable for certain target types than others. (Hughes, Rees, Kalindjian, & Philpott, 2011)
Drug developnent as a whole is significantlyirmpacted by the daffc trade off of doing thinj] the 'right' way or doing thingsasquiddyas possible. The drug development industry is hihily rrotivated to shorten drug developrrent tirres, and n-uch enphasis is placed on being the first treatment to market.
Additionally, it is irpossible to deterrine if a potential drug will be a successful treatment until the corrpetion of human trials. A molecule that successfully treats adisease in a laboratory settingand in animal models can easily experience conplications when used in humnsthat make it non-viable.
Success in the lab and animal models increases the probability that a potential drug will be successful in humans, but does riot guarantee it. Consequently some companies evaluate success based on the number of molecules that proceed from one step to the net, rather than level of success from tests performed within that step. (Paul, et al., 2010) For example, say that a rolecule that reaches the end of drug developrrent hasa 50/ochance of successfully working in hurrrs. Producing more rrdecules results in a higher chance that a treatment will be successful in dinical trials With a 50%osuccess rate for each individual molecule, 3 molecules would have an 88/ochance of produdng a viable drug As a result, some incividuals within the industry view quantity as a rmore significant factor in eventual success in human trials than tests in anirmil modelsand laboratory settings. It istherefore cormon to use time and quantity of rrleculesas metricsof successes within the industry. It is important to note that quality estimations provided by testing are still important; increasing the nurrberof moleculesto 3 while decreasing the individual molecule success chance could negatively impact overall success rates. If individual molecule success is reduced to 25%due to decreasing testing times negatively impacting quality of tests, having three molecules would only return a 58%success rate. In order to achieve an 87%success rate, 7 rolecules would be needed. Thus developing methods to improve molecule quantity and development timeswithout affecting the quality analyss provided through testing is extremely important.
Anti body Drug Development
One approach isdeveloprrent of biotherapeutic molecules, which is APEG'[]pecialization. One of the most common biotherapeutic rrolecules is irmuresystemproduced antibodies. Antibodies are thought to be lesstodc than chermically synthesized small molecules, but due to their relatively large size and the resulting inability to penetrate cells, they are typically used to modulate the activity of cell surface and secreted disease associated targets. In other words, issues that can be treated from outside
a cell. (Hughes, Rees, Kalinjian, & Philpott, 2011) There are two primary methods currently in use for
antibody dscovery. The first, ln-Vivo, relies on targeted immune system reaction. An animal analog typically a mouse, is injected with the target rolecule. Once the animal'[immune [Wem react[] appropriately to the target, it is culled and its antibody repertoire extracted. Subsequently, the repertoire of molecules tested and lead molecules selected. It is important to note that this process produces non-human molecules, which mrust then be "hurranized" to yield a biotherapeutic drug for uFg in humans (Nelson, 2000) The other method, lnVitro, does not inove any animals Instead, they begin with a nai\e2, pre-built, humar-based libraryof tens of rmillions of antibody molecules These molecules are run through a series of tests, each test reducing the number of potential molecules. Eventually, these tests determine the lead molecules. (Stowell & Ddk, 2003) In-vivo and In-vitro methodsare compared in Figure 3. Lead Optimization for these two methodsfollows essentially the same process once the in-vvo molecules have been humanized.
2Naive in this case means the hunns who donated antibodles to the Iibrary who have not been specifically
exposed to the target protein
S*db a I- W
100% numan molecules Non- uman miolecuies
Tends to Jo r potency Tends to higher potency
otecy optimization needed Molecule I unile ioneeded Ex: :A n nage Diay n NEx, Hybridoma
APEG and Graybel operatewithin acomplex, changing rrarket that requires carefully balancing adaptability, cost and long lead tirnes. Graybel has rmany different potential rnethods of developing
drigs; Biotherapeutic antibodies are APEGOniche within the organi[ption. Antibodies, in general, have two rrethods of developrrent- In Vivo and I n\tro, each with its own unique benefits and challenges
APEG is responsible for both of these, as well as optimization of its rrolecules.
Chapter 2: Process Anal ysis Cha Ienges
When trying to irnprove its processes, APEG faces a variety of challenges 1Their process is highly complex, with steps connecting through a corrplex web of decisions. This rmakes it difficult to separate the inherent variability of drug discovery from the artifidal variability introduced by APEG']proce[BAO There is currently rrinirma workflow tracking, and varying understanding of APEG'toproce[IIat different levels of the organization. Balancing the competing objectives of quality, time and
custorrization is increasingly difficult. Accountability and ownership by goups with different
motivations leadsto inconsistent direction and mi'ed signals. Emergent automation has the potential to be revolutionary, but is difficult to evaluate and irrplement. Recent managernent changes and
restructurings have resulted in some very new groups who are not yet fully accustomed to their roles.
Comr
ex In
Oeted r! c
APEG' rrolecule development is a complex, hig'ily interconnected process. A deceptivelysinpe np of
APEG'[]overall process can be found in Appendix A., where it is discussed in detail, and is reproduced below in Figure 4.
Group BI Group D
G ro u p a.Gr A Group E Group 0
(E xtema ) __._Exena
Group 82 Group C -7 (xenf
The general process flow is as follows:
1. An external goup (G-oup a) initiali[o~a project
2. Group A becjns the project
3. Group 1 or B2 (or, in rare cases, both B groups) then take over 4. Any work done by Group 82 proceeds to Group C
5. Any work done by Group 81 and some ({jtirnated at 70%) of Group C vork
proceeds to Group D
6. All work done in Group D and the rerraning work at Group C proceed to Group E
7. Work done within Group E is passed to an the external group responsible for the
next stageC] in the development proce[f] (Group )
However, the process is much rrore complex in practice. Each substep within a goup may fail, and sorre
of those failures will send the project back to a previous goup instead of sirmple internal backtracking.
For exarple, it is possible, though sorrewhat unlikely, for something to fail in Group E and send the
project all the way backto Group A. Moreover, a project could progess down the B1 path, fail, and then
be sent to B2. Additionally, while throughout this paper a project will be referred to as a singular entity,
in reality a project may be comprised of a nunber (between 1-10,000 depending on project stage) of
incividual rmlecules, each of which nmy occupy a certain stage, and only some of which nyfail a given step. In otherwords a project may have moleculeswith Groups C, D and E at the sametime, or virtually any other combiination. In addition to this, Group A occupies a specific niche within the organization which rmakes it particulady mssion critical. It may be called on at any tine to assist any other group3, in
addition to its own work Thus, delays in Group A can affect projects at any stage.
Additionally, APEG is responsible for a portfolio of projects and a percentage of projects are canceled each year. This can occur for many different reasons, among which are: (i) upper rmanagernent stratecjc decisions; (ii) the project being deemed non-viable due to new scientific knowledge; and (iii) project success through a different disorvey platform in another group (such as sral I molecules). These projects are replaced with new projects, so the total number of projects is fairly consistent.
Appendix A Sections 1-6 gves detailed (though still simp0ified) process maps for each group, as wlI asa
description of the group itself and how it interacts with the rest of the organization.
C-rl P rcess UnIstning
In addition to these intricacies, presently there is no uniforrm corrprehensie and robust tracking system
capturing the breadth of activates in place at APEG. A subset of groups have primitive databases to capture project workflows tasks, and applied employee resources In contrast, other groups do not directly capture and trackspecific tasks in their workflow; instead, tasks and time spent per taskcan only be inferred from high-level employee logs. These logs capture the relative amount of time devoted to any giwen project by person, and knowledge of which tasks a group or i ndiMdual preforms can then be used to approxirmte amount of tinre spent on each project task for each person. This methodology is, however, inconsistent at best, unreliable, and analysisistime consuming.
Fortunately, APEG is composed of intelligent, highly experienced sdentists. As a result, most groups have very cpod tribal knowledge of their own processes, and the naority of manaiers have informally analyoEgd their group'oproc[fjin [pnre way in the le 3 year There is a wealth of anecdotal
information available. Unfortunately, anecdotal evidence has a few well-docunented issues. Generally, it is considered the least reliable type of information. (Riffenburgh, 1999) Some believe that it is nearly useless, due to the effects of potential bias, assurned causal links, and other idiosyncrasies of the person
providing the anecdote. (Sicherer, 1999) To counteract the inherent unreliability of anecdotal evdence,
information for this thesis was gathered froma wide variety of people at all levels within each group.
In addition, Groups A and E track workflow internally within Emcel spreadsheetsor databass
Unsurprisingly, these groups also had the rost rigorous process understanding and the rrost tire-sensitive tasks Detailson data available by group can be found in AppendixA
Dificu t termin ing Mq tri cs f orSces
In addition to data-based challenges, APEGO culture also presents conplications. APEG personnel are
highly intelligent, independent scientists who through their earlyacaderric scientific training are taught to find individual solutionsto problerrs Asa result, they prefer and m-ore easily implement changesto
3What it is reponsible for when this occurs is
consistent, but essential and cannot be done by another goup Pagel 14
processor rrethodology that are developed based on concrete data, experirmentation or developed themselves. Long project lead times, expensive projects and project atrition make piloting and experimenting with process changes extrerrely difficult. The tack of process data has already been disicussed. This situation makes it difficult for personnel to support changes without empirically grounded, scientific data that endorses said proposed changes- which often cannot be obtained.
As previously discussed, Graybel follows industry standard and evaluates success based on the rrolecule quantity rather than test-based success levels. This method is reasonable for larg mi lestones such as hit or candidate selection, but is much more difficult to apply to less significant steps. Consequently, there is some debate concerning the best rnethod for evaluating these steps; quantity is certainly part of it, as there must be enough moleculesfor the selection milestones, but some additional evaluation metrics, mostly test dependent, have been proposed. The lack of workflow data that makes it difficult to evaluate proposed process charges also rmakes it difficult to determine which of these metrics is significant.
AccountabiHty, Own ership and Cm p eting bjectives
Another aspect of APEG and Graybel'Oculture that impacts potential process iriprovements is the overall attitude towards accountability and ownership Any project within APEG has a project lead who is responsible for the project within APEG and coordinates with the project owner, Group a,
repreFented bya Group a project leader. Group a may not be collocated withAPEG, and may not be knowledgeable regarding the intricacies of APECOwork. The Group a Project leader, the APEG project leader, and both Group a and APEG mnagerent are responsible for all decisions made concerning their project. In ternlof re[pon(Jbility Group a iorougly analogousto a district manager, the project lead to a store ranager and the various APEG subgroups departments within the store. This dynamic affects
project process decisions in two significant ways: the irmplications of successful/unsuccessful projects and balancing the use of standard operating procedures (SOPs) and innovation. Traditionally, S)Ps are used to define a set series of steps that take an expected input and produce an expected outcome. Within APEG, SOPstypically exist at the bench level. For exrnpe, a spedfic test type may have a rnulti-step SOP that is used to determine if the rrolecules tested are toxicto mice. An SOP at this level
generally has an expected duration. SOPs may also exist at higher levels; an exaroe of this is a series of tests and other steps that must be performed to ensure that a potential drug is potent enough. These
higher-level SOPs within APEG are generally not codified, and are only seni-standard. These SOPs
typically do not have an expected duration-there is simply too rmch variation in delivery tirmes.
In drug developrrent, project attrition is cormmon. As a result, risk mitigation is considered very
important to improve the chance of success, and a successful project that actually makes it to market (successfully passing all dinical trials and the FEA) is highly valued by Graybel, Group a and the project
leaders. Hence, project leadergand Group a [rive to have a high rate of success and be fast to market. In addition, Group a [riveoto have as innovative a treatment as possible-developing a
4 Group a refer[]to the extemal group who owrga given project. Group a for project 1rray be different from project 2 jGroup a, etc
transforrmtional treatment for a disease will both benefit the paierts Graybel and likely benefit the
career of the project
In compari[pn, APEGOsubroups desire to provide rroleculesthat are of the highest possible quality, with redudng delivery5 timesa dose second priority. The subgroups are rrotivated to have a high
portion of all projects succeed, but are not vested in the success of specific projects in order to reduce production times, APEG prefers to use bench-level SOPs-which also, as previously mentioned,
rritigates potential problems and ensures a semi-standard quality level. Which SOP is used is afunction of the target, project requirements and what stage within APEG the project is at. However, as each
project'g]al i~to develop roleculefor a unique target, [prre target-dependent custonization is
always required. AJso, the innovative rrolecules delred by Group a often cannot be generated with
SOPs and require etensively spedalized molecules and tests This is typically due to unusual or unique molecules or extreme project requirements Some of these innovative molecules are comrmn enough
to have their own somewhat less developed SOPs, but many of them require fully custorrized
methodologies This high level of process customization has led to a general perception that APEG does
not have SOPs in the traditional sense, because every molecule is different.
The onging conflict created by these competing piorities-quality, custorrization and speed, results in
mixed nssagesfrom bench workers when the conoept of process improvements is raised. Frequent
responses were "we could improve the [peed, but then we won't be able to ctfomioE' or "if we reduce custonization, quality will be negatively impacted" or even, occasionally, "improving qual ity will etend delivery tirres". The consensus seems to be improving in one respect will be detrimental to another and upset the careful balance that APEG currently maintains. The inpact of altering the current situation
maintained with these tradeoffs is unknown, and generally theorized by bench workers to be detrimental. This is a trade-off between quality, time and customzation is a specialized form of the project rranagement trianje, which ill ustrates the relationships between scope, schedule and cost.
Typicai y, on y two of these three objectives can be achieved at one time (Mc~hee & McAliney, 2007).
APEG preferoto focufion quality and [peed, while Group a focuses on speed and custorization.
Emn- ,e rgeni-It A u t omia t io n
Emergent technology has the potential to have a huge irmpact on APEGprocess. In fact, a recent process change that introduced autormtion, an improved process and a new subgroup has reduced the production of test articles by 2-4 weeks. As this is done a minimum of 4 times per project, it has had a very significant impact. This change had three reasonsthat it was successfully irmplemented:
I Group E, who was responsible for this process before it was autornated, was unaffected by
the respective change during the development and irmplementation phase. If something
went wrong, they could resurre ownership with little effort. The process is currently owned
by the new Subgroup G
sDivery times may refer to the ti me it takes to deiver fromone internal APEGgroup to the next or the total time it takejto deliver a project to Group 0. The two rreaning]are [pmewhat i nterchangeable; change in the former
guarantees change of the latter.
2. The change has very dear ti me benefits, and impacted early stages where any minor
reduction in the quality of the test artide produced is less critical.
3. The process is not sorrethingthat is significantly impacted bycustomization. Customization,
if needed, is done before the procss starts. The process itself is consistent for each
rolecule.
This is not true of all potential process automations Automation is expensive, and implermentation can be risky. It is not uncommon for an automation machine to be bought and then not fully utilized, due to unforeseen issues rald ng it urfeasible to fully implenent These issues indude but are not limited to:
- Complex set ups or changeovers that take mo re tirre than is saved with the autorration
- New changeover bottleneds, where only one or two people are certified to irrplement customized process on the m-achine
- Machine down tir, particularly for rachines that do not have a backup
- Inability of post-autortion steps to handle the increased vwrkflow
- Personal preference
Compounding this issue isAPEGlackof an interral process development team devoted to
implementing automation across the department. If automation (or any other proess change) is being considered, it becomes the responsibility of an individual scientist, or siall tea, to investigate the possibility while maintaining their project load. Conseuently, the level of inestigstion and experience of those evaluating automation is very variable; it is entirely possible that this has resulted in potentially successful changes being rejected. As a result, one of the biggest challenges facingAPEG is whether or not to autornate, and how to deterrrine which proom steps would benefit most fromautomation
Management Ch an ges & Staff Re:,structuring
In addition to all of the above, APEG has recently undercpne some organizational changes. The goal of these
changelwato better align to core functionalitie[j but goupoare currently experience typical "tranfltional" challenges. Group B2 and Group C used to be one gioup; they were split in the last year. Group B2']
rranager was also hired within this tirrEfrane. Another subgroup, Group F, who prirnJily provides technical support for the other groups, used to be two groups and was fused within the sare timefrane. As a result,
both of these groups currently have processes that are in flux Group B2 is sormewhat stable, and will be analyzed in this report. Group F, on the other hand, will not. This is partially due to the recent changes
rrade, and also due to the nature of Group F'jwerk and the [Tall 0[ of the group. These changes are summarized in Figure 5, where each box representsa functional group within APEG, and the labels indicate the proces and group memters' who are members of that functional group.
6 Processesand those who preformthemare inherently linked due to the expert knowledge needed to perform
such tasks
Previous Group Structure
L-. N11"
ME \
IF--"7
These challenges rmake it particularly difficult for APEG to irnplernent process changes. It is very difficult to
change cornplex processes without thorough workflow tracking data Adding in the other complexities-corpeting objectives, management and staff changes, and the potential of autornation to revolutionize everything- makes a difficult task seem nearly impossible. There are, however, ways to sirrplify and cornpartrmentalize this process into something far less daunting.
Page 18
I
Current Group StructureChapter 3: Solution Approach Methodology
The first stepto analyzing a process is, of course, understanding the process. There is no better way to do this than through process mapping Process rnapping breaks a process down into discrete steps that can be understood as a seriesof interconnected units, rather than as atanged web. Once the process is
understood, one can becjn to Iookfor waysto improe the process. In processes with afast turnaround tirre and low cost, this is typcally done through piloting; Drug discory, unfortunately, fits neither of these criteria Instead, sirrulation was utilized. This provides a re-useable tool that can be used to evaluate the overall procss and implement potential changes with little to no cost.
Prces -- Mapping
One of APBG'[weaknesses is the fragmented understanding particularly at the bench level, of exactly what their end-to-end process entails, and the very spedfic responsibilities, workflows and tasks for each subgroup. A given bench worker is extrerrely knowledgeable about their own process and fairly knowledgeable about their group rembers', but may not have the sarre understanding of other goups' proces. As one progrewes higier up the management chain, there is a progressively greater
understanding of the overall process and at the same time a loss of detailed understanding of the compOexties of each task irolved. Lack of quantifiable data at the task level for each subgroup hinders the ability to address issues related to process iprovemets No one person has complete, detai led knowledge for all processes in the department process, and there is no workflow management database to reference to fadlitate the gatheringof the relevant knowledge. Process mapping is an excellent tool with a long history of use in this sort of situation, as it is useful analytically and for cormmunicating the current understanding of a processto group rrefmbers. This is particularly sigificant as, historically, processes are the least understood and managed part of an organization. Additionally, the process of creating the map, independent of outcon, is extremely educational. In order to accurately rmapa process one must dearly understand the resource requiremnts linkages and relationships of all process steps (Hunt, pp. 2-5).
Process mapping is primarily utilized for documenting understanding and teaching processes, but it is also useful for change irrplernentation, as it provides a holistic view of the interconnected process steps.
In essence, a process map creates a shared understanding that can then be used to alter an exsting
processto better suit theorganization and its needs. This is true both within the organization and externally with the organi[ tion'fldiento Often, potential proce[] irmprovementobecome ot\Aoufj]aa map is developed. (Isari, Chang & Seddon, 2003) In general, there are four steps necessary to create a
process map, shown in Figure 6. These four steps assune that the scope of the map has already been
deterrrined.
N
(Graham, p. 150)
Graham recormwends that process npping begin with obtaining buy-in from nanagement, which will geatly facilitate data-gthering Once buy-in is obtained, the next step isto gather data. Ideally, this will first be done through observing indiAduals at work When this is not possible, he recorrmends using recent data. Typically, this is not possible due to long process tirres or physical distance between process steps The next step in data-gthering is to interview experienced workers, as they will have the best understanding of the process. This is esentially the Assetle a Team step in Figure 6. When doing this, it is important to focus on what is occurring at each step, not how it is bei ng done. The attitude of the intervkewer is extremely important; in this situation, it is easy for the interviewee to beceme defensive. It is important that the interviewer be genuine, gTod natured and focused on fact-finding (Graaim, pp. 23-29). Once the data is gathered, it is tirre to Jevelop the Map. ie arm any different
methods for doing this; all of them are acceptabUe. It is inportant that the iap be both understandable and readable to the average layperson. Once the map is built, group meters should Review the Map for accuracy and potential improve-nnts. After the rnp is understood, the team should Dscuss Steps to determine if more detail is needed or there are potential inproverrents (Graharm p. 183).
1adison recorre nds a similar approach. He also purports that obtaining buy in early is extremely important, and recomnends involving people who work within the process both for obtaining buy-in and data gathering. He recogizs three levels of process mappingmacro, functional-activity and task-procedure. Macro charts are the highest level, and generally fairly easy to rrap. Functional-Activity charts are mid-level, and composed of general functions and activities as the name suggests. The most detailed level is tak -procedure, and focuses on the minutia of a single step. Typicafly, these are used for training rather than analysis (Madison, 2005).
One conmon pitfal I of rmpping a process isover-spedfic ation of modeling it is not necessary to fully nxxel every step. While extensive knowledge of the process is recorrmnided to build the mp, the map itslrf must be carefully designed to ensure the optim A level of abstraction n.cessary to the process. (Kesari, Chang & Seddon, 2003)
Due to the current situation within APEG, mopping their current process provides an additional benefit. As previously stated, APEG per[pnnel generally believe that they don't have SOPD In the words of
Steen Spear "[ProceffMapfand oQilartool[] are about execution of [Nandard work... [they] gve you a chance to innovate in a controlled rranner, D you won't introduce additional riJ( into the product." Building process mapsfor APEG requires abstraction to the point that the customization done within
APEG is mostly hidden behind 'black boxes. In other words, the project based custonization is at the
Task-Procedure lael, but generally does not impact the Functional-Activity or Macro levels. The contentson the 'black bo( in thi caFJ are unknown because of inherent variation at the bench-evel in the processcausing changes and adaptations in a wide variety of cases. For any gen project, the contentoof the 'black boxfJ are known. It ijwhen trying to account for all projectl each with their own
unique 'black box' content, that it becomejnece[Wryto obf:ure the exact detaiiUfor darity'f[jfke. In other word atJep may be [rmpyto "run teM3" The specific tests run and the order that they are run
in changes for every project and often cannot be predicted in advance. However, at this point in the process, some tests rmst be run. The bench work for this step is non-standard, but by taking a step back to the Functional-Activity level it is possible to find a standard step in a standard process. As a result, developing APEG process maps codifies AP3'f high-level SOPs
Model
ing
One of the largest issuesfacing APEG is the corrbintion of correxand diverse processes that they are responsible for executing " The rrore different di[fiplinejand [ecialtietthat are ivolved, the harder it becorres to deterrirne a priori exactly who [bould do what, when..It i al[b difficult, if not downright impo[jjble, to predict the WeJem'behavior under the range of drcunstances in which it nuist
perform" (5pear, p. 105) This isone reason that piloting of changes is so comrrmon; another is to obtain
buy-infrom those who doubt that the potential improvement will be truly benefiial. (Hunt, p. 31) However, APEG has a high entry cost for piloting. If a pilot provesdetrirrental, it could have a huge negative impact on the projects it affects. As a result, APEG upper management must be certain that this will not happen before approvinga pilot.
A viable alternative to piloting is sirrulation. Srmulation data can be used to test and validate process
changes at low cost. Additionally, the resulting data can be compared to current process data to determine the expected imnpact of the change; a proposed alteration may be rejected if it is successfuI but not successful enough to justify the cost. The resulting data can be both useful in determining the
correct course of action and is potentially persuasive for those in doubt. (Detty & Yinjing; 2000) Using sirulations to aid in decision mnking reduces risk and assists strategic, tactical and operational
management strategies. (Kellner, Madachy, & Raffo, 1999) The resulting quantitative data can also be used to develop metrics and assodated goals to monitor irrplerrentation success. (Abdulmalek &
Rajgepal, 2007) Additionally, simulation allows for the testing of a wide variety of hypotheses in a short
period of time this makes it much rrore likely that the optimal solution will be found. Srnulation is so powerful precisely because of this flexibility. A wide varietyof scenarios can be tested and analyzed in way that fadlitates corrparison between disparate strateoes and the risk associated with
implementation. (Alsudairi, 2015)
Kellner, Madachy and Raffo determined six prirary reasonsto utilize process simulation: strategc
managerment, planning, control/ operational rrnanagernent, process improverment/technology adoption, Page 121
understanding and training and learning (Kellner, Madachy, & Raffo, 1999). While all of these reasons are sigificant for APEG, the most important are processes improvement/ technology adoption and
understanding at this point in tirre. Oce better workflow tracking is irrplemented, strategic rragerrent, planning aid control/operational management will become more significant. Due to APEGs highly individualistic methods, it is unlikely that training and learning Would be enphasized.
Smrulation is generally used to address three types of complexity (see Figure 7) which rmake use of analytical models difficult or impossible. APEG in particular possess conplexity types 1 and 3 in abundance.
-Such as initializing a new rranufacturing line
-Any situation where astep both influences and is affected by m-Uti pie other steps
(KEi Iner, Madachy, & Pdfo, 1999)
There are, of course, downsides to process modeling The rrst cmmon isover analysis. It is not uncortmn to build a rrodel with data that issorrewhat unreliable; in-depth analysis of the results is then soDrmwhat useless:-. (Kiesari, Chang, & Seddon, 2003) It is similar to the concept of significant figures, where one cannot assume geateraccuracy in the resul ts of calculation than was achieved when the contribu-ting mreasurerrentsvwere taken. As rmost data gathiered for APEG is anecdotal, this is somiething that can potentially have a huge imipact upon the reliability of the results.
When building a simulation, the first and most im-portant step is to carefully determine the purpose of the model, what questions it should answer and what questions it is actually capable of answering7. It is par'ticulardy imyportant to identify irrportant processes and how th-ey relate to each other. Key tasks, sig Ofcant units, resources, workflows, iteration loops/ backtracki ncffeedback and other
interdependencies rmust be identified and accounted for. (Kellner, Madchty, & Raffo, 1999) A complete explanation of simlation development can be found in Figure 8.
7 This rrW be affected by model type, rrodeling software, data reliability and availability and a host of other
potential corrplications
(Hupic & Robinson, 1998)
Once a[]mulation io'corpete' it mUc validated a[]much as possible. Thiscan be done through model
inspection and reviews, but data comparison is preferred where available The rrodel should also be
calibrated to ratd real world expectations as much as possible. This calibration process often suggests
metrics that would provide valuable real world data in addition to improving the model itsef. When the
data to do this does not exist, there are a few potential stratejes:
- Approximate conversion where data exists that is not quite the needed data
- Piece together data from other sources to create an entire picture
- Obtain estimates from personnel i nvolved based on experience or expectations
- Use industry data from literature to approximate current situation
(KelIner, Madachy, & Raffo, 1999)
One of the major roadblocks for process improvement within an organization is often the lackof accessible tools for pre-irnplementation evaluation of proposed solutions. 9mulation is one such tool. It is useful for
both understanding the problem and trialing competing potential remedies. Its inherent flexibility rmakes it
ideal foranalysisof AP3G[ processes. (HlupIc& Robinson, 1998)
Process mapping and simulation are powerful tools wen used in the right situations. APEGEIcomplex
expensive process is nearly ideal. Both of these methods are low cost and can be implemented fairly reliably
even if there is no empirical process data. Both methods can reveal problerm hidden by the compexity of
their process, and both are re-useable with ri nor changes as the process is altered.
OTapter 4: Complexity Framework Development
Once one beginearriningAPEGlproca]]it becomeoclear that they [trugewith a vaiety of compledties, many of which have never been codified. In order to evaluate and understand these
complextiefand their effectlon APEGoprocehOX aframework wazdeveloped. Thilframework'o primary uses are to aid in cormunication, facilitateOrnulation development and improve APEG'l understandingof their own capacity.
T
'ypesof Complexity at APEG
Through discussions with APEG personnel, it becarne dear quickly that there was no standard method for evtaluating project difficulty. In general, a project wasdescribed as easy, rrediumor hard difficulty,
but each goup defined 'difficulty' differently. Exterive di[ utjon with bench workerj rmnagement
and esecutives revealed that an individual project had 3 spedfic inherent characteristics -disease compledty, solution corrpleity and solution platformcorrpledty-that affected its difficulty level and thus irmpacted step duration and decisions Each project possessed these characteristics, and each characteristic could be ranked from easy to hard in difficulty. It is important to note that these
characteristics mayonly be fully understood after project corrpletion; however, they affect the entire process path, and can beestimatedfairly reliablyeariyon.
The differenced in defining 'difficulty' between goupowerea direct rCJalt of group]having differing dependendes upon these characteristics For exate, Group A asa result of its position as earliest step in the APEG process, is heavily dependent upon characteristicsof the targeted disease. At this stage, lack of knowledge of the target can have huge impact on process times; for a difficult target, extensive research and experimentation nust be conducted before the project has progfessed enough to pass to Group B1 or Group B2 Group E, on the other hand, is armst entirely independent of disease difficulty. As the last step in the process, by the time a project reachesthem the disease is well
understood, and resulting difficulties have been overcome. They are, however, highly impacted by solution and solution platform difficulty. The other Groups fall between these extremes; Groups Bl and
B2 are dependent on all three, with disease being more prorrinent early on, and solution platform difficulty doninating latter steps. Groups Cand D are both minimally dependent upon disease difficulty. Group C is equally dependent on solution and solution platform difficulty, while Group D is slightly more dependent on solution difficulty. Group E, as discussed, is virtually independent of disease difficulty.
Purpose of Framework
Within APBG it[ if, thexl nuancejof 'difficulty' were under[tood intuitively between groupobut not overtly recognized. Asa result, no major rrisunderstanding had resulted from rniscomrrunication.
However, each project is overseen byan external group, Group a. Group a doejnot have thiointuitive understanding and it is often difficult to cormmunicate the difficulties of a project to them Additionally,
APEG sometimes has difficulties evaluating its project load. In general, APEG has a number of projects,
for exarpe 30, and can e-imate each project'general 'difficulty' to determine a qualitative project load. However, a previoutly di[Du[Ted 'difficulty' can have a plethora of rreaning]within APEG, and cormnicating these nuances is difficult. it becarre lear that APEG would greatly benefit froma
defined difficulty framework dedicated to dearly communicating the difficulty of different characteristics and providing away to asses overall difficultyquatitatively.
There are three potential applications for such a framework
1. Facilitating both intemal and external cormmunication. Corm-unicatingthe difficulties inherent in acomplex technical process to outsiders can be extremely difficult. Having a defined method
for evaluating and comn-municati ng these difficulties will allow more precise communication between APEG[intemal groupand the external Group a.
2. Intemal Evaluation of APEGjoproject load. Given itficurrent [tuation, APEG hafa very good idea of its overall project load and capabilities. However, an easily updated, quantifiable rretric for evaluating project load would allow APEG to set capadty metrics, either overall or by difficulty type.
3. APEGdelikery timelineqare heaily dependent on project difficulty, for two rea[Drf Fir[J, a more difficult project may have biolojcal corrplexitythat results in cell replication, protein generation or testing taidng longer than for a similar project. Second, a rrore difficult project is rrore likely to fail testsand cyde throug the process rmultiple times before a satisfactory solution is reached. Havinga nuanced understanding of project difficulties and their effects on the projects path throu APEG isessential to accurately predicting project timelines. As a result, this framework is a necessary prerequisite to sim'ulation.
Framework Development
To address this compledty, the Technology Peadiness Levels (OTPLs) APEG frarrework was developed. The framework is three dimensional, possessing three characteristics-based a>es. These axes are the aforementioned characteristics of disease, solution and solution platformr These complexity
characteristics are quantified by numerical Technology Readiness Levels (TRLs) of Easy (1), Medium(2) and Hard (3). Increasing difficulty correspondsto increasing vrAue to allow for the adoption of higer numbers as new technolocjes or diseases become accessible. See Figure 9 for more information.
.Peflects corrplexity of disease to analyze,
understand and work with in expiramental and
laboratoryconditions
" 1-Usease Well Understood
-Dsease has extensive reaserch and existing treatments
-2-Dsease Sorrewhat Understood
-Dsease has extensive reaserch
-3-Dsease Innovative
-Disease has rri nim d research
-Reflects corrplexity of final
solution; diseases may be sirple to understand but very difficult to treat
-1-Solution Typical
-A teAbook solution, with
little to no innovation required
-2-Solution Atypical
-Solution deviates from the
norni but in ways that
have precedent
*3- Solution Innovative 'Solution requires R&D
" Peflects corplexity of
solution molecules; has a
particularly large effect Iatter on " 1-Standard Platform 'Platformthat has optimized developrrent methods -2-Con~mn Platform -Platform that has
non-optimized developrrent methods
*3-Innovative Platform
-Platformis undergoing R&D
These three axes can be sunTned to obtain the overall project difficulty, avalue from 3-9. A hard project would have an overal value of 8-9, or at least two hard axes. Similarly, an easy project would have a value from 3-4, or at least two easy axes values. A medium difficulty project indudes the reraining value of 5-7. This allows for both general, overall comparison of projects and more nuanced, axes based evaluation.
The framework is desig-ed to allow APEG to initially evaluate their projects based off of minimal
information, so that the potential impact of a project on APEG' portfolio can be elimated before work becjns. A( the project rmovethrout APE' proce[land more beconet] known about it, vduejcan then be adj usted to more accurately reflect the projects actual difficulties. The framework is also designed so that APEG can evauate a portfolio in a similar manner. The portfolio can easily be evaluated
by surrning the TPLs of its projects; a portfolio with a total TRL of 100 would be very different from a
portfolio of 150. Sinlarly, a portfolio with acyegate Disease:Sol ution:Platfomi values of 50:2020 would have very different impiications than a portfolio with veluesof 20:50:20. In the former, there would be massive delays early on in the projects, as [isease heavily effects early projects; In particular, Group A
would be extremely impacted. In the later, [re delayC would re bit in the riddle of APEG'fproceJJ
but they would be Milder as the projects would be spread over several groups.
The TPLframewArk provides APEG with a quantities method for corrmnicating, evaluating and assessing project difficulty. It assess the three axes of Disease, Solution and Solution Platform
cxrpedty. From these aes, a nuanced understanding of both individual projects and the overall APEG portfolio can be achieved. This has a multitude of potential uses, inducing inproving conunications externally and improving intemal capacity planning
Chapter 5: Solution Development and Results
There were two stages to understanding APEG'Oproes-exploration and vuation. Exploration consisted of various methods of data gathering basic analysis and process rmapping. Evaluation resulted in athorouc4 understanding of APEGT1procmIB motivationfj groupland culture. Evaluation included
in-depth data analysis and rnmdel development, rAidation and assumptions Evaluation resulted in working sirrulations and recormendations for APEG to i mprove its proces.
Process Expor ic n
ata on APEGfcurrent procsses was gathered in three ways: (i) Interviews; (ii) data rining; and (iii) processflow rmapping.
Due to APEG'[]lac of a workflow tracking data systen, interviews were the prinry source of information obtained. Interviews were chosen over surwys because of the inherent depth of information available from interviews. (Harrell & Bradley, p. 11) Three levelsof rnaxement were interviewed; APEGfl[gnior director, the manager of each subyoup and 3-5 mermbers of each subgroup. Each person was interviewed at least twice; nxist were intervewed three or fourtimes. At the bench level each interview typically lasted 1-1.5 hours Management irterviews were typically around 15
hours each. Sore interviews took as long as 3 hours. A large nunter of interviews collected from a large numter of people is the best wayto ensure dataaccuracy acrossa oup. (Harrell & Bradley, p. 10) There are, generally seAking, four potential interview pitfalls: traditional technique based mistakes, the
so-called feminist mistake which relates to inherent power inbalances, narrative mistakes which rely on
te intervieNeeto determne the sgnificance of various bitsof knowledge and accorrpanying biases, and dinical rristakes, where people are reduced to simple numbers and extenuating drcurstances are not considered. (Fbllway & jefferson, pp. 30-31) Awarenessof these potential issues is crudal to determining the best interview approach and interpretation of results.
For AP83'Wtuation, the ur(3ructured, [mi-structtred and structured interviews were all used.
Unstructured interviews have little control over what is discussed, and typically become narrative. Thus, they are highly susceptible to bias and becorri ng sidetracked. However, they also provide a deep
understanding of the situation and build trust between the interviewer and the interviewee. (Harrell & Bradley, p. 26) This trust is very irrportant to obtaining buy-in within a community. Unstructured interviews with afew open ended questions were utilized for the first interview with each individual. This allowed them to put forward what they believed to be rmost important about their work, their own underqandingof that work'lproce[fland built rapport between the interviewer and interviewee. FirB round interviews within a given APEG group were conducted in dose succession, and resulted in an initial draft verjon of a mapof that group'oproceEl
Seri-structured interviews were used for wrost subsequent interviews. In a sermi-structured inteNvew, specific questions are asked but the order is flexible and there is room for adaptation to the
conversation. The prinay advantage of a semi-structured interview is that it allows for a deep dive into areas of interest, while still allowing for the investigation of unknown areas. Typically, seri-structured
interviews allow for the deepest understanding (Harrell & Bradley, p. 27) These interviews were
conducted using the in-development process map as a guide, and resulted in many changes to said map. At the condusion of these interviews for each group, a finalized process map was developed.
Serri-structured interviews were also used for sirrulation evaluation at the corrpletion of each simulation. Structured interviews consist of fixed questions asked in a fixed order, and were used for post-process map interviews. These interviews were generally in search of quantitative data such as timelines or step capacity. Structured interviews excel at generating data that can be generalized, particularly when conducted over a large group. (Harrell & Bradley, p. 28)
GnA,
During the interview process, interviewees were all asked about workldow recordkeeping focused upon tirne and effort per project within their group. Most goups did not keep formral records for spedfically tracking time required for tasks. Some individuals kept inforrmal records, but these often only tracked the pad few month[J worth of work and were inadequate to capture a process that may extend beyond the interval when effort was tracked. However, two groups -Group A and Group E- both had extensive workflow tracking
Information on data gathered fromeach group can be found in AppendixA
Process mapping was done at three levels, rouchly corre[ponding to Madi3 n 'Olevel[]of Macro, Functional-Activity and Task-Procedure, in order to better understand the process and its significant steps. The three levels were named Executive, Manageonit and Bench as indicators of who is most knowledgeable concerning each leve. E)planation of these three levels can be found in Figure 9.
- 'Executive' Level
- Hich-Level overviewv of how th ng[]'[h~ould' proceed -Uti e inudixnA Section 0
'Managmt' Leve M
Mid- LEveA, m-ore comyplex overview -See Appendix A Sections 1-6 -'Bench' Level
-Detailed level with sernyi-onsistent steps -Utilized in bUildingof sirnulation details