HAL Id: hal-01208194
https://hal.archives-ouvertes.fr/hal-01208194
Submitted on 2 Oct 2015
HAL is a multi-disciplinary open access
archive for the deposit and dissemination of sci-entific research documents, whether they are pub-lished or not. The documents may come from teaching and research institutions in France or abroad, or from public or private research centers.
L’archive ouverte pluridisciplinaire HAL, est destinée au dépôt et à la diffusion de documents scientifiques de niveau recherche, publiés ou non, émanant des établissements d’enseignement et de recherche français ou étrangers, des laboratoires publics ou privés.
Chelonia mydas in Response to Dynamic Environmental
Conditions during Post-Nesting Migration
Philippine Chambault, David Pinaud, Vincent Vantrepotte, Laurent Kelle,
Mathieu Entraygues, Christophe Guinet, Rachel Berzins, Karin Bilo, Philippe
Gaspar, Benoît de Thoisy, et al.
To cite this version:
Philippine Chambault, David Pinaud, Vincent Vantrepotte, Laurent Kelle, Mathieu Entraygues, et al.. Dispersal and Diving Adjustments of the Green Turtle Chelonia mydas in Response to Dynamic Environmental Conditions during Post-Nesting Migration. PLoS ONE, Public Library of Science, 2015, 10 (9), pp.e0137340. �10.1371/journal.pone.0137340�. �hal-01208194�
Dispersal and Diving Adjustments of the
Green Turtle Chelonia mydas in Response to
Dynamic Environmental Conditions during
Post-Nesting Migration
Philippine Chambault1,2*, David Pinaud3, Vincent Vantrepotte4,5, Laurent Kelle6,
Mathieu Entraygues7, Christophe Guinet3, Rachel Berzins7, Karin Bilo8, Philippe Gaspar9,
Benoît de Thoisy10, Yvon Le Maho1,2, Damien Chevallier1,2
1 Université de Strasbourg, Institut Pluridisciplinaire Hubert Curien, 23 rue Becquerel, F-67087 Strasbourg cedex 2, France, 2 CNRS, UMR 7178, 23 rue Becquerel, F-67087 Strasbourg cedex 2, France, 3 Centre d’Études Biologiques de Chizé, UMR 7372 CNRS—Université de La Rochelle, 79360 Villiers-en-Bois, France, 4 Laboratoire d’Océanologie et de Géosciences, UMR 8187 CNRS, 28 avenue Foch, BP 80 62930 Wimereux, France, 5 CNRS Guyane, USR 3456, av. Charlery, 97300 Cayenne, France, 6 WWF Guyane, N° 5 Lotissement Katoury, F-97300 Cayenne, France, 7 Office National de la Chasse et de la Faune Sauvage— Cellule technique Guyane, Campus agronomique, BP 316, 97379 Kourou cedex, France, 8 WWF Guianas, Henck Arronstraat 63, Paramaribo, Suriname, 9 Collecte Localisation Satellites, Direction Océanographie Spatiale, 8–10 rue Hermès, 31520 Ramonville, France, 10 Association Kwata, 16 avenue Pasteur, BP 672, F-97335 Cayenne cedex, France
Abstract
In response to seasonality and spatial segregation of resources, sea turtles undertake long journeys between their nesting sites and foraging grounds. While satellite tracking has made it possible to outline their migration routes, we still have little knowledge of how they select their foraging grounds and adapt their migration to dynamic environmental condi-tions. Here, we analyzed the trajectories and diving behavior of 19 adult green turtles (Che-lonia mydas) during their post-nesting migration from French Guiana and Suriname to their foraging grounds off the coast of Brazil. First Passage Time analysis was used to identify foraging areas located off Ceará state of Brazil, where the associated habitat corresponds to favorable conditions for seagrass growth, i.e. clear and shallow waters. The dispersal and diving patterns of the turtles revealed several behavioral adaptations to the strong hydrodynamic processes induced by both the North Brazil current and the Amazon River plume. All green turtles migrated south-eastward after the nesting season, confirming that they coped with the strong counter North Brazil current by using a tight corridor close to the shore. The time spent within the Amazon plume also altered the location of their feeding habitats as the longer individuals stayed within the plume, the sooner they initiated foraging. The green turtles performed deeper and shorter dives while crossing the mouth of the Ama-zon, a strategy which would help turtles avoid the most turbulent upper surface layers of the plume. These adjustments reveal the remarkable plasticity of this green turtle population when reducing energy costs induced by migration.
a11111
OPEN ACCESS
Citation: Chambault P, Pinaud D, Vantrepotte V, Kelle L, Entraygues M, Guinet C, et al. (2015) Dispersal and Diving Adjustments of the Green Turtle Chelonia mydas in Response to Dynamic Environmental Conditions during Post-Nesting Migration. PLoS ONE 10(9): e0137340. doi:10.1371/ journal.pone.0137340
Editor: Daniel E Crocker, Sonoma State University, UNITED STATES
Received: March 30, 2015 Accepted: August 14, 2015 Published: September 23, 2015
Copyright: © 2015 Chambault et al. This is an open access article distributed under the terms of the
Creative Commons Attribution License, which permits unrestricted use, distribution, and reproduction in any medium, provided the original author and source are credited.
Data Availability Statement: As the studied species Chelonia mydas is classified as endangered on the IUCN Red List, location data are available upon request by contacting DC atdamien.chevallier@iphc. cnrs.fr. The diving data are available on Dryad, doi:
http://datadryad.org/review?doi = doi:10.5061/dryad. b35g2.
Funding: The CARET2 program was co-financed by the OP Amazonia with the European Union’s ERDF fund, the Ministry of Ecology, Sustainable Development and Energy and the French National
Introduction
Seasonality drives the availability and aggregation of resources, and is thus one of the main eco-logical factors affecting the evolution and the ecology of long-distance migrants [1]. Indeed, in most cases, the requirements of migratory animals temporally and spatially match the peak of resource abundance, thus avoiding resource depletion. Migrant organisms time their movements according to their life stages and their different activities (growth, breeding, etc.) in order to exploit seasonal resources that vary at temporal and spatial scales, generally travelling long dis-tances to reach appropriate sites for their needs [2]. It is crucial to assess the dispersal movements and the habitat used by migrating animals in order to understand their ecology and facilitate the implementation of adequate conservation policies [3]. This migratory behavior has been studied in a wide range of marine groups such as mammals [4,5], birds [6], fish [7,8] and reptiles [9–11]. Sea turtles are long-distance migrants that undertake long journeys from their nesting sites to foraging grounds [12]. Most nesting sites do not provide sufficient energy resources for tur-tles to sustain oviposition and year-round residency [10]. Additionally, the turtle allocates the majority of its energy to reproduction during breeding and nesting, resulting in high energy requirements at the end of the nesting season [13,14]. The turtles therefore migrate after the nesting season to replenish their body reserves, foraging in areas of high productivity in order to maximize their foraging efficiency.
The migratory strategy associated with specific foraging grounds varies greatly across sea turtle populations [15]. Most of adult Cheloniidae, i.e. hawksbill, loggerhead, and green turtles, usually migrate across the open ocean to reach neritic feeding grounds [16]. However, while satellite tracking has made it possible to outline the migration routes, we still have little knowl-edge of how sea turtles select their foraging grounds [17].
Adult Cheloniidae sea turtles feed on different resources, depending among others on their ecological requirements, their diet and on the habitat characteristics, i.e. resource availability, competition, etc. Unlike the omnivorous (olive ridley and hawksbill) and carnivorous (logger-head) species of sea turtles [18], the green turtle Chelonia mydas is mainly a herbivorous grazer at the adult stage, and is therefore dependent on seagrasses or algae meadows [18]. A high diversity of seagrass species [19] can be found throughout the western part of the Tropical Atlantic from the Gulf of Mexico to the north part of the Brazilian coast (up to 10°S). These marine meadows provide foraging grounds for several green turtle populations [20] originating from seven different rookeries: Ascension Island, Matapica (Suriname), Aves Island (Venezu-ela), X’cacel and Isla Cozumel (Mexico), Tortuguero (Costa Rica) and the east coast of Florida in the United States [20].
In addition to these seven populations, there is another little-known rookery in the western Equatorial Atlantic, located at the natural border between French Guiana and Suriname along the beaches of the Maroni estuary [21]. Since seagrass is distributed throughout the Tropical Atlantic [19], there is a possibility that turtles from this nesting site could either migrate north-westward, following the Guiana current flow to reach high density seagrass beds found in the Caribbean, or swim along the Brazilian coasts further south [19,22]. Baudouin et al. (2015) found that they undertake a south-eastward migration, presumably swimming against the strong North Brazil current and crossing an unfavorable and highly turbulent zone, the Amazon River plume.
The Amazon River is a major source of freshwater input, supplying 20% of the freshwater entering the ocean [23]. It has the highest level of water and sediment discharge and the largest drainage basin in the world [23–25]. The Amazon plume discharges 115.107tons of sediments into the Equatorial Atlantic Ocean per year, strongly influencing the oceanographic and bio-chemical processes of the north-eastern American coast [24–26]. The large amounts of sus-pended materials carried by the plume lead to low levels of irradiance, hampering
Centre for Space Studies (CNES) and was also supported by the French Guiana Regional Council. PC's Phd Scholarship was supported by Shell (https://www.shell.fr/aboutshell/guyane.html)and CNES Guyane (http://www.cnes-csg.fr/). The authors also acknowledge the support of the project ANTIDOT (Pépinière Interdisciplinaire Guyane, Mission pour l'Interdisciplinarité, CNRS). The funders had a role in the decision to publish but had no role in study design, data collection and analysis, or preparation of the manuscript.
Competing Interests: PC's PhD scholarship was financed in part by Shell (https://www.shell.fr/ aboutshell/guyane.html). There are no patents, products in development or marketed products to declare. This does not alter the authors' adherence to all the PLOS ONE policies on sharing data and materials.
phytoplankton photosynthesis [27]. A priori, such turbid waters are therefore an unsuitable foraging habitat for herbivorous organisms [28].
If green turtles cross this particularly turbulent zone as part of their migratory strategy, there must be a reason for undertaking this long and counter-current migration to reach specific areas off the Brazilian coast. Our study is based on satellite telemetry, and attempts to shed light on how green turtles nesting in French Guiana and Suriname select their foraging grounds and adapt their post-nesting migration to dynamic environmental conditions. Our two main objectives in this study of green turtle migration strategy were therefore (i) to locate the foraging grounds and characterize habitat affinities and (ii) to assess how oceanographic conditions encountered along the way can affect the movements of turtles in terms of dispersal and diving patterns.
Materials and Methods
Ethics statements
This study meets the legal requirements of the countries where this work was carried out, and follows all institutional guidelines. The protocol was approved by the“Conseil National de la Protection de la Nature” (CNPN,http://www.conservation-nature.fr/acteurs2.php?id=11), a branch of the French ministry for ecology, sustainable development and energy (permit Num-ber: 09/618) acting as an ethics committee in French Guiana and Suriname. After the evalua-tion of the project by the CNPN, fieldwork was carried out in strict accordance with the recommendations of the Police Prefecture of French Guiana, Cayenne, France, in order to min-imize the disturbance of animals.
Satellite tag deployment
During the inter-nesting season, 16 Argos-linked Fastloc GPS tags (MK10, Wildlife Computers Redmond, WA, USA) were deployed on adult female green turtles from February to June 2012 on both sides of the Maroni River: at Awala-Yalimapo in the Amana Nature Reserve, French Guiana (5.7°N-53.9°W, n = 8), and in the Galibi Nature Reserve in Suriname (5.4°N-53.5°W, n = 8) [21]. During the same period in 2014, 10 additional females in the Amana Nature Reserve were equipped with Conductivity Temperature Depth-Fluorometer Satellite Relayed Data Loggers (CTD-SRDL, Sea Mammal Research Unit, University of St. Andrews, Scotland). The attachment procedure followed the standard methods described in Baudouin et al. [21]. During tag deployment, measurements of the Curved Carapace Length (CCL) were taken, and body mass could then be calculated using Hays et al.’s method [29]–seeS1 Table.
Data collected
The procedure to extract migratory route data was identical to that used in Baudouin et al. [21]. The Argos-linked Fastloc GPS tags also provided diving data, i.e. maximum dive depths, dive durations and in situ temperature data, binned as 4-hour period histograms. Maximum depths were collected in different bins, every 10 m from 10 to 100 m, then every 50 m from 100 to 250 m. Maximum dive durations were stored from 30 s to 1 min, then every minute from 1 to 5 min, and finally every 10 minutes from 10 to 60 min. In situ temperatures were recorded during dives from 20 to 32°C, every one degree Celsius. Tags also supplied Time At Depth (TAD) and Time At Temperature (TAT), defined as the proportion of time (in %) spent at each depth and the temperature range, respectively.
The CTD-SRDL tags provided the locations of animals, i.e. Argos data, and simplified pro-files of the diving parameters, and oceanographic data. However, the oceanographic and diving data were not used in the analysis.
Data pre-filtering
In order to retain only the positions recorded during the migration, a spatial query was per-formed via ArcGIS version 10.1 to identify the date migration began. By calculating the average daily speed during the inter-nesting season, a speed filter of 30 km.d-1was set, and only the positions associated with a daily speed> 30 km.d-1were set to migration phase and then retained for the analysis.
Using the same approach as described in Heerah et al. [30], a Kalman-filtering algorithm was then applied (CLS, Collecte Localisation Satellites, Toulouse, France) to enhance tag position estimates (Argos and GPS) by accounting for Argos location errors [31,32]. The shoreline was extracted from NOAA National Geophysical Data Center, Coastline, e.g. WVS, GSHHG. The General Bathymetric Chart of the Oceans database (GEBCO,http://www.gebco.net/, 30-arc-sec-ond 1 km grid) was used to discard any locations on land. The positions associated with a speed of over 10 km.h-1and those with location class Z (0.1%, class associated with the raw location before Kalman filtering) were also removed, considered insufficiently accurate, and any dive depth records from tags over 100 m were also removed due to the substantial differences between the depth values provided by the pressure sensors of the tags and bathymetry data. Seven individuals (#115451, #115453, #130766, #130769, #130776, #131354 and #131355) were discarded from the analysis due to insufficient data caused by transmission issues.
First Passage Time analysis
After proceeding with pre-filtering, First Passage Time (FPT) analysis was performed on loca-tion data (Argos localoca-tion after kalman filtering and GPS) in order to spatially and temporally identify Areas of Restricted Search (ARS) using R software version 3.2.1 [33]. FPT is defined as the time required by an organism to cross a circle of a given radius. FPT approach is a three-step procedure:
1. The track of each turtle was linearly interpolated at 1 km intervals whilst retaining raw loca-tions to avoid losing data.
2. FPTs were then calculated at every location of the interpolated tracks for radii ranging from 1 to 400 km to ensure the coverage of large foraging movements [34]. For each track, the rel-ative variance of FPT (after log transformation) was plotted against radii to identify the scales of searching activity (ARS) revealed by a peak of variance at a specific radius (S1a Fig). If several peaks appeared, we only considered the peak corresponding to maximum variance, as the study focuses on the smallest foraging scale.
3. Finally, by plotting the FPT at the optimal scale as a function of time, the periods featuring ARS (higher FPT) could be identified throughout the trip [35–37]–seeS1b Fig. Temporal detection of ARS periods was carried out using Lavielle’s segmentation method [38] from the adehabitatLT package, which allowed to differentiate between twomodes: No ARS (low FPT, transiting mode) vs. ARS (high FPT, foraging mode). The migratory mode of turtles (No ARS vs. ARS) was then inferred to each position after identifying temporal ARS loca-tions from FPT outputs (S1b Fig).
Track segmentation
When considering the transiting mode only, the trajectories were delineated into three phases to take into account the influence of the Amazon River plume on the horizontal and vertical movements of turtles (Phase 1: before plume, Phase 2: within plume and Phase 3: after plume).
Along the tracks of the turtles, the trajectories were segmented based on the distribution of the diffuse attenuation coefficient at 490 nm (hereafter called Kdin m-1–seeS2 Fig). The Kd490
nm is a standard ocean color product of downwelling irradiance at 490 nm, operationally pro-vided by the various ocean color sensors, and considered as a good index for qualifying the light attenuation of the visible light in the water column. Averaged monthly data for Kd, an
indicator of the turbidity of the water column, were extracted at a 4 km resolution from the Ocean Color website (http://oceancolor.gsfc.nasa.gov/).
Spatial analysis
For the spatial analysis, the distance travelled and the elapsed time between locations were cal-culated using the trackDistance function from the trip package on R [39]. The observed speed was then derived from the distance and time elapsed between locations. The distance to shore was also calculated within each of the three phases for the 19 individuals retained for the study. To investigate the role of oceanic circulation on turtle movements, surface current data (merid-ional and zonal components) were extracted daily for the tracking period from Mercator-Ocean GLORYS-2v1 (Global Mercator-Ocean ReanalYsis and Simulations, available on:http://marine. copernicus.eu/web/69-myocean-interactive-catalogue.php) model, at a 0.25° resolution (~28 km). Oceanic current velocity and the associated direction were then derived from meridional and zonal components (scalars u and v respectively). The average swimming speed of the tur-tles was then calculated with correction for current velocity following Gaspar et al.’s method [40], giving a proxy of the swimming effort.
The time taken by each turtle to reach the foraging grounds (hereafter called FG) was derived from FPT outputs (S1 Fig). To assess the effects of the plume on the overall migration, we performed linear models using the time spent within the plume (TimePhase2) as a response variable, using the lm function from the stat package on R. Since the significantly lower number of locations recorded within the plume did not permit the precise calculation of the observed speed, we decided to use duration within the plume instead of the travel speed. We therefore selected one temporal variable, i.e. the time taken to reach a foraging ground, one spatial vari-able, i.e. the minimum longitude of the foraging ground (location of the closest foraging site reached in relation to the nesting site), one variable relative to the movement of turtles, i.e. the averaged swimming speed of turtles within the plume, and one intrinsic covariate, i.e. the body mass. Indeed, given the strong hydrodynamic forcing generated by the Amazon River plume, it can be assumed that the time taken to reach the foraging ground will increase with increasing time within the plume. In addition, we assumed that the first turtles that stop to forage, i.e. at the closest recorded foraging ground in relation to the nesting site, would have spent more time crossing the plume. Finally, we assumed that the time within the plume would increase with higher current velocity, and, conversely, would decrease with increased swimming speed. Following the method described in Zuur et al. [41], all combinations of collinear predictors (Spearman coefficients> 0.8 and < −0.8) were excluded, then all possible combinations with-out interactions were tested and the model with the lowest Akaike Information Criteria (AIC) was selected.
Habitat affinities
To characterize the foraging habitat in relation to environmental conditions, four static and dynamic remotely sensed variables were selected according to their biological relevance and availability in the study area. We extracted bathymetry data from GEBCO, then used the ter-rain function from the raster package [42] to derive the slope and obtain an indicator of seabed roughness. Two oceanographic variables were also extracted from Ocean Color website,
namely Kdand Sea Surface Temperature (SST, 11 micron per day,http://oceancolor.gsfc.nasa.
gov/cms/). The monthly data provided were already averaged at a 4 km resolution. A full cover-age of the satellite remote sensing data over the whole area of interest could not be obtained, mostly due to cloud coverage or failures of the atmospheric correction procedure. Missing sat-ellite data were therefore estimated by interpolating the SST and Kdusing inverse distance
weighting method from gstat and raster packages [42,43]. The covariate values were then extracted at the locations of each turtle (the GPS and Kalman filtered Argos locations) using the extract function from the raster package [42].
Diving behavior analysis
For the Argos-linked Fastloc GPS tags, no precise location was associated with each dive as div-ing data were stored in 4h-histograms. FPT could not therefore be applied to these data. To dif-ferentiate the diving data between the two behavioral modes, i.e. transiting vs. foraging, we therefore relied on the starting date of the foraging behavior, as identified by FPT analysis. The position data obtained from the diving records were then segmented into two modes, i.e. tran-siting vs. foraging. To assess the effect of the plume on diving behavior during the trantran-siting mode, the positions were also segmented into three phases based on the Kddistribution, i.e.
before plume, within plume and after plume. As the CTD-SRDL tags provided a very small amount of diving data, only data provided by the Argos-linked Fastloc GPS tags were included in the diving behavior analysis.
Statistical analyses
All statistical analyses were performed using R software version 3.2.1 [33]. All samples submit-ted to statistical tests were first checked for normality and homogeneity of variances by means using Shapiro-Wilk test. Depending on the results, parametric or nonparametric tests were used. Globally, Wilcoxon-Mann-Whitney tests were used to compare the diving behavior and the environmental variables between the two modes, i.e. transiting vs. foraging, using a signifi-cance level ofα = 0.05. Tukey HSD tests were used to compare the behavior between the three migration phases. Values are means ± SD.
Results
Foraging grounds selection
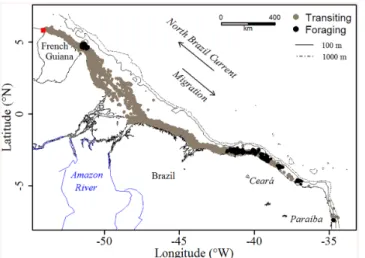
Foraging ground locations and spatial scales. For both years of tag deployment, the 19 analyzed tracks of Chelonia mydas showed a south-eastward migration over an average 3450 ±701 km for a mean tracking duration of 118±37 days (Fig 1andS1 Table). All turtles used a narrow corridor (mean: 22.5±24.4 km), remained on the continental shelf (< 100 m isobaths) and migrated at an average observed speed of 0.5±0.5 m.s-1(~2 km.h-1)–seeTable 1.
FPT analysis was used to locate the foraging areas both in time and space (S1 Fig). With the exception of one turtle that stopped off the coast of Cayenne in 2012 (#115446, foraging event in Phase 1) rather than at the very end of turtle tracks, the searching activity recorded spans from June to mid-September, and foraging areas were found to be located at the very end of the turtle tracks, along the shores of Ceará and Paraíba states, Brazil (Fig 1andS1 Table). The radii of the foraging areas ranged from 7 to 60 km (#115448 vs. #115446), with an average of 19.7 ±14.6 km over the whole foraging trip. Twenty-one percent of the turtles used fine-scale forag-ing (<10 km radius, #115448, #115456, #115458 and #115460), 47% foraged on a medium-scale (10–20 km, #115445, #115449, #115450, #115452, #115454, #115455, #115457, #130767 and #130773), and 21% showed coarser-scale foraging beyond a radius of 20 km (#115446,
#115447, #115459 and #130770), while First Passage Time analysis revealed a complete absence of foraging behavior in two individuals (#130768 and #130771) (S1 Table).
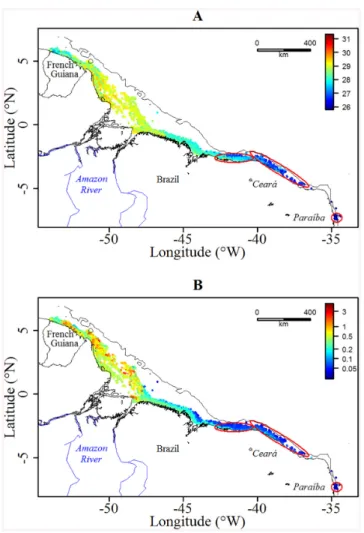
Habitat affinities. During their migration, green turtles crossed highly contrasted envi-ronmental conditions (Fig 2). In the foraging mode, the SST was significantly lower than in the transiting mode (27.0±0.4 vs. 28.3±0.6°C, respectively, Wilcoxon test p< 0.001)–see Figs2A and3A. Identically, the Kdwas significantly lower at the foraging grounds (0.09±0.09 vs. 0.41
±0.38 m-1, respectively, Wilcoxon test p< 0.001, Figs2Band3B). In contrast, the bathymetry was slightly deeper outside the feeding grounds (15.2±31.9 vs. 14.2±9.2 m, respectively, Wil-coxon test p< 0.001,Fig 3C). The slope remained weak over the whole migration but was slightly steeper at the foraging grounds (0.13±0.28 vs. 0.12±0.10 m, respectively, Wilcoxon test p< 0.05,Fig 3D).
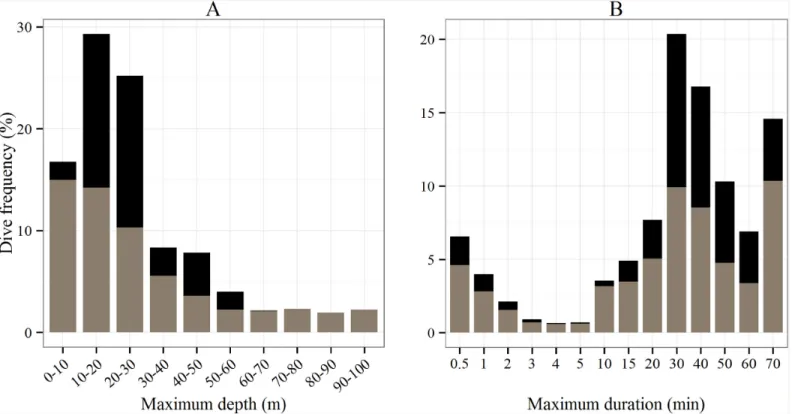
Diving behavior. Among the 974 dive depths recorded, 1% were discarded due to biologi-cally implausible depth records when comparing the depth recorded by the tag to the bathyme-try for the same location (>100 m). When considering all tracks as a whole, the maximum dive depth ranged from 10 to 100 m, and 70% of the dives were performed at shallow depths within 30 m of the surface (Fig 4A). The depth range was greater outside the foraging areas and ranged from 10 to 100 m, whereas turtles concentrated their dives between 10–30 m at the foraging
Fig 1. Locations of the 19 green turtles equipped in 2012 and 2014 for the two behavioral modes, i.e. transiting (gray) and foraging (black). The red square indicates the migration departure point. The shoreline was extracted from NOAA National Geophysical Data Center, Coastline.
doi:10.1371/journal.pone.0137340.g001
Table 1. Summary of the horizontal and vertical movements of the 19 green turtles during the three migration phases. The diving parameters refer only to the 14 Argos-Fastloc GPS tags. The numbers 1, 2 and 3 refer to the three migration phases, respectively before, within and after the plume.
Migration phase All migration
1 2 3 Mean±SD Distance to shore (km) 13.5±8.4 46.6±45.7 17.3±11.3 22.5±24.4 Observed speed (m.s-1) 0.6±0.5 0.8±0.6 0.6±0.5 0.5±0.5 Swimming speed (m.s-1) 1.0±0.5 1.1±0.6 0.9±0.5 0.8±0.5 Current velocity (m.s-1) 0.5±0.2 0.4±0.3 0.3±0.1 0.4±0.2 Maximum depth (m) 26.6±25.3 38.7±28.8 34.5±18.4 32.0±20.9
Maximum duration (min) 35.2±23.6 29.1±23.4 37.4±22.5 35.1±21.9 doi:10.1371/journal.pone.0137340.t001
grounds. Mean depth was significantly higher outside the foraging areas (Wilcoxon test: p< 0.001, 29.5±12 m vs. 33.7±25.1 m)–seeFig 4A.
Regarding the overall distribution of the maximum dive duration, the dives ranged from 0.5 to 70 min and 35% of the dives lasted 30–40 min (Fig 4B). Wherever the foraging area was located, i.e. whether it was off the shores of Cayenne or at the end of the migratory path, dives lasted significantly longer at the foraging grounds (37.3±19.1 min) than during the transiting between feeding sites (33.6±23.5 min, Wilcoxon test: p< 0.001).
Behavioral adaptations to environmental conditions
Distance to shore. Over the entire migration, 88% of the locations were located in areas with a north-westward current flowing against the migratory path of the turtles (Fig 5). How-ever, the strongest velocities flow parallel to the coastline at around 100 km offshore, i.e. the North Brazil current, and turtles remained on average within 22.5±24.4 km of the shore (Table 1). Current velocity was positively correlated to the distance to the shore (Spearman cor-relation test: R2= 0.36, p< 0.001), especially within the plume (Spearman correlation test: R2= 0.57, p< 0.001).
Fig 2. Distributions of (A) SST (°C) and (B) Kd(m -1
) along the 19 turtles’ tracks. The foraging grounds are represented by the red ellipses and the black solid line refers to the 100 m isobaths. Kdrefers to the Diffuse Attenuation Coefficient and was logged transformed for a better contrast. The shoreline was extracted from NOAA National Geophysical Data Center, Coastline.
Fig 3. Box plots of (A) the SST (°C), (B) the Kd(m-1), (C) the Bathymetry (m) and (D) the Slope (°) extracted at turtles’ locations for the two behavioral modes, i.e. transiting (grey) and foraging (black). doi:10.1371/journal.pone.0137340.g003
Fig 4. Histograms of (A) the maximum dive depth (m) and (B) the maximum dive duration (min) recorded by the 14 Argos-Fastloc GPS tags for the two behavioral modes, i.e. transiting (gray) and foraging (black).
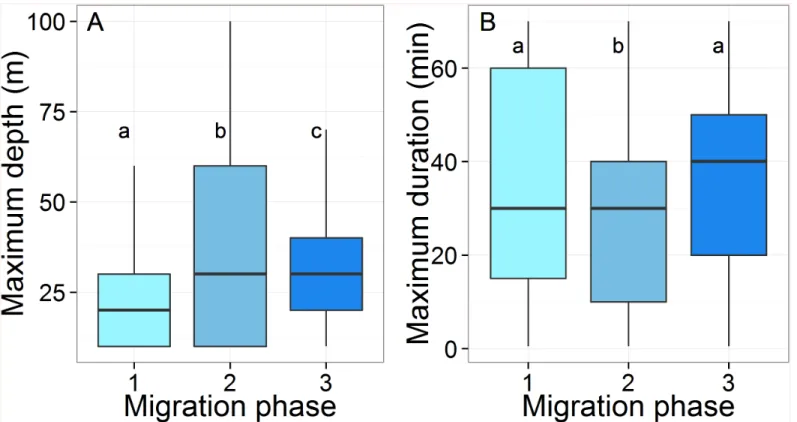
The distance to shore varied significantly between all migration phases (Tukey HSD: p< 0.001,Table 1). Turtles swam closer to shore before and after the mouth of the Amazon (Phases 1 and 3), swimming over twice as far from the coast while crossing the plume (46.6 ±45.7 km) than in any other parts (17.4±11.4 km,Fig 6).
Speed. Except between Phase 1 and Phase 3, the observed speed differed significantly according to the migration phase, and was highest within the plume and lowest before and after the plume (0.8±0.6 m.s-1vs. 0.6±0.5 m.s-1, Tukey HSD: p< 0.01,Table 1). Over the entire migration, the average swimming speed after correction for currents was higher than the observed speed (0.5±0.5 m.s-1vs. 0.8±0.5 m.s-1~3 km.h-1), with minimum values observed after the plume and maximum values recorded at the Amazon mouth in Phase 2 (0.9±0.5 m.s-1
Fig 5. Mean direction and velocity of the currents over the whole study area for the 2012 and 2014 tracking periods extracted daily from Mercator-Ocean GLORYS-2v1 (Global Ocean ReanalYsis and Simulations). The trajectory of turtle #115452 (red) is superimposed on the current. For a better visual representation, the spatial resolution of the current direction is set to 0.75 degrees. The shoreline was extracted from NOAA National Geophysical Data Center, Coastline.
doi:10.1371/journal.pone.0137340.g005
Fig 6. Map of Kd(m -1
) within the plume for (A) May, (B) June and (C) July, with turtle routes
superimposed for the corresponding months. The Kdwas log transformed to improve representation and extracted monthly from Ocean Colour database and the shoreline comes from NOAA National Geophysical Data Center, Coastline.
vs. 1.1±0.6 m.s-1). There was also a positive relationship between the current velocity and the swimming speed (Spearman correlation test: R2= 0.2, p< 0.001), meaning that turtles increased their swimming effort with the increasing velocity of the oncoming current.
Time spent within the plume. The most parsimonious model associated with the lowest AIC contained two variables: the time taken to reach Foraging Grounds (Time to FG) and the minimum FG longitude (closest foraging ground to the nesting site)–seeTable 2. There was no relationship between the time spent in Phase 2 and body mass (Spearman correlation test: R2= 0.04, p = 0.8626), or swimming speed within the plume (Spearman correlation test: R2= 0.31, p = 0.2122). In contrast, Time within the plume increased significantly with the time taken to reach the foraging ground (p< 0.01,Table 2), whereas the minimum longitude of foraging grounds decreased significantly with TimePhase2 (p< 0.001,Table 2).
Diving behavior. Mean depth was significantly different between all migration phases (Tukey HSD: p< 0.001,Fig 7A), and on average, turtles dived deeper in Phase 2 and to shal-lower depths in Phase 1 (39.2±21.8 m vs. 26.6±25.3 m,Table 1). Maximum dive duration var-ied significantly between all migration phases except between Phase 1 and Phase 3 (Tukey HSD: p< 0.001,Fig 7B). The longest average dive duration was performed in Phase 3 (37.4 ±22.5 min), whilst the shortest occurred in Phase 2 (29.1±23.4 min).
Discussion
Our study uses satellite telemetry and two years of sampling (2012 and 2014) to provide data highlighting the long, counter-current post-nesting migration performed by green turtle Chelo-nia mydas population nesting in French Guiana and Suriname, and reveals a substantial forag-ing aggregation off the Brazilian coast. The assessment of their spatial and divforag-ing patterns in response to environmental variability, i.e. the North Brazil current and the Amazon River plume, provides detailed information on their behavioral adjustments and specific habitat affinities.
Synchronization and foraging aggregation
A previous study tracked green turtle individuals from the closest rookery to French Guiana, located on the beaches of Tortuguero in Costa Rica [44]. Although there are similarities with our group in terms of coastal migration and proximity to foraging grounds, green turtles from French Guiana and Suriname travelled on average more than three times the maximum dis-tance travelled by the Tortuguero individuals (3681±729 km vs. 1089 km) [44]. Additionally, one individual nesting in French Guiana travelled the longest total distance ever recorded for a green turtle, i.e. 5153 km. This difference in coastal migration distances between the two green turtle populations is striking. Although long travel distances have already been documented for turtles that nest on isolated islands and therefore have to cross the open ocean or the open seas [45,46], they have never been observed before in green turtles migrating exclusively
alongshore.
Table 2. Summary of the linear model performed to relate theTimePhase2* to intrinsic variables.
Variable Estimate Std error Z value p-value
Time to FG 4.2361 1.5980 2.651 <0.01
Min Longitude FG -4.9891 1.5980 -3.122 <0.001
TimePhase2* refers to the time (in days) spent within the plume and FG to Foraging Grounds. doi:10.1371/journal.pone.0137340.t002
Unlike green turtles in Costa Rica, which displayed migration routes that differed according to individuals [44], the 19 turtles in our study exhibited a remarkable synchronization in time and space since they all travelled in the same direction and during the same period. With the exception of one individual performing a foraging behavior off Cayenne (#115446), the 18 oth-ers performed a remarkably straight course to their final destination, and did so within a quite limited time. This pattern suggests an optimal strategy which involves minimizing the cost of migration for turtles by allowing the rapid restoration of their body reserves after the inter-nesting season [45]. The single foraging event located off Cayenne does not correspond to the presence of seagrass beds, and can be attributed to either navigational issues caused by hydro-dynamic forcing (this turtle swam in two uniform anticlockwise circles, suggesting that the North Brazil current and/or the north-westward Amazon plume pushed her back in the oppo-site direction), or a stopover oppo-site as identified by Baudouin et al. [21], since this individual could have let itself drift passively in this stopover area.
Suitable habitat for a mega-herbivore reptile
Our data show that the most favorable habitat conditions for the foraging activity of green tur-tles are clear and cool waters, which are associated with low bathymetry. Data on seagrass cov-erage confirms that green turtle foraging grounds are located near seagrass beds. Seagrass is a fragile ecosystem relying on complex biochemical processes, since its growth is regulated by temperature, light and nutrient availability [47,48]. However, the 115.107tons/year of sedi-ments discharged by the Amazon River plume strongly influence the optical conditions of the north-eastern American coast [24,26], leading to large amounts of suspended and dissolved
Fig 7. Box plots of (A) the maximum depth (m) and (B) the maximum duration (min) recorded by the 14 Argos-Fastloc GPS tags during the three migration phases. The box plots sharing the same letter are not statistically different (Tukey HDS). The horizontal black line in box plots represents the median.
materials [27] that limit underwater irradiance [47,49]. These unfavorable conditions for sea-grass growth may explain why green turtles cross the plume at high travel speeds, i.e. to reach the clearer waters further south that are associated with seagrass meadows. The presence of sea-grass beds at green turtle foraging grounds is also noted in the observations of the Federal Uni-versity of Rio Grande (FURG) [22]. Indeed, five seagrass species have been identified along the tropical coast of Brazil from 0 to 25°S [22]. These species extend over> 30 000 ha, namely Halodule wrightii, H. emarginata, H. decipiens, H. bailoni and Ruppia maritima. H. wrightii seems to be the dominant species within green turtle foraging grounds. The biomass of this sea-grass species is greater during spring and summer compared to fall and winter [50], which cor-responds to the arrival time of green turtles and suggests that the migration timing of this grazer matches the seasonal abundance of seagrass [1].
Ceará was described as a foraging ground for green turtles of the Equatorial Atlantic in the 1970s, when several individuals from French Guiana were observed off the Brazilian coast [51]. Further evidence was seen in 2001 and 2003, when green turtles tagged in Brazil were recap-tured in Nicaragua (data available onwww.seaturtle.org). Other observations provide links between Ceará foraging grounds and other nesting sites in the tropical Atlantic, such as the Caribbean region and Central America. Furthermore, green turtles nesting on Ascension Island migrate to foraging grounds off Paraíba state [51,52], a site reached by one of the indi-viduals in our study (#115460).
The turtles performed longer dives in foraging areas, which strongly suggests the occurrence of feeding activity [10,44]. The difference in water temperature within the plume and inside foraging grounds (~1.9°C) can be explained by the warmer freshwater supply from the Ama-zon River [53]. Cooler temperatures in foraging areas may therefore play two roles: firstly they favor seagrass development under optimal conditions [48], and secondly they allow these ecto-thermic organisms to reduce their metabolism and thus minimize their energy expenditure [54]. A reduced metabolic rate may therefore enable turtles to dive for longer periods, optimiz-ing resource exploitation [55].
Dispersal adaptations to counterbalance the effect of strong currents
The migration trajectories of these 19 green turtles highlight a counter-current migration, with inter-individual variability observed for the distance to shore and vertical movements. The sur-face current velocities show that turtles swim against the current throughout their migration to foraging grounds, which could require high amounts of energy. All individuals travelled at high speeds to compensate for current-induced drift, and approached the speeds reached by green turtles crossing the Atlantic Ocean from Ascension Island (0.56 m.s-1vs. 0.71 m.s-1) [21]. However, no documentation to date describes the swimming speed of green turtles after cor-rection for currents. This study provides the first reliable data ever recorded for swimming speeds, and reveals that individuals reached on average 0.84 m.s-1, with bursts of speed attain-ing 3.50 m.s-1. It is important to note that higher swimming speeds were recorded at the begin-ning of the migration, where the current velocities are the strongest, i.e. the Guiana current. Consequently, green turtles could either increase their swimming speed in response to current velocity, i.e. an increase of 46% compared to the initial observed speed, or simply travel faster before the plume because they have more energy at the beginning of the migration than at the end of their journey, thousands of kilometers away.
The North Brazil current carries upper-ocean waters northwards to the Equator with a max-imum transport of up to 36 Sv (Sv = 106m3s-1) at depths of over 600 m [56]. By keeping their trajectories confined close to the shore, i.e. within an average 23 km from the coastline, turtles show a strategy to save energy by avoiding the strong North Brazil current, which flows at its
highest velocities at around 100 km offshore. Furthermore, the post-nesting migration of green turtles spans from April to September; this period coincides with the velocity peak of the North Brazil current, which is at its highest from July to August [56]. Despite the great speed of the North Brazil current, turtles may also be affected by tidal processes as they are travelling very close to the shore. Over the French Guiana continental shelf, tidal currents therefore influence the inner shelf, within 15–20 km from the coastline [57]. During flood of spring tides, tidal cur-rents are directed to the coast, and thus influence the total curcur-rents, reaching up to 0.45 m.s-1 [57]. The alongshore current can therefore be turned into a cross-shore current, that favor tur-tles displacements. Decreasing bathymetry combined with bottom friction may also play a sig-nificant role in coastal current dissipation alongshore [58,59], explaining why turtles keep their trajectories close to the shore before and after the plume, saving energy during migration. In addition, the first individuals to leave the nesting site in April probably avoided the peak strength of the North Brazil current, giving them the opportunity to reach their foraging grounds rapidly and begin their foraging activity further south. In contrast, turtles would face higher energy requirements when migrating at the end of the season, i.e. when the currents are at their strongest at the end of May or even during June.
Behavioral adjustments to cross the Amazon River plume
The significant increase in distance to shore for all individuals when crossing the plume indi-cates that the green turtles also adapted their behavior to the Amazon River plume. Two differ-ent spatial patterns appeared: some individuals remained close to shore during the plume crossing, whereas others swam farther from the shore, i.e. up to 200 km offshore. The latter spent more time in the plume phase due to the higher current velocity at greater distances from the coastline. This suggests that travelling alongshore when crossing the plume is probably the optimal dispersal strategy to avoid the strong North Brazil current and reach the foraging grounds more rapidly for body reserve repletion. However, turtles could also cross the mouth of the Amazon further out to sea, either to avoid the high current velocity of the plume, or, more probably, to reduce the distance travelled by choosing the shortest path to reach the for-aging grounds instead of following the coastline [10].
Although the strength of the plume appears to be relatively stable across the years, the Ama-zon River plume shows a notable seasonal variability [53,60,61], with river discharges that attain maximum levels of approximately 2.4 x 10⁵m3s-1between May and June [53]. This vari-ability could lead to the selection of different foraging areas within the breeding seasons, with a potential lack of site fidelity among individuals. Indeed, unlike the green turtles of the Mediter-ranean sea, which use similar migratory routes to reach the same foraging grounds from one year to the next [62], green turtles in the Equatorial Atlantic may use different foraging areas off the Brazilian coast throughout the breeding seasons, depending on the date migration begins. Indeed, the interannual variability of the number of clutches laid and the variable remi-gration interval (from 2 to 3 years) observed in green turtles of the Mediterranean Sea [63] could potentially affect the duration of the inter-nesting season, and consequently the month migration starts. In turn, it might define the month during which turtles might cross the river plume. It would therefore be interesting in a future study to tag the same individuals to com-pare their different post-nesting migration routes and assess site fidelity.
Crossing this physical barrier may alter the rest of the migration, and consequently affect the choice of foraging ground location and the time required to reach foraging grounds. Our data show that the longer individuals stayed within the plume, the sooner they initiated forag-ing on seagrass beds, suggestforag-ing that the crossforag-ing of the highly turbulent plume resulted in higher energy expenditure. In contrast, turtles that crossed the plume at a higher speed stopped
further south, where seagrass beds tend to be of higher quality and are more abundant. The date of departure was an important factor, as the first individuals to leave the nesting site crossed the plume more rapidly. Indeed, given that the velocity peak of the Amazon plume is reached in May-June, individuals that left French Guiana early in the inter-nesting season, i.e. in April or beginning of May probably avoided the peak of water discharges, therefore limiting their energy expenditure. Nevertheless, whatever the time spent within the plume, travel speed was higher for all individuals within the plume, confirming the need to cross this unfavorable area (without seagrass or visibility) as fast as possible, as there is no possibility to feed en-route [10]. After the plume, the reduced travel speeds associated with two different stopover areas identified by Baudouin et al. [21] reinforce the assumption that individuals would need to recover after crossing such a turbulent zone.
Diving behavior might also change during migration in an effort to adapt to various abiotic conditions. Simulations of the Amazon River discharge have demonstrated a weak return cur-rent in the underlying seawater beneath the surface and a reduction of the plume velocity in deeper layers [53]. Since the plume is 3–10 m deep [61], individuals could avoid the strong cur-rent and turbid surface layer by targeting specific depths beyond 10 m. This could be confirmed by retrieving the tags and downloading the high resolution data that were not transmitted. The shorter dives within the plume highlight the energetic costs involved in crossing such a turbu-lent area, and could be a means to avoid being swept seaward by the Amazon flow. Short dives could also enable green turtles to return to the surface more frequently, as they may use air-borne odorants associated with land to maintain their course in the highly turbid waters of the plume. This theory was demonstrated in loggerhead turtles [64] and could be an additional ori-entation cue used by green turtles nesting in French Guiana during their migration. It would be interesting to deploy acceleration data loggers in a further study to determine the relationships between energetic expenditure and environmental variables and investigate whether green tur-tles feed en-route before reaching their foraging grounds [65,66].
Conclusions and Perspectives
Our data provide detailed information on the habitat requirements for one of the two main activities occurring in the life cycle of adult green turtles, i.e. post-nesting migration to foraging areas. This study highlights several behavioral adjustments in both horizontal and vertical movements in response to a highly dynamic zone under the influence of the North Brazil Cur-rent and the Amazon River plume. Unlike green turtles from Ascension Island, which use the South Atlantic equatorial current during their post-nesting migration [67], green turtles from French Guiana seem to perform the opposite strategy and swim against the currents during their post-nesting migration. The deployment of tags on females at the foraging grounds in Brazil, before their return journey to French Guiana, would be an opportunity to investigate the potential use of the North Brazil current by green turtles on their return trip to optimize the energy stores they have gained at the foraging grounds. Contrary to the pattern seen over their migration towards the foraging grounds, turtles might therefore migrate farther from the coast on their return journey in order to take advantage of stronger currents.
Supporting Information
S1 Fig. a) Variances of the FPT according to the ARS spatial scale (r in km) for each indi-vidual. The red dotted lines and the bold numbers indicate the radii referring to the highest FPT variances. b) FPT (in days) over time for the optimum radii of each individual. The red lines indicate Lavielle segmentation corresponding to the ARS events.
S2 Fig. Monthly Kddistributions (in m-1) over the whole study area extracted daily from
Mercator-Ocean GLORYS-2v1 (Global Ocean ReanalYsis and Simulations) in (A) April, (B) May, (C) June, (D) July, (E) August, (F) September and (G) October.The shoreline was extracted from NOAA National Geophysical Data Center, Coastline.
(DOCX)
S1 Table. Summary of the horizontal movements of the 19 individuals over the entire track-ing period.Nloc refers to the total number of positions recorded per individual.
(DOCX)
Acknowledgments
This study was carried out within the framework of the Plan National d’Action Tortues Marines de Guyane and was produced as part of the CARET2 cooperation project between French Guiana and Suriname, headed by the French Guiana office of WWF-France, in partner-ship with Kwata NGO, the French National Agency for Hunting and Wildlife (ONCFS), the French Guiana Regional Nature Park (PNRG) and WWF Guianas, PRTM. The CARET2 pro-gram was co-financed by the OP Amazonia with the European Union ERDF fund, the Ministry of Ecology, Sustainable Development and Energy, and the French National Centre for Space Studies (CNES). It was also supported by the French Guiana Regional Council. PC’s PhD scholarship was supported by Shell and CNES Guyane. The authors also appreciate the support of the ANTIDOT project (Pépinière Interdisciplinaire Guyane, Mission pour l'Interdisciplinar-ité, CNRS). We would like to thank V. Ridoux for his valuable comments on the paper, and Anne Corval (CNRS Guyane), Hélène Delvaux (DEAL Guyane) and Eric Hansen (ONCFS DIROM) for their strong support and help in developing this project.
Author Contributions
Conceived and designed the experiments: DC. Performed the experiments: DC. Analyzed the data: PC. Contributed reagents/materials/analysis tools: DP VV PG BT DC. Wrote the paper: PC DP VV LK ME CG RB KB PG YLM.
References
1. Alerstam T, Hedenström A, Akesson S. Long-distance migration: evolution and determinants. OIKOS. 2003; 103: 247–260.
2. Dingle H, Drake VA. What Is Migration? BioScience. 2007; 57: 113–121. doi:10.1641/B570206
3. Hobson KA. Tracing origins and migration of wildlife using stable isotopes: a review. Oecologia. 1999; 120: 314–326.
4. Rasmussen K, Palacios DM, Calambokidis J, Saborio MT, Dalla Rossa L, Secchi ER, et al. Southern Hemisphere humpback whales wintering off Central America: insights from water temperature into the longest mammalian migration. Biol Lett. 2007; 3: 302–305. doi:10.1098/rsbl.2007.0067PMID:
17412669
5. Fossette S, Heide-Jørgensen M- P, Villum Jensen M, Kiszka J, Bérubé M, Bertrand N, et al. Humpback whale (Megaptera novaeangliae) post breeding dispersal and southward migration in the western Indian Ocean. J Experiemental Mar Biol Ecol. 2013; 450: 6–14.
6. Egevang C, Stenhouse IJ, Phillips RA, Petersen A, Fox JW, Silk JRD. Tracking of Arctic terns Sterna paradisaeareveals longest animal migration. Proc Natl Acad Sci. 2010; 107: 2078–2081. doi:10.1073/ pnas.0909493107PMID:20080662
7. Van Ginneken VJ, Van den Thillart GE. Physiology: Eel fat stores are enough to reach the Sargasso. Nature. 2000; 403: 156–157. PMID:10646590
8. Weng KC, Boustany AM, Pyle P, Anderson SD, Brown A, Block BA. Migration and habitat of white sharks (Carcharodon carcharias) in the eastern Pacific Ocean. Mar Biol. 2007; 152: 877–894.
9. Hays G, Luschi P, del Seppia C. Changes in behaviour during the inter-nesting period and post-nesting migration for Ascension Island green turtles. Marine Ecology Progress Series. 1999; 189: 263–273. doi:10.3354/meps189263
10. Godley B, Richardson S, Broderick A, Coyne M, Glen F, Hays G. Long-term satellite telemetry of the movements and habitat utilisation by green turtles in the Mediterranean. Ecography. 2002; 25: 352– 362. doi:10.1034/j.1600-0587.2002.250312.x
11. Luschi P, Hays G, Papi F. A review of long-distance movements by marine turtles, and the possible role of currents. OIKOS. 2003; 103: 293–302.
12. Miller JD. Reproduction in sea turtles. The biology of sea turtles (Lutz PL and Musick JA, eds). CRC Press, Boca Raton, FL. 1997. pp. 51–81.
13. Gittleman JL, Thompson SD. Energy Allocation in Mammalian Reproduction. Am Zool. 1988; 28: 863– 875. doi:10.1093/icb/28.3.863
14. Wallace BP, Williams CL, Paladino FV, Morreale SJ, Lindstrom RT, Spotila JR. Bioenergetics and div-ing activity of internestdiv-ing leatherback turtles Dermochelys coriacea at Parque Nacional Marino Las Baulas, Costa Rica. J Exp Biol. 2005; 208: 3873–3884. doi:10.1242/jeb.01860PMID:16215215
15. Godley B, Blumenthal J, Broderick A, Coyne M, Godfrey M, Hawkes L, et al. Satellite tracking of sea tur-tles: Where have we been and where do we go next? Endanger Species Res. 2007;3. doi:10.3354/ esr00060
16. Scott R, Marsh R, Hays GC. Ontogeny of long distance migration. Ecology. 2014; 95: 2840–2850. doi:
10.1890/13-2164.1
17. Hays GC, Fossette S, Katselidis KA, Mariani P, Schofield G. Ontogenetic development of migration: Lagrangian drift trajectories suggest a new paradigm for sea turtles. J R Soc Interface. 2010; 7: 1319– 1327. doi:10.1098/rsif.2010.0009PMID:20236958
18. Lutz PL, Musick JA. The Biology of Sea Turtles. CRC Press; 1996.
19. Short F, Carruthers T, Dennison W, Waycott M. Global seagrass distribution and diversity: A biore-gional model. J Exp Mar Biol Ecol. 2007; 350: 3–20. doi:10.1016/j.jembe.2007.06.012
20. Bass AL, Epperly SP, Braun-McNeill J. Green Turtle (Chelonia mydas) Foraging and Nesting Aggrega-tions in the Caribbean and Atlantic: Impact of Currents and Behavior on Dispersal. J Hered. 2006; 97: 346–354. PMID:16782781
21. Baudouin M, de Thoisy B, Chambault P, Berzins R, Entraygues M, Kelle L, et al. Identification of key marine areas for conservation based on satellite tracking of post-nesting migrating green turtles (Chelo-nia mydas). Biol Conserv. 2015; 184: 36–41. doi:10.1016/j.biocon.2014.12.021
22. Copertino MS. Seagrass distribution across Brazilian Coast. Institute of Oceanography-Federal Uni-versity of Rio Grande—International Blue Carbon Scientific Working Group; 2013; Sydney-Australia. 23. Dagg M, Benner R, Lohrenz S, Lawrence D. Transformation of dissolved and particulate materials on continental shelves influenced by large rivers: plume processes. Cont Shelf Res. 2004; 24: 833–858. doi:10.1016/j.csr.2004.02.003
24. Milliman J, Meade R. World-wide delivery of river sediment to the ocean. J Geol. 1983;91.
25. Meade RH. River-sediment inputs to major deltas, in Sea-level rise and coastal subsidence: causes, consequences, and strategies. Kluwer Acad, Norvwell. 1996; 63–85.
26. DeMaster D, Smith W, Nelson D, Aller J. Biogeochemical processes in Amazon shelf waters: chemical distributions and uptake rates of silicon, carbon and nitrogen. Cont Shelf Res. 1996; 16: 617–643. doi:
10.1016/0278-4343(95)00048-8
27. Molleri GS, Novo EM de M, Kampel M. Space-time variability of the Amazon River plume based on sat-ellite ocean color. Cont Shelf Res. 2010; 30: 342–352. doi:10.1016/j.csr.2009.11.015
28. Seminoff JA, Resendiz A, Nichols WJ, Jones TT, Guyer C. Growth Rates of Wild Green Turtles (Chelo-nia mydas) at a Temperate Foraging Area in the Gulf of Califor(Chelo-nia, México. Copeia. 2002; 2002: 610– 617. doi:10.1643/0045-8511(2002)002[0610:GROWGT]2.0.CO;2
29. Hays GC, Broderick AC, Glen F, Godley BJ. Change in body mass associated with long-term fasting in a marine reptile: the case of green turtles (Chelonia mydas) at Ascension Island. Can J Zool. 2002; 80: 1299–1302. doi:10.1139/z02-110
30. Heerah K, Andrews-Goff V, Williams G, Sultan E, Hindell M, Patterson T, et al. Ecology of Weddell seals during winter: Influence of environmental parameters on their foraging behaviour. Deep Sea Res Part II Top Stud Oceanogr. 2013; 88–89: 23–33. doi:10.1016/j.dsr2.2012.08.025
31. Lopez R, Malarde J- P, Royer F, Gaspar P. Improving Argos Doppler Location Using Multiple-Model Kalman Filtering. IEEE Trans Geosci Remote Sens. 2014; 52: 4744–4755. doi:10.1109/TGRS.2013. 2284293
32. Patterson TA, McConnell BJ, Fedak MA, Bravington MV, Hindell MA. Using GPS data to evaluate the accuracy of state–space methods for correction of Argos satellite telemetry error. Ecology. 2010; 91: 273–285. PMID:20380216
33. R Core Team. R: A language and environment for statistical computing. R Foundation for Statistical Computing, Vienna, Austria. URLhttp://www.R-project.org/. 2014;
34. Fauchald P, Tveraa T. Using first-passage time in the analysis of area-restricted search and habitat selection. Ecology. 2003; 84: 282–288. doi:10.1890/0012-9658(2003)084[0282:UFPTIT]2.0.CO;2
35. Suryan RM, Sato F, Balogh GR, Hyrenbach D, Sievert PR, Ozaki K. Foraging destinations and marine habitat use of short-tailed albatrosses: A multi-scale approach using first-passage time analysis. Deep Sea Res Part II Top Stud Oceanogr. 2006; 53: 370–386. doi:10.1016/j.dsr2.2006.01.012
36. Weimerskirch H, Pinaud D, Pawlowski F, Bost C. Does Prey Capture Induce Area-Restricted Search? A Fine-Scale Study Using GPS in a Marine Predator, the Wandering Albatross. Am Nat. 2007; 170: 734–743. PMID:17926295
37. Pinaud D. Quantifying search effort of moving animals at several spatial scales using first-passage time analysis: effect of the structure of environment and tracking systems. J Appl Ecol. 2008; 45: 91–99. doi:
10.1111/j.1365-2664.2007.01370.x
38. Lavielle M. Using penalized contrasts for the change-point problem. Signal Process. 2005; 85: 1501– 1510. doi:10.1016/j.sigpro.2005.01.012
39. Luque S. Diving Behaviour Analysis in R. R News. 2007; 7: 8–14.
40. Gaspar P, Georges J- Y, Fossette S, Lenoble A, Ferraroli S, Maho YL. Marine animal behaviour: neglecting ocean currents can lead us up the wrong track. Proc R Soc B Biol Sci. 2006; 273: 2697– 2702. doi:10.1098/rspb.2006.3623
41. Zuur A, Ieno EN, Walker N, Saveliev AA, Smith GM. Mixed Effects Models and Extensions in Ecology with R. Springer Science & Business Media; 2009.
42. Robert J, Hijmans, Jacob van Etten. raster: Geographic analysis and modeling with raster data. R pack-age version 2.0–12. 2012; Available:http://CRAN.R-project.org/package = raster
43. Pebesma E. Multivariable geostatistics in S: the gstat package. Comput Geosci. 2004; 30: 683–691. 44. Troëng S, Evans DR, Harrison E, Lagueux CJ. Migration of green turtles Chelonia mydas from
Tortu-guero, Costa Rica. Mar Biol. 2005; 148: 435–447. doi:10.1007/s00227-005-0076-4
45. Godley BJ, Broderick AC, Hays GC. Nesting of green turtles (Chelonia mydas) at Ascension Island, South Atlantic. Biol Conserv. 2001; 97: 151–158. doi:10.1016/S0006-3207(00)00107-5
46. Seminoff JA, Zarate P, Coyne M, Foley DG, Parker D, Lyon BN, et al. Post-nesting migrations of Galá-pagos green turtles Chelonia mydas in relation to oceanographic conditions: integrating satellite telem-etry with remotely sensed ocean data. Endanger Species Res. 2008; 4: 57–72.
47. Lee KS, Dunton KH. Effect of in situ light reduction on the maintenance, growth and partitioning of car-bon resources in Thalassia testudinum Banks ex König. J Exp Mar Biol Ecol. 1997; 210: 53–73. doi:10. 1016/S0022-0981(96)02720-7
48. Lee KS, Park SR, Kim YK. Effects of irradiance, temperature, and nutrients on growth dynamics of sea-grasses: A review. J Exp Mar Biol Ecol. 2007; 350: 144–175. doi:10.1016/j.jembe.2007.06.016
49. Onuf CP. Seagrasses, Dredging and Light in Laguna Madre, Texas, U.S.A. Estuar Coast Shelf Sci. 1994; 39: 75–91. doi:10.1006/ecss.1994.1050
50. Oliveira EC, Corbisier TN, de Eston VR, Ambrósio O Jr. Phenology of a seagrass (Halodule wrightii) bed on the southeast coast of Brazil. Aquat Bot. 1997; 56: 25–33. doi: 10.1016/S0304-3770(96)01097-2
51. Pritchard PC. Post-Nesting Movements of Marine Turtles (Cheloniidae and Dermochelyidae) Tagged in the Guianas. Copeia. 1976; 1976: 749. doi:10.2307/1443458
52. Barnard PL, Hays G, Del Seppia C, Marsh R, Papi F. The navigational feats of green sea turtles migrat-ing from Ascension Island investigated by satellite telemetry. Proc R Soc Lond B Biol Sci. 1998; 265: 2279–2284. doi:10.1098/rspb.1998.0571
53. Nikiema O, Devenon J- L, Baklouti M. Numerical modeling of the Amazon River plume. Cont Shelf Res. 2007; 27: 873–899. doi:10.1016/j.csr.2006.12.004
54. Caut S, Guirlet E, Angulo E, Das K, Girondot M. Isotope Analysis Reveals Foraging Area Dichotomy for Atlantic Leatherback Turtles. PLoS ONE. 2008; 4. doi:10.1371/journal.pone.0001845PMID:
18365003
55. McMahon C, Bradshaw C, Hays G. Satellite tracking reveals unusual diving characteristics for a marine reptile, the olive ridley turtle Lepidochelys olivacea. Mar Ecol Prog Ser. 2007; 329: 239–252. doi:10. 3354/meps329239
56. Johns W, Lee T, Beardsley R, Candela J, Limeburner R, Castro B. Annual Cycle and Variability of the North Brazil Current. J Phys Oceanogr. 1998; 28: 103–128. doi:10.1175/1520-0485(1998)028<0103: ACAVOT>2.0.CO;2
57. Bourret A, Devenon J, Chevalier C. Tidal influence on the hydrodynamics of the French Guiana conti-nental shelf. Cont Shelf Res. 2008; 28: 951–961. doi:10.1016/j.csr.2008.01.008
58. Feddersen F, Guza R. Observations of nearshore circulation: Alongshore uniformity. J Geophys Res Oceans. 2003; 108: 3006. doi:10.1029/2001JC001293
59. Hansen JE, Janssen TT, Raubenheimer B, Shi F, Barnard PL, Jones IS. Observations of surfzone alongshore pressure gradients onshore of an ebb-tidal delta. Coast Eng. 2014; 91: 251–260. doi:10. 1016/j.coastaleng.2014.05.010
60. Nittrouer CA, DeMaster DJ. The Amazon shelf setting: tropical, energetic, and influenced by a large river. Cont Shelf Res. 1996; 16: 553–573. doi:10.1016/0278-4343(95)00069-0
61. Hu C, Montgomery ET, Schmitt RW, Muller-Karger FE. The dispersal of the Amazon and Orinoco River water in the tropical Atlantic and Caribbean Sea: Observation from space and S-PALACE floats. Deep Sea Res Part II Top Stud Oceanogr. 2004; 51: 1151–1171. doi:10.1016/j.dsr2.2004.04.001
62. Broderick AC, Coyne MS, Fuller WJ, Glen F, Godley BJ. Fidelity and over-wintering of sea turtles. Proc R Soc B Biol Sci. 2007; 274: 1533–1539. doi:10.1098/rspb.2007.0211
63. Broderick AC, Godley BJ, Hays GC. Trophic status drives interannual variability in nesting numbers of marine turtles. Proc Biol Sci. 2001; 268: 1481–1487. doi:10.1098/rspb.2001.1695PMID:11454292
64. Endres CS, Lohmann KJ. Detection of coastal mud odors by loggerhead sea turtles: a possible mecha-nism for sensing nearby land. Mar Biol. 2013; 160: 2951–2956. doi:10.1007/s00227-013-2285-6
65. Gallon S, Bailleul F, Charrassin J, Guinet C, Bost C, Handrich Y, et al. Identifying foraging events in deep diving southern elephant seals, Mirounga leonina, using acceleration data loggers. Deep Sea Res Part II Top Stud Oceanogr. 2013; 88–89: 14–22. doi:10.1016/j.dsr2.2012.09.002
66. Fossette S, Gleiss A, Myers AE, Garner S, Liebsch N, Whitney NM, et al. Behaviour and buoyancy reg-ulation in the deepest-diving reptile: the leatherback turtle. J Exp Biol. 2010; 213: 4074–4083. doi:10. 1242/jeb.048207PMID:21075949
67. Luschi P, Hays GC, Seppia CD, Marsh R, Papi F. The navigational feats of green sea turtles migrating from Ascension Island investigated by satellite telemetry. Proc R Soc Lond B Biol Sci. 1998; 265: 2279–2284. doi:10.1098/rspb.1998.0571