HAL Id: halsde-00441722
https://hal.archives-ouvertes.fr/halsde-00441722
Submitted on 8 Feb 2021
HAL is a multi-disciplinary open access
archive for the deposit and dissemination of
sci-entific research documents, whether they are
pub-lished or not. The documents may come from
teaching and research institutions in France or
abroad, or from public or private research centers.
L’archive ouverte pluridisciplinaire HAL, est
destinée au dépôt et à la diffusion de documents
scientifiques de niveau recherche, publiés ou non,
émanant des établissements d’enseignement et de
recherche français ou étrangers, des laboratoires
publics ou privés.
Digital elevation analysis for ditributed hydrological
modelling : reducing scale dependence in effective
hydraulic conductivity values
Georges-Marie Saulnier, K. Beven, Charles Obled
To cite this version:
Georges-Marie Saulnier, K. Beven, Charles Obled. Digital elevation analysis for ditributed hydrological
modelling : reducing scale dependence in effective hydraulic conductivity values. Water Resources
Research, American Geophysical Union, 1997, 33 (9), pp.2097-2101. �10.1029/97WR00652�.
�halsde-00441722�
Digital elevation analysis for distributed hydrological modeling:
Reducing scale dependence in effective hydraulic
conductivity values
Georges-Marie Saulnier
Laboratoire d'6tude des Transferts en Hydrologie et Environnement, Institut National Polytechnique de Grenoble
Domaine Universitaire, Grenoble, France
Keith Beven
Centre for Research on Environmental Systems and Statistics, Institute of Environmental and Biological Sciences
Lancaster University, Lancaster, England
Charles Obled
Laboratoire d'6tude des Transferts en Hydrologie et Environnement, Institut National Po!ytechnique de Grenoble
Dornaine Universitaire, Grenoble, France
Abstract. The recent widespread availability of digital terrain data has made automatic
procedures
for topographic
analyses
popular.
Previous
studies
have
shown
that
hydrological models and their effective parameter values are dependent on the resolution
of the elevation grid. This paper examines the aoalysis of raster elevation data within the
topography-based
model,
TOPMODEL,
frameWOrk.
It is demonstrated
that the algorithm
used
in processing
channel
pixels
in calculating
the topographic
index
• = In(a/tan/3)
can
have a dramatic effect on the sensitivity of effective parameter values to the grid size.
Suggestions are made for calculating the topographic index of channel pixels, consistent
with the TOPMODEL assumptions,
that strongly
decrease
the sensitivity
of the calibrated
effective hydraulic conductivity values to grid size.
Introduction
This study addresses the problem of grid scale dependence
of the effective parameter values of distributed hydrological
models. Such dependence has been recognized in the past but
is not well understood. The rapid increase in both computer
power and the availability of geographical information systems
and digital terrain maps (DTMs) in many countries and catch-
merits is encouraging the use of distributed models. This study
makes use of the topography-based model, TOPMODEL
[Beven and Kirkby, 1979; Beven et al., 1995], which was one of
the first attempts to model distributed hydrological responses
based on variable contributing area concepts. It has become
increasingly popular in recent years as it provides a relatively
simple flamework for t•he use of DTM data and entry to dis-
tributed predic.tion. TOPMODEL makes use of a topographic
index of hydrological similarity based on an analysis of the
topographic data, where the form of the index depends on
assumptions about the profile of transmissivity [Ambroise et al.,
1996a, b].
In ear!y studies [Beven and Kirkby, 1979] the topographic
index was calculated from contour maps, where the expected
downslope flow lines were drawn manually. This was an ex-
tremely tedious process but had the advantage that features
affecting the accumulation of flow downslope, such as small
channels
and field boundary
ditches,
could
easily
be incorpo-
rated into the procedures. However, DTM data are now most
Copyright 1997 by the American Geophysical Union. Paper number 97WR00652.
0043-1397/97/97WR-00652509.00
readily available in raster grid. Quinn et al. [1991, 1995] sug- gested an automatic procedure to calculate the topographic
index of TOPMODEL based on the analysis of raster DTM
data.
Some recent studies showed tha. t the predictions of TOP-
MODEL are sensitive to the resolution of the DTM used to
calculate the map of topographic index [e.g., Wolock and Price,
1994; Zhang and Montgomery, 1994], but tha.t calibration of
parameter
values
can
often
compensate
for a lack
of resolution
of the DTM [e.g.,
Bruneau
et al., 1995;
Quinn
et al., 1'995;
Wolock and McCabe, 1995; Franchini et al., 1996; Saulnier et al.,
1997]. This scale dependence is probably true of all distributed
models (see discussion of Beven [1989]) but has been investi-
gated most fully for TOPMODEL where, probably as a result
of the simplifications inherent in the index-based predictions,
the effect is marked.
Within the TOPMODEL framework the form of the index distribution plays two roles [see Beven et al., 1995]. The mean of the distribution X enters into the calculation of subsurface ,
drainage from the hillslope soils Qb (for an exponential trans-
missiv•ity profile) as
Q b = To exp ( - X) exp ( - S/m)
where T O is the transmissivity when the soil is just saturated, m
is a parameter controlling the expon.ential decline of transmis-
sivity
with depth,
and
• is a mean
catchment
storage
deficit
due
to drainage. The magnitude of Q b will directly affect the value of S during a simulation. In the second role the upper tail of
the distribution controls the expansion and contraction of the
saturated contributing area as the catchment wets and dries
2098 SAULNIER ET AL.: TECHNICAL NOTE 2500 -- o Ko extrapolated (m/h) ... 2000
1500
500
0-
0 20 40 60 80 100 !20 DTM grid s izl• (m)Figure 1. Extrapolated values of Ko for the 40, 60, 80, 100,
and 120 m mesh
size
digital
terrain
map (DTM) versus
inde-
pendently optimized values of Ko for each DTM (Maurets
catchment [Saulnier et al., 1997]).
ments of a more realistic multidirectional method for hillslopes
and a more realistic single-flow algorithm for valley bottoms by
making different assumptions for hillslope pixels and channel
pixels. For a pixel containing the river, the accumulated area is
redistributed downslope to the steepest downslope pixel (sin-
gle-flow direction algorithm), while accumulated area still con-
tinues to be propagated by a multiple-flow directions method
as for pixels on hillslopes. Then pixels that contain a river are
removed from the DTM and are not used for the calculation of the topographic index distribution [see also Iorgulescu and Jordan, 1995].
However, removing these channel pixels entirely could, in
some circumstances, limit the predictive capability of the
model as those pixels tend to be the most often saturated and thus the most important for the saturated area runoff genera- tion. The remainder of this note explores the effect of the
treatment of channel pixels on TOPMODEL simulations of
the Maurets catchment in southern France.
through the relationship (also for an exponential transmissivity
profile):
S i -- • -• m(A - Ki)
where S i is the local value of storage deficit at a point with a
topographic index value of Ki. High values of gi will result in
S i values that are at or less than zero, indicating saturation.
These roles are interlinked through the dynamic variation in S.
For the exponential profile, downslope transmissivity is related
to a downslope effective saturated hydraulic conductivity at the
soil surface approximately as T O = mKo.
It has been found that, in particular, calibrated downslope
saturated conductivity value Ko increases with grid size, com-
pensating for the change in the distribution of gi. Franchini et
al. [1996] showed that an analytical link could be established
between the calibrated value of Ko and the DTM grid size
when the topographic index distribution of two DTMs of the
same catchment but with different grid sizes are of identical form but shifted along the index axis (the "shift effect"). HOW-
ever, Saulnier et al. [1997] showed that when the DTM grid size
increases, the topographic index distribution could also be deformed and that this shape effect could even be a first-Order
effect in controlling the way the effective conductivity Ko was
increasing with the DTM grid size. They then suggested a
generalized relation between the effective value of downslope
saturated conductivity Ko and the characteristics of the topo-
graphic index distribution derived for a particular DTM grid size, taking into account both the shift effect and the shape effect. Figure 1 shows the change in the predicted values of
effective conductivity Ko with DTM grid size, given a value for
Ko at 20 m in comparison with the independently calibrated
values of Ko for each DTM grid size.
Thus some understanding now exists of the sensitivity of the
topographic index distribution to the DTM grid scale and the
impact on effective parameter values. However, parameters
that do not show such scale dependence would be a further
improvement, and continued study has revealed that this sen-
sitivity to grid size may, at least in part, result from the way in which channel pixels are handled in the digital terrain analysis.
The problem of calculating the topographic index values for
pixels containing a channel has been examined by Quinn et al.
[1995]. They proposed a solution to the conflicting require-
The Maurets Catchment
The Maurets
catchment
(8.4 km
2) used
in this study
is a
subcatchment of the experimental research catchment of the
R6al Collobrier
(71 km2).
It is located
in the south
of France
in the Maures massif at nearly 15 km from the Mediterranean sea coast. The elevation ranges between 209 m at the outlet
and 770 m, with an average altitude of about 440 m. A digital
terrain map of the Maurets catchment at a resolution of 20 m was prepared by digitizing 10 m contour lines from a 1/25000
map [Weesakul, 1992]. Additional details are given by Saulnier
et al. [1997].
Channel Network Identification on the DTM
To demonstrate the effect of channel pixels on the hydro-
logical simulations, it is first necessary to determine the chan-
nel network within the DTM. This can be achieved by over- laying the channel network digitized from a map at an appropriate scale. Alternatively, an algorithm for the semiau- tomatic identification of the channel is required. Both ap-
proaches have their limitations; the second approach has been
used here. The extraction of channel networks from DTM is a
complex problem, as the prediction of the channel head can be
difficult [see, e.g., Montgomery and Dietrich, 1989; Tarboton et
al., 1991]. The algorithm used here searches first for the chan-
nel head and then assumes that the channel can be derived
from those river endings using a steepest single-pathway de-
scent method. This is similar to the algorithm suggested by
Quinn et al. [1995], except that the channel heads are not
identified in the same way. Quinn et al. [1995] assume that a
river ending is a pixel with an upslope area that is greater than
some threshold value. This threshold coarsely determines the
length of the channel network. To this threshold another
threshold on the topographic index value has been added. This
new threshold gives greater control over the density of the
network by allowing channels to start at less (low value of the
threshold on the topographic index) or more (high value of the
threshold) convergent or shallow hillslope pixels. The two val-
ues of the threshold
are adjusted
to best
fit a map of the
observed perennial network drawn on a map at the 1/25000
scale of the National Institute Of Geography of France. Using
this method, networks have been extracted for all grid sizes from 20 m to 100 m.
Structure of the Topographic Index Distribution
.As noted above, the use of DTM data with increasing grid
size affects the topographic index distribution by a shift effect
and a shape effect. In the particular case of the Maurets catch- merit the shape effect is a first-order effect [Sattinier e! at.,
1997]. This shape effect comes from the increase in the relative
number of pixels with large topographic index values (the up-
per tail of the distribution). Where upslope areas are allowed
to continue to accumulate along the valley bottom, this upper
tail of the topographic index distribution is usually dominated
by the topographic index value of the pixels in, or near, the
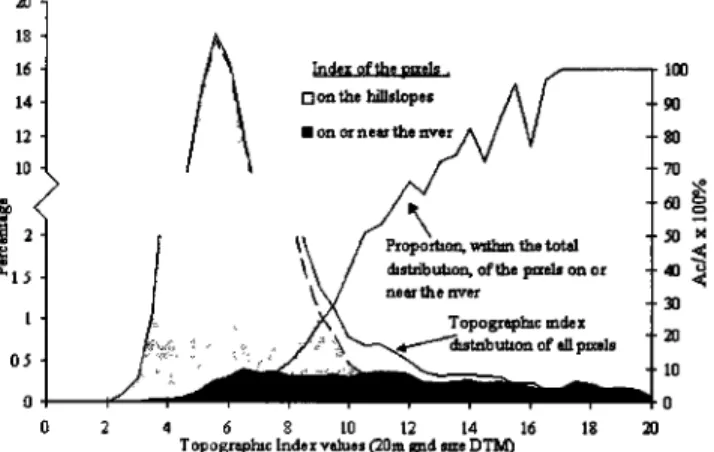
channel network, as shown in Figure :2. Figure :2 shows also the
values of the topographic index of the pixels near the river
which, in the simplest multiple-flow direction method [Quinn et
at., 1•1; Freeman, 1•1], can receive area distributed from upslope from "channel" pixels, even if the pixel does not con-
tain a channel. Thus pixels near the river are also influenced by
the choice of the algorithm of calculation of the topographic
index of the pixel crossed by a channel. Above a value of 10 on
the topographic index, pixels on or near the river represent more than half of the total distribution. This problem gets
worse as grid size increases, since it can be shown that the
relative number of channel pixels will tend to grow linearly
with increasing grid size.
This is an explanation of the linear sensitivity of the pre-
dicted saturated area to the DTM grid size, reported by
Wotock and Price [1994] and Sattinier e! aL [1997]. Thus it can
be inferred that the sensitivity of the shape of the topographic
index distribution to the DTM grid size is primarily due to the
topographic index values of pixels that are crossed by a channel
that are being overestimated by allowing area to accumulate
down the valley axis. In many cases, river width will be small
relative to DTM grid size. In such cases, it will be more ap-
propriate to treat pixels crossed by a channel as hillslope pixels
rather than channel pixels. There may be some contribution of
subsurface from up valley but inclusion of all the up valley
accumulated area will generate a bias in the calculated index.
A similar argument applies to the slope values used. In the case of a hillslope drained by a channel, the slope of the hillslope
toward the channel will control the subsurface drainage more
than the down-valley slope [see, e.g., Mero! e! at., 1995].
Techniques for Calculating the Topographic Index
of a Pixel Crossed by a Channel
Two methods of calculation for the pixels crossed by a chan-
nel have been tested. In both cases all drainage from up valley
is assumed to be transported in the channel, which also acts as
a sink for the local hillslope runoff. Hillslope pixels have been treated by the multiple-flow direction algorithm of Quinn et at. [1991, 1995]. The first method does not differentiate between
the hillslopes of the right and left river bank. The accumulated
area is then the sum of the area of the right-hand and left-hand
hillslope, spread over twice the channel length since each hill-
slope is independently drained by the channel. The slope that
has been used is the average of the inflow slope from any
upslope hillslope pixels (i.e., not crossed by a channel). The
second method is similar, except that the right and left hillslope
are now differentiated, using the actual upslope areas and
inflow slopes separately. As two topographic index values are
calculated here for a single pixel, these two values are given
half the weight of a hillslope single topographic index value in
20 16 14 12 10 1._5 1 0.5 0 0 lOO 90 80 70 60 • $0 :• 30 20 10 0
Figure 2. Position, within the total topographic index distri-
bution, of the topographic index values of the pixel that are on
or near the river.
the topographic index distribution. It was found that the results
from both methods were very similar in the Maurets catch-
ment, so that only the results of the first are examined in detail
here. Other catchments may show a greater difference between
the two methods.
Application to the Maurets Catchment
The two methods have been first tested on the 20 m grid size
DTM of the Maurets catchment. The two new topographic
index distributions look much more like the topographic index
distribution of hillslope pixels. The upper tail of the distribu-
tion is now much reduced. The map of the topographic index
is also sensitive to this change (Figure 3). It can be seen that
the highest values of the topographic index in the valley bottom
have been removed. Another point to observe, for example,
within the square outline in Figure 3 is that areas of high values
of topographic index can appear more disconnected. That was
not the case in the initial map of the topographic index, where
a large proportion of the predicted saturated area is in the
continuous valley bottom, because of the propagating accumu-
lated area. This phenomenon of saturated, but disconnected,
contributing area could have an influence on the hydrological
behavior, as suggested by Bazemore e! at. [1994] and Cosandey
[1994].
Figure 4 shows the results of applying the new technique to
the range of DTM grid sizes from 20 to 100 m. It is clear that
there is still a tendency for larger grid sizes to result in a shift
of the topographic index distributions to larger values. How-
ever, the relative number of pixels with large index values no
longer increases with grid size and even tends to decrease. This
can be explained by the fact that the slopes that are now used
are the average inflow slopes. When DTM grid size increases,
these slopes are calculated using higher and higher points on
the hillslope. Values of tan/3 will then tend to increase, result-
ing in a decrease in the topographic index values for pixels
crossed by a channel.
Effects in Terms of Hydrological Simulations
TOPMoDEL has been calibrated to rainfall-runoff data for
the Maurets catchmerit using the different topographic index
distributions for the different grid sizes and different methods
2100 SAULNIER ET AL.: TECHNICAL NOTE
... :::::::::::::::::::::::::::::::::::::::::::::::::::::: ...
===================================================================== ... ... ::.::.:::
Scale ß
============================== ::::i::i :::i?'"'""""':•--. :----:• :i:ii:ii:i!ii:': i:: iii::iiiiiiii:::•.-:j!!i::iii•ii!::½?:?:::-i::i?:i:?::ii?.-::?:i :i :i:i::i:i:::• ::ii i:!.:i::: :.-i
.::::::::::::::::::::::::::::::::::::::::::::::::::::::::::::::::::::::::::::::::::.:::::::::: ...
Figure 3. Comparison between (a) the initial map of the topographic index map and (b) the map calculated
by taking into account the river network.
here is an event-based version, considering homogenous soils
all over the catchment, with four parameters calibrated by a
full exploration of a discretized parameter space. Additional
details of the model structure, sample of storms, and calibra-
tion technique are given by Saulnier et al. [1997]. A sensitivity
analysis of the calibrated values showed that the effective sat-
urated conductivity Ko is still the parameter that compensates
for increasing DTM grid size. However, a very important result
is that saturated conductivity does not need to be increased
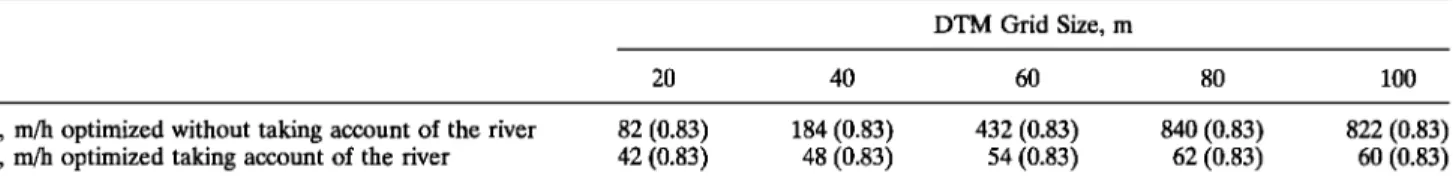
nearly so much to achieve this compensation as shown in Table
1 and Figure 5, which compare the optimized saturated con- ductivity values for each DTM grid size for each method of
handling channel pixels (values of the efficiency measure of
Nash and Sutcliffe [1970] are given in parentheses).
1 0.9 0.8 0.7 0.6 0.5 0.4 0.3 0.2 0.1 0
,•
First
method
at
20m
il ...
First
Firs t method at 60mmethod
at
40m
... First method at 80m
First method at 100m
-,, • Increasing DTM grid size
Increasing DTM grid size •.,..._•
I !
0 2 4 6 8 l0 12 14 16
Topographic Index values
Figure 4. Sensitivity of the new topographic index distribu-
tion to the DTM grid size.
Discussion and Conclusions
Trying to be more consistent with the TOPMODEL assump-
tions and considering that for grid size of most available DTMs
(•20 m or greater) a pixel crossed by a channel is more a
hillslope pixel than a pure river pixel, three modifications have
been suggested to modify the calculation of the topographic
index of the pixel crossed by a river. The first modification is
the nonpropagation of the accumulated area once it has
reached a pixel crossed by a channel. The second modification
is the use of a weighted average inflow slope instead of the
outflow slope for pixels crossed by a channel. Finally, right and
9OO 800 700 6OO 500 3OO 2OO lO0 0 I 7 I I I 20 40 60 80 100 DTM grid size (m)
Figure 5. Optimized saturated conductivity for each DTM
grid size, taking or not taking into account the river network
pixels in the calculation of the topographic index. Circles in-
dicate area allowed to accumulate down valley; diamonds in-
Table 1. Optimized Saturated Conductivity for Each DTM Grid Size, Taking and Not Taking into Account the River
Network in the Calculation of the Topographic Index
DTM Grid Size, m
20 40 60 80 100
Ko, m/h optimized without taking account of the river Ko, m/h optimized taking account of the river
82 (0.83) 184 (0.83) 432 (0.83) 840 (0.83) 822 (0.83) 42 (0.83) 48 (0.83) 54 (0.83) 62 (0.83) 60 (0.83) Note that the values represent downslope hydraulic conductivities just at the soil surface, scaling a profile that is assumed to decline exponentially with depth. Values of the efficiency measure of Nash and Sutcliffe [1970] are given in parentheses.
left river banks may be differentiated by attributing a different
topographic index value for each bank.
A comparison of the different analyses for the Maurets
catchment suggests that the main effect is the nonpropagation
of the accumulated area. The most significant result of this
study is that the new index distribution calculation results in
greatly reduced sensitivity of calibrated hydraulic conductivity
values to the grid scale, resulting from a much more stable
estimate of the upper tail of the index distribution with increas-
ing grid size. This might allow the use of larger DTM grid size,
keeping the same realistic simulation of saturated contributing
areas as the DTM grid size changes.
Acknowledgments. Meteorological data were provided by
CEMAGREF, Aix-en-Provence, France, and spatial data were sup- plied by CEMAGREF-LCT at Montpellier, France. Work on the R6al Collobrier catchment has been partially funded under grant EV5V- CT-91-0039 (project DM2E) from the European Union.
References
Ambroise, B., K. J. Beven, and J. Freer, Toward a generalization of the
TOPMODEL concepts: Topographic indices of hydrological simi-
larity, Water Resour. Res., 32(7), 2135-2145, 1996a.
Ambroise, B., J. Freer, and K. J. Beven, Application of a generalized TOPMODEL to the small Ringelbach catchment, Vosges, France, Water Resour. Res., 32(7), 2147-2159, 1996b.
Bazemore, D. E., K. N. Eshleman, and K. J. Hollenbeck, The role of
soil water in stormflow generation in a forested headwater catch-
ment: Synthesis of natural tracer and hydrometric evidence, J. Hy-
drol., 162, 47-75, 1994.
Beven, K. J., Changing ideas in hydrology: The case of physically-based models, J. Hydrol., 105, 157-172, 1989.
Beven, K. J., and M. J. Kirkby, A physically based variable contributing
area model of basin hydrology, Hydrol. Sci. Bull., 24(1), 43-69, 1979.
Beven, K. J., R. Lamb, P. Quinn, R. Romanowicz, and J. Freer,
TOPMODEL and GRIDATB: A User's guide to the distribution
versions, CRES Tech. Rep. TRl10, 2nd ed., Lancaster Univ., Lan- caster, England, 1995.
Bruneau, P., C. Gascuel-Odoux, P. Robin, P. Merot, and K. J. Beven,
Sensitivity to space and time resolution of a hydrological model
using digital elevation data, Hydrol. Processes, 9, 69-81, 1995.
Cosandey, C., Formation des crues "c6venoles" dans des bassins 61-
6mentaires du Mont Lozbre Flood generation conditions in the Cevennes (southern part of French "Massif Central"), Rev. Sci. Eau,
7, 377-393, 1994.
Franchini, M., J. Wendling, C. Obled, and E. Todini, Physical inter-
pretation and sensitivity analysis of the TOPMODEL, J. Hydrol.,
175, 293-338, 1996.
Freeman, T. G., Calculating catchment area with divergent flow based on a regular grid, Comput. Geosci., 17(3), 413-422, 1991.
Iorgulescu, I., and J.P. Jordan, Validation of TOPMODEL on a small
Swiss catchment, J. Hydrol., 159, 255-273, 1995.
Merot, P., B. Ezzahar, C. Walter, and P. Aurousseau, Mapping water- logging of soils using digital terrain models, Hydrol. Processes, 9,
27-34, 1995.
Montgomery, D. R., and W. E. Dietrich, Source areas, drainage den- sity, and channel initiation, Water Resour. Res., 25(8), 1907-1918,
1989.
Nash, J. E., and J. V. Sutcliffe, River flow forecasting through concep- tual models, 1, A discussion of principles, J. Hydrol., 10, 282-290,
1970.
Quinn, P., K. J. Beven, P. Chevallier, and O. Planchon, The prediction of hillslope flow paths for distributed hydrological modelling using digital terrain models, Hydrol. Processes, 5, 59-79, 1991.
Quinn, P., K. J. Beven, and R. Lamb, The ln(a/tanb) index: How to
calculate it and how to use it within the TOPMODEL framework,
Hydrol. Processes, 9, 161-182, 1995.
Saulnier, G. M., C. Obled, and K. J. Beven, Analytical compensation between DTM grid resolution and effective values of saturated hy-
draulic conductivity within the TOPMODEL framework, Hydrol. Processes, in press, 1997.
Tarboton, D. G., R. L. Bras, and I. Rodriguez-Iturbe, On the extrac- tion of channel networks from digital elevation data, Hydrol. Pro-
cesses, 5, 81-100, 1991.
Weesakul, U., Apport de la t616d6tection et de l'information
g6ographique dans la compr6hension du fonctionnement hy-
drologique de B. V. M6diterran6ens, Thbse de Doctorat, 280 pp.,
Univ. Montpellier II, Montpellier, France, 1992.
Wolock, D. M., and G. J. McCabe, Comparison of single and multiple flow direction algorithms for computing topographic parameters in TOPMODEL, Water Resour. Res., 31(5), 1315-1324, 1995. Wolock, D. M., and C. V. Price, Effects of digital elevation model map
scale and data resolution on a topography-based watershed model, Water Resour. Res., 30(11), 3041-3052, 1994.
Zhang, W., and D. R. Montgomery, Digital elevation model grid size, landscape representation, and hydrological simulations, Water Re- sour. Res., 30(4), 1019-1028, 1994.
K. Beven, Centre for Research on Environmental Systems and Sta-
tistics, Institute of Environmental and Biological Sciences, Lancaster Uni- versity, Lancaster LA1 4YQ, England. (e-mail: [email protected])
C. Obled and G.-M. Saulnier, Laboratoire d'6tude des Transferts en
Hydrologie et Environnement, Institut National Polytechnique de
Grenoble, Domaine Universitaire BP 53, 38041 Grenoble Cedex 9,
France. (e-mail: saulnier@hmg'inpg'fr)
![Figure 1. Extrapolated values of Ko for the 40, 60, 80, 100, and 120 m mesh size digital terrain map (DTM) versus inde- pendently optimized values of Ko for each DTM (Maurets catchment [Saulnier et al., 1997])](https://thumb-eu.123doks.com/thumbv2/123doknet/14778284.594982/3.891.128.389.86.312/figure-extrapolated-digital-pendently-optimized-maurets-catchment-saulnier.webp)