HAL Id: hal-00431803
https://hal.archives-ouvertes.fr/hal-00431803
Submitted on 31 Jul 2020
HAL is a multi-disciplinary open access
archive for the deposit and dissemination of
sci-entific research documents, whether they are
pub-lished or not. The documents may come from
teaching and research institutions in France or
abroad, or from public or private research centers.
L’archive ouverte pluridisciplinaire HAL, est
destinée au dépôt et à la diffusion de documents
scientifiques de niveau recherche, publiés ou non,
émanant des établissements d’enseignement et de
recherche français ou étrangers, des laboratoires
publics ou privés.
fractionation in contrasting trophic environments of the
South East Pacific
I. Tolosa, Juan Carlos Miquel, B. Gasser, Patrick Raimbault, Catherine
Goyet, Hervé Claustre
To cite this version:
I. Tolosa, Juan Carlos Miquel, B. Gasser, Patrick Raimbault, Catherine Goyet, et al.. Distribution
of lipid biomarkers and carbon isotope fractionation in contrasting trophic environments of the South
East Pacific. Biogeosciences, European Geosciences Union, 2008, 5 (3), pp.949-968.
�10.5194/bg-5-949-2008�. �hal-00431803�
www.biogeosciences.net/5/949/2008/
© Author(s) 2008. This work is distributed under the Creative Commons Attribution 3.0 License.
Biogeosciences
Distribution of lipid biomarkers and carbon isotope fractionation in
contrasting trophic environments of the South East Pacific
I. Tolosa1, J.-C. Miquel1, B. Gasser1, P. Raimbault2, C. Goyet3, and H. Claustre4
1International Atomic Energy Agency- Marine Environment Laboratories, 4, quai Antoine 1er, MC 98000, Monaco
2Laboratoire d’Oc´eanographie et de Biog´eochimie (UMR 6535 CNRS), Centre d’Oc´eanologie de Marseille, Universit´e de la M´editerran´ee, Campus de Luminy, 13288 Marseille Cx 09, France
3BDSI, Universit´e de Perpignan, 52 avenue Paul Alduy, 66860 Perpignan, France
4Laboratoire d’Oc´eanographie de Villefranche, Observatoire Oc´eanologique, INSU/CNRS/UPMC, UMR 7093, BP 08, F 06230 Villefranche-sur-Mer, France
Received: 28 November 2007 – Published in Biogeosciences Discuss.: 18 December 2007 Revised: 6 May 2008 – Accepted: 27 May 2008 – Published: 30 June 2008
Abstract. The distribution of lipid biomarkers and their stable carbon isotope composition was investigated on sus-pended particles from different contrasting trophic environ-ments at six sites in the South East Pacific. High al-gal biomass with diatom-related lipids (24-methylcholesta-5,24(28)-dien-3β-ol, C25 HBI alkenes, C16:4 FA, C20:5 FA) was characteristic in the upwelling zone, whereas hapto-phyte lipids (long-chain (C37-C39)unsaturated ketones) were proportionally most abundant in the nutrient-poor settings of the centre of the South Pacific Gyre and on its easter edge. The dinoflagellate–sterol, 4α-23,24-trimethylcholest-22(E)-en-3β-ol, was a minor contributor in all of the studied area and the cyanobacteria-hydrocarbon, C17n-alkane, was at maximum in the high nutrient low chlorophyll regime of the subequatorial waters near the Marquesas archipelago.
The taxonomic and spatial variability of the relationships between carbon photosynthetic fractionation and environ-mental conditions for four specific algal taxa (diatoms, hap-tophytes, dinoflagellates and cyanobacteria) was also inves-tigated. The carbon isotope fractionation factor (εp)of the
24-methylcholesta-5,24(28)-dien-3β-ol diatom marker, var-ied over a range of 16‰ along the different trophic systems. In contrast, εpof dinoflagellate, cyanobacteria and alkenone
markers varied only by 7–10‰. The low fractionation fac-tors and small variations between the different phytoplank-ton markers measured in the upwelling area likely reveals uniformly high specific growth rates within the four
phyto-Correspondence to: I. Tolosa
(i.tolosa@iaea.org)
plankton taxa, and/or that transport of inorganic carbon into phytoplankton cells may not only occur by diffusion but also by other carbon concentrating mechanisms (CCM). In con-trast, in the oligotrophic zone, i.e. gyre and eastgyre, rela-tively high εp values, especially for the diatom marker,
in-dicate diffusive CO2 uptake by the eukaryotic phytoplank-ton. At these nutrient-poor sites, the lower εpvalues for
hap-tophytes, dinoflagellates and cyanobacteria indicate higher growth rates or major differences on the carbon uptake mech-anisms compared to diatoms.
1 Introduction
The sustainability of phytoplankton growth in the world ocean is basically controlled by three factors: nutrient abun-dance, light availability and the response of phytoplankton to these sources (Falkowski, 1984; Falkowski et al., 1998; Irwin et al., 2006; Litchman et al., 2006). The variability of these factors and their role in biogeochemical processes emerge from the properties of the surface mixed layer. Hence, eu-trophic areas, such as upwellings, with continuous nutrient supply to the euphotic zone differ strongly from areas with a permanently nutrient-depleted surface layer. In these areas, e.g. oceanic gyres, a deep pycnocline prevents surface waters from a supply with deeper, more nutrient-rich waters.
Photosynthesis is a major biogeochemical process where carbon dioxide and water are converted into organic carbon with the presence of light. The fate of this organic car-bon is therefore intimately linked to the conditions of its synthesis and depends strongly on the composition of the
phytoplankton assemblages. Studying these issues provides essential information for understanding the global marine carbon cycle. In addition to the now widely used chloro-phyll and pigment analysis (Barlow et al., 1993; Claustre et al., 2004; Mackey et al., 1996), field data about phytoplank-ton diversity might also be acquired by the distribution of accessory lipid biomarkers. They provide important infor-mation on the phytoplankton composition complementary to that of algal pigments, as well as on the relative importance of carbon sources from heterotrophic bacteria and other zoo-plankton (Dijkman and Kromkamp, 2006; Pinturier-Geiss et al., 2002; Tolosa et al., 2004).
Isotopic characterization of marine organic matter can pro-vide insight into the conditions under which carbon fixation occurs contributing to the understanding of the global ma-rine carbon cycle. The carbon isotopic composition (δ13C) of any photosynthetic product and its derived carbon iso-tope fractionation factor (εp)reflects the δ13C of the carbon
source utilized and the modification by the processes and environmental variables involved in its production: growth rate, temperature, dissolved CO2, cell geometry, irradiance, etc. (Burkhardt et al., 1999a, b; Eek et al., 1999; Hayes, 1993; Laws et al., 1997; Popp et al., 1998b; Rau et al., 1996). For example, high growth rates of the phytoplank-ton are linked to high δ13C values, i.e. they are enriched in 13C (Bidigare et al., 1999; Laws et al., 1995). However, they become depleted in13C with increasing concentration of dis-solved CO2(Burkhardt et al., 1999a; Riebesell et al., 2000). This latter linkage seems to be limited in its extent, and dif-ferences of δ13C higher than 1–2‰ cannot be explained any more by the change in the CO2concentration, but they are rather accounted for by differences in the growth rates of the phytoplankton and in the carbon uptake mechanisms (Bidi-gare et al., 1997; Burkhardt et al., 1999b, Benthien et al., 2007). Since particulate organic carbon (POC) is a com-plex mixture of autotrophs, heterotrophs, and detritus, poten-tially clearer relationships between δ13C values and environ-mental conditions can be obtained using specific biomarkers derived from particular species or taxonomic groups (Bidi-gare et al., 1999; Pancost et al., 1999; Pancost et al., 1997), compared to the δ13C of the bulk POC (Rau et al., 2001; Woodworth et al., 2004). This has become possible with compound-specific isotope-ratio mass spectrometry (Free-man et al., 1990; Hayes et al., 1990).
Our field study uses molecular and stable carbon isotopic ratios of specific lipid biomarkers to evaluate their organic sources and to explore variations in the biogeochemistry of the particulate organic matter in different hydrodynamic and trophic environments from the South East Pacific. These in-clude the eutrophic upwelling area off the Chilean coast, the mesotrophic and HNLC regions south of the equatorial cur-rent and the oligotrophic South Pacific Gyre, which was the major focus of this work. The major questions being ad-dressed are:
1. What is the spatial distribution of lipid biomarkers of phyto-, zooplankton and bacteria in the contrasting trophic environments of the South East Pacific? 2. What is the variability of the carbon isotope
fraction-ation (εp) of different phytoplankton taxa in relation
to different environmental conditions characterized by nutrient and dissolved inorganic carbon concentrations, and by productivity regimes? We discuss these results with respect to the processes of carbon uptake and as-similation within the different phytoplankton groups.
2 Materials and methods
2.1 Sampling
Sampling and hydrographic observations were carried on board R/V “L’Atalante” between October and December 2004 and were organized within the framework of the BIOSOPE (Biogeochemistry & Optics South Pacific Exper-iment) project which is part of the French JGOFS oceano-graphic programme PROOF. The main hydrodynamical and trophic features for the different zones are described in Claustre et al. (2008).
Samples were taken at six different sites, so called “long stations”, between Tahiti and the Chilean coast (Table 1). The different explored zones exhibited contrasting trophic environments. First, a mesotrophic area downstream of the Marquesas Islands (MAR) and a high nutrient low chloro-phyll zone (HNL) upstream of the Islands. Second, an ex-tremely oligotrophic area, very poor in nutrients, located in the centre of the South Pacific Gyre (GYR) and a less oligotrophic site in the east of the gyre (EGY). At the end of the transect, we studied a eutrophic zone highly enriched in nutrients and associated to the upwelling off the Chilean coast (UPW and UPX). UPW station was farther from the coast than UPX and exhibited a more important water strati-fication.
“Challenger Oceanics” in-situ pumps were used to filter large volumes (400 to 900 liters) of water in the upper 300 m of the water column, to collect suspended particles through a Nitex screen of 70 µm and a precombusted (550◦C) Mi-croquartz filter (QMF, Sartorius) of 1 µm pore size. Only the size fraction collected on the microquartz filter (1–70 µm) was analysed.
2.2 Bulk measurements
Table 2 summarizes the bulk biochemical parameters of the suspended particulate matter along the transect Marquesas Islands-Chilean coast.
Total CO2(CT) and total alkalinity (AT)of water
sam-ples were measured by potentiometry (Azouzi et al., 2007) at all sites except UPW. The dissolved CO2concentration was calculated from CT, alkalinity, temperature, salinity and the
Table 1. Sampling sites.
DATE Lat.(◦S) Long. (◦W) ACRONYM Brief description
28/10/2004 8.4 141.3 MAR Marquesas Islands characterized by high nutrients high chlorophyll 1/11/2004 9.0 136.8 HNL High nutrient low chlorophyll area east of the Marquesas Islands 12/11/2004 25.6. 114.0 GYR Center of the South Pacific Gyre
28/11/2004 31.8 91.4 EGY Eastern border of the Gyre
6/12/2004 34.0 73.3 UPW Upwelling area situated above the abyssal plain 10/12/2004 34.5 72.4 UPX Upwelling area situated above the continental shelf
Table 2. Selected environmental parameters from the six sites at the sampled depths.
locations-depth (m) T 0C density Kg m−3 AaT µmol Kg−1 CbT µmol Kg−1 [CO2](aq) µmol Kg−1 NO3 µmol l−1 PO4 µmol l−1 SiOH4 µmol l−1 POC µmol l−1 Chl a µg l−1 tcp hours PARd (%) mar3-50 m 27.7 22.9 2363 2024 11.3 1.59 0.28 1.03 1.96 0.41 12.4 2.7 mar3-100 m 26.9 23.2 2356 2052 13.1 3.81 0.39 1.73 0.90 0.21 0.55 mar3-300 m 11.3 26.6 2313 2225 34.7 8.83 0.61 2.66 0.28 0.05 hnl2-75 m 27.3 23.2 2353 2009 11.0 1.69 0.37 1.18 1.60 0.30 12.4 2.0 hnl1-100 m 26.8 24.5 2382 2097 14.3 1.04 0.50 1.88 0.90 0.26 0.64 hnl2-300 m 11.2 26.6 2319 2238 37.2 31.6 2.39 14.45 0.23 0.05 gyr2-0 m 22.0 24.6 2364 2048 11.9 0.00 0.12 0.88 0.39 0.03 13.3 100 gyr2-75 m 21.9 25.1 2369 2055 11.8 0.00 0.14 1.04 0.51 0.06 7.5 gyr2-125 m 20.7 25.2 2363 2051 11.7 0.00 0.12 0.96 0.49 0.13 2.5 gyr2-150 m 20.3 25.3 2358 2057 12.1 0.00 0.12 0.71 0.48 0.18 0.97 gyr2-175 m 19.6 25.4 2347 2074 13.3 0.10 0.14 0.71 0.49 0.20 0.32 gyr2-200 m 18.7 25.5 2333 2075 14.1 1.11 0.19 0.79 0.36 0.17 gyr2-300 m 13.9 26.0 2299 2099 17.2 8.06 0.81 1.93 0.12 0.04 egy4-70 m 16.5 25.4 2294 2033 12.9 0.53 0.21 1.34 0.95 0.19 13.9 3.6 egy2-200 m 14.5 25.8 2271 2071 16.6 2.96 0.41 1.50 0.25 0.04 egy4-300 m 10.0 26.4 2267 2119 21.8 15.4 1.07 3.99 0.23 0.03 upw1-40 m 12.8 25.9 13.0 0.91 8.00 6.92 2.50 14.3 0.15 upw1-100 m 10.8 26.4 28.1 2.6 20.8 1.83 0.07 upw2-300 m 8.7 26.8 39.0 2.8 33.0 1.03 0.08 upx3-40 m 12.0 26.0 2274 2197 37.4 22.8 2.02 10.7 3.28 0.79 14.4 0.52 upx2-100 m 10.5 26.4 2294 2258 52.4 23.2 2.32 24.4 1.25 0.11 upx2-300 m 10.0 26.7 2307 2281 56.0 35.3 3.5 27.9 0.56 0.07
aTotal alkalinity;bTotal CO
2;cday length;dnormalised underwater irradiance concentrations of silicate and phosphate using the CO2SYS
program developed for CO2 system (Lewis and Wallace, 1998). This program is based on equations of the seawa-ter CO2system (DOE, 1994) and the dissociation constants of Goyet and Poisson (1989).
Nutrient concentrations (nitrate, phosphate and silicate) were determined onboard using an autoanalyzer (Raimbault et al., 2008). Analysis of organic carbon was done with a “Vario EL” elemental analyser (© elementar Analysensys-teme GmbH) after acidification of the filter subsamples
fol-lowing the procedure described in Miquel et al. (1994). The photosynthetically active radiation (PAR) in water was mea-sured using a calibrated hyperspectral profiling radiometer (HyperPro, Satlantic, Inc).
2.3 Lipid extraction
Filters containing the suspended particles were spiked with internal standards (n-C24D50, anthracene-d10, pyrene-d10, perylene-d12, friedeline, 5α-androstan-3β-ol and cholanic
acid), and extracted by microwave oven with 40 ml of a mix-ture with CH2Cl2/MeOH (3:1) at 70◦C for 15 min. Isola-tion of the neutral and acid lipid fracIsola-tions were done follow-ing the method of Tolosa and de Mora (2004). Extractable lipids were saponified using 1 ml KOH 6% in methanol/water (80:20) plus 1 ml of Milli-Q water (80◦C, 1 h). Then the neutral fraction was recovered with n-hexane and subject to fractionation by HPLC on a normal phase column (Nucle-osil column, 20 cm×0.4 cm i.d. 5 µm) to isolate the aliphatic hydrocarbons (F1), polycyclic aromatic hydrocarbons (F2), ketone compounds (F3) and sterol and alcohol fraction (F4). Saponified solutions were acidified with 1 ml HCl 6 N to pH 2 and the fatty acids obtained by hydrolysis of wax es-ters, triacylglycerols, steryl esters and phospholipids were extracted with hexane:ethyl acetate 9:1.
2.4 Gas chromatography
The sterol fraction was treated with bis-(trimethylsilyl)-trifluoroacetamide (BSTFA) (200 µl, 70◦C, 1 h) to convert the alcohols and sterols to their corresponding trimethylsilyl ethers. The acid fraction was derivatised by transesterifying the lipid extract with 500 µl of 20% BF3in methanol at 80◦C for 1 h.
Gas chromatography (GC) was performed with a Hewlett Packard HP5890 series II equipped with a flame ionization detector and split/splitless injector. Two fused silica capillary columns were employed: (A) a DB-5 fused silica capillary column (30 m×0.25 mm i.d.; film thickness 0.25 µm) for neutral compounds and fatty acids and (B) a BPX-70 (SGE, 60 m×0.32 mm×0.5 µm) for the fatty acids. Helium was the carrier gas (1.2 ml min−1). The oven temperature for the DB-5 was programmed from 60◦C (0.5 min hold) to 290◦C at 6◦C min−1. The GC oven for the BPX-70 column was pro-grammed from 60◦C (0.5 min hold) to 250◦C at 6◦C min−1. Injector and detector temperatures were 270◦C and 320◦C, respectively.
Aliphatic hydrocarbons, ketones, sterols and fatty acids were quantified by internal standards (C24D50,friedeline, 5α-androstan-3β-ol, and cholanic acid, respectively). Confirma-tion of peak identity was obtained using GC with mass spec-trometric detection (GC-MS) (Hewlett-Packard 5889B MS “Engine”) operated in the electron impact at 70 eV.
2.5 Compound-specific isotope analysis
The lipid biomarkers were analyzed for their stable carbon isotope composition using an HP 5890 GC equipped with a HP 7673 autoinjector and interfaced through a combustion furnace with a FINNIGAN MAT Delta C isotope ratio mass spectrometer (GC/C/IRMS).
The GC/C/IRMS was equipped with a 100% methylpolysiloxane fused silica column (Ultra-1, 50 m×0.32 mm i.d.; 0.5 µm film thickness) pre-connected with a press-fit connector (Supelco, France) to a 0.32 mm
i.d. deactivated fused silica capillary retention gap of 5 m. Injections of 2 µl in isooctane were made via an on-column injector. The GC oven was programmed from 60 to 100◦C
at 10◦C min−1, then to 310◦C at 4◦C min−1and maintained at 310◦C for 40 min. Values reported were determined by at least in triplicate to calculate the average and standard deviation. All δ13C values are reported in the delta notation relative to the Pee Dee Belemnite (PDB) standard as follows: δ13C = [(13C/12C)sample/(13C/12C)PDB−1] × 103 (1) Corrections for the isotopic change introduced in the derivatisation of sterols, fatty alcohols, and fatty acids were determined through derivatisation of standards of known iso-topic composition and applying the equation of Jones et al. (1991). Cholesterol, methanol, 18:0 fatty acid and 18:0 FAME of known isotopic carbon composition (measured by elemental analyser coupled to isotope ratio mass spectrome-ter), were used to calibrate the GC/C/IRMS and correct the isotopic change introduced by the derivatisation. The sur-rogate standards, 5α-androstan-3β-ol, cholanic acid and the GC internal standard friedelin of known isotopic composi-tion served as internal isotopic standards.
The precision (standard deviation) for most analytes with GC-C-IRMS signals higher than 0.5 V (m/z 44) was comparable to the instrument specifications (0.5‰). As it is illustrated in Appendix A, the major compound 24-methylcholesta-5,24(28)-dien-3β-ol (C2815,24(28)) stenol was integrated together with their minor stanol pair com-pound (24-methyl-5α-cholest-24(28)-en-3β-ol) to yield a single δ13C value for both compounds, because of incom-plete chromatographic separation.
2.6 Calculations of carbon isotope fractionation (εp) and
sensitivity study
Molecular εpwas determined following the general Eq (2)
outlined in Freeman and Hayes (1992):
εp = [(δ13CO2+1000)/(δ13Cpp+1000) − 1] × 103 (2) where CO2is its dissolved phase in the water column and Cppthe primary photosynthate.
In this study, direct measurement of δ13CO2 was not available. Therefore δ13CO2was calculated according to the Eq. (3) of Mook (1974):
εb=[(δ13CO2+1000)/(δ13b+1000)−1]×103=24.12−9866/T (3)
where εbis the temperature-dependent carbon isotope
frac-tionation of dissolved CO2with respect to bicarbonate, T is the absolute temperature in Kelvin, and the reference value of δ13 for bicarbonate (b) in sea surface water was taken as +1.5‰ (Quay et al., 2003). We adopt this constant value of δ13bicarbonate for all sites and depths based on (a) the low variability of δ13DIC reported for the surface waters of the global ocean, including Pacific (1.55‰), Atlantic (1.56‰)
an Indian Ocean (1.37‰) (Quay et al., 2003), (b) the major contribution of bicarbonate in the total DIC pool (90% of the total) and c) the low variability of δ13DIC in the upper wa-ter column (Kroopnick, 1985). Although meridional δ13DIC variability is generally greater than zonal variability, surface δ13DIC in the Pacific ocean varied only by 0.3‰ over the lat-itudes of the studied area. However, field data of δ13C DIC in the Peru upwelling region ranged from –0.65 to 0.81‰ (Pan-cost et al., 1997, Bidigare et al., 1997) whereas in the other areas of the Pacific, it ranged from 1.20 to 1.85‰ (Bidigare et al., 1997). Based on the upper and lower bound values of δ13DIC, εp might have a maximum range variation of 2‰
whereas a typical variation of ±0.5‰ results in a variation of ±0.7‰ for εp. Therefore, δ13DIC do not seem to have
major influence on the changing isotopic compositions of or-ganic matter in the upper water column of the ocean, and the likely lower δ13DIC values for the upwelling site would only accentuate the differences between the trophic environments, providing lower εpvalues for the upwelling sites.
δ13Cpp(primary photosynthate) for eukaryotic organisms was calculated by using a constant isotopic fractionation of 4.2‰ between photosynthetic lipids and algal biomass. This value has been provided by Popp et al. (1998a) for alkenones and has been used by other authors (Bidigare et al., 1997; Benthien et al., 2002; Harada et al., 2003; Benthien et al., 2005; Popp et al., 2006a). Similarly, we adopted this value for the isoprenoid compounds, e.g. phytol and sterols, used in previous papers (Pancost et al., 1997; Pancost et al., 1999; Bidigare et al., 1999), thus allowing a comparison of εp
cal-culated in the present study. However, the offset in δ13C val-ues for common lipids relative to the δ13C value of biomass might vary considerably between microalgal species, biosyn-thetic pathways, the site of reactions in the cell (Schouten et al., 1998; Hayes 2001), and by variations in the relative amounts of the major biochemicals in the cell (i.e., proteins, carbohydrates, and lipids) which in addition have different δ13C values. Thus, lower isotopic offsets between lipids and total biomass are expected to occur in nutrient limited en-vironments where higher cellular lipid contents relative to proteins and carbohydrates are found (Livne and Sukenik, 1992). This variability might accentuate the range of εp
between the trophic environments, with higher εp values in
low-nutrient waters compared to high-nutrient environments. Potential variations of ±1‰ in the isotopic shift between the algal biomass and lipids might result in εp variations of
±1‰.
Culture studies of haptophytes have identified an isotopic shift ranging from 3.1 to 5.3‰ between primary photosyn-thate and alkenone biomarkers (Laws et al., 2001; Riebe-sell et al., 2000; Jasper and Hayes, 1990; and Popp et al., 1998). In contrast to alkenones, the isotopic offset between algal biomass and other eukaryotic lipid biomarkers is less constrained with reported offsets ranging from –2 to 8 ‰ for different cultures of phytoplankton taxa (Schoulten et al., 1998; Hayes, 2001). If we consider the upper and lower
bound values of offsets found for phytol (–0.8 to 4.2‰) and diatom sterols (0.6 to 6.4‰) in marine diatom cultures, the extreme values of εpfor phytol and diatom sterols differ by
5 and 6‰ respectively. One reported culture of dinoflag-ellate exhibited an isotopic fractionation between dinosterol and algal biomass of 4.5‰ (Schouten et al., 1998).
For prokaryote, δ13Cpp was estimated from the n-heptadecane assuming a constant isotopic fractionation be-tween photosynthetic lipids and algal biomass of 8.4‰ re-ported by Sakata et al. (1997).
2.7 Estimations of growth rates and intracellular carbon de-mand in haptophytes assuming purely CO2 diffusion uptake
Carbon isotopic fractionation for phytoplankton (εp)which
obtain CO2 by passive diffusion is summarized by the ex-pression of Popp et al. (1998b):
εp=εf −β
µ(V /S) [CO2]
(4) where εf is the fractionation associated with the
enzyme-catalyzed carbon fixation step, β is a constant, µ is the spe-cific growth rate, V and S are the volume and surface area of the alga cells and [CO2] is the concentration of dissolved CO2external to the algal cell. Since β and (V/S) are prac-tically constant for haptophyte taxa, we can transform this constant to the variable b-value (‰ µmol), which serves as a proxy for growth rate and reflects the intracellular carbon demand. This b-value was calculated following the Eq. (5) of Bidigare et al. (1997):
b = (εf −εp) × [CO2]aq (5)
with εf values of 25‰ for eukaryotic algae utilizing
Ru-bisco and β-carboxylase enzymes (Bidigare et al., 1997) and [CO2]aqcalculated as described in Sect. 2.2.
Specific growth rates (µ, (d−1)) of alkenone produc-ing haptophytes were estimated with the followproduc-ing equation found by Bidigare et al. (1997) in laboratory chemostat cul-ture experiments of Emiliania huxleyi:
µcc =(25 − εp)[CO2]/138 (6) and applying the corrections for the effects of day length and respiration on growth rate
µ = [µcc/(24/tp)]0.8 (7)
where µ is the 24-h average growth rate, tpis day length or
photoperiod in hours, and the factor 0.8 adjusts the growth rate for dark respiration.
3 Results and discussion
The analytical scheme used in this study identified and quan-tified ∼60 individual compounds in the neutral lipid frac-tion and ∼40 compounds in the acid fracfrac-tion. A summary
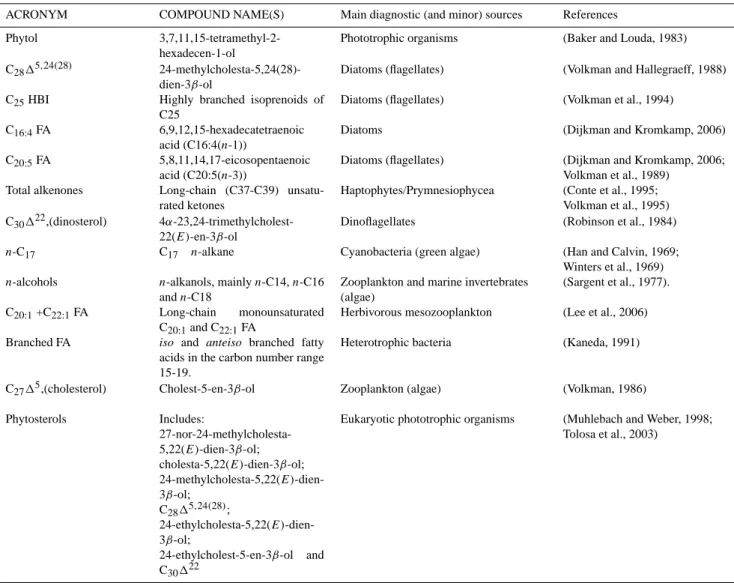
Table 3. Summary of the lipid biomarkers discussed in this study.
ACRONYM COMPOUND NAME(S) Main diagnostic (and minor) sources References Phytol
3,7,11,15-tetramethyl-2-hexadecen-1-ol
Phototrophic organisms (Baker and Louda, 1983)
C2815,24(28) 24-methylcholesta-5,24(28)-dien-3β-ol
Diatoms (flagellates) (Volkman and Hallegraeff, 1988)
C25HBI Highly branched isoprenoids of C25
Diatoms (flagellates) (Volkman et al., 1994)
C16:4FA 6,9,12,15-hexadecatetraenoic acid (C16:4(n-1))
Diatoms (Dijkman and Kromkamp, 2006)
C20:5FA 5,8,11,14,17-eicosopentaenoic acid (C20:5(n-3))
Diatoms (flagellates) (Dijkman and Kromkamp, 2006; Volkman et al., 1989)
Total alkenones Long-chain (C37-C39) unsatu-rated ketones
Haptophytes/Prymnesiophycea (Conte et al., 1995; Volkman et al., 1995) C30122,(dinosterol)
4α-23,24-trimethylcholest-22(E)-en-3β-ol
Dinoflagellates (Robinson et al., 1984)
n-C17 C17 n-alkane Cyanobacteria (green algae) (Han and Calvin, 1969; Winters et al., 1969)
n-alcohols n-alkanols, mainly n-C14, n-C16 and n-C18
Zooplankton and marine invertebrates (algae)
(Sargent et al., 1977).
C20:1+C22:1FA Long-chain monounsaturated C20:1and C22:1FA
Herbivorous mesozooplankton (Lee et al., 2006)
Branched FA iso and anteiso branched fatty
acids in the carbon number range 15-19.
Heterotrophic bacteria (Kaneda, 1991)
C2715,(cholesterol) Cholest-5-en-3β-ol Zooplankton (algae) (Volkman, 1986) Phytosterols Includes: 27-nor-24-methylcholesta-5,22(E)-dien-3β-ol; cholesta-5,22(E)-dien-3β-ol; 24-methylcholesta-5,22(E)-dien-3β-ol; C2815,24(28); 24-ethylcholesta-5,22(E)-dien-3β-ol; 24-ethylcholest-5-en-3β-ol and C30122
Eukaryotic phototrophic organisms (Muhlebach and Weber, 1998; Tolosa et al., 2003)
of selected lipid biomarkers discussed in this study together with their main sources is shown in Table 3. In particular, we focus on the long-chain unsaturated methylketone (C37:2 alkenone) which is a marker for certain haptophyte algae (Conte et al., 1995, Volkman et al., 1995), the C2815.24(28) sterol and HBI which are major components in many diatom (Volkman and Hallegraeff, 1988, Volkman et al., 1994), the dinosterol mainly derived from dinoflagellates (Robinson et al., 1994) and the n-C17 alkane derived from cyanobacte-ria and green algae (Han and Calvin, 1969, Winters et al., 1969). We note, however, that HBIs are not markers for all diatom species since they are mainly synthesized by centric (Rhizosolenia species) and pennate diatoms (Haslea,
Navic-ula and Pleurosigma), whereas C2815,24(28)sterol has also been found in some dinoflagellates and green algae (Volk-man, 1986). Therefore, there might be an offset between the
diatom sterols and the HBIs depending on the diatom species composition. In a similar way, all diatoms do not produce the C2815.24(28) sterol, and dinosterol can also be present in certain diatoms (Volkman et al., 1986). Considering that the particle size fraction studied was 1–70 µm, a certain dis-crimination of bacterial, diatom and zooplankton biomark-ers compared to coccolithophorid and dinoflagellate markbiomark-ers might have occurred. Concentrations of the selected lipid biomarkers are summarized in Table 4 and their concentra-tions normalized to the POC are shown in Appendix B1. The individual carbon isotope ratio for some of the selected lipid biomarkers are shown in Appendix C1. The complete data set of concentrations and δ13C values is available on the BIOSOPE Database: http://www.obs-vlfr.fr/proof/vt/op/ ec/biosope/bio.htm
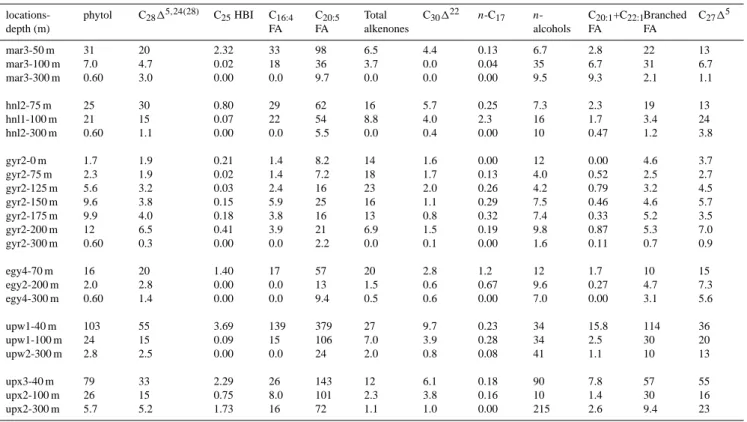
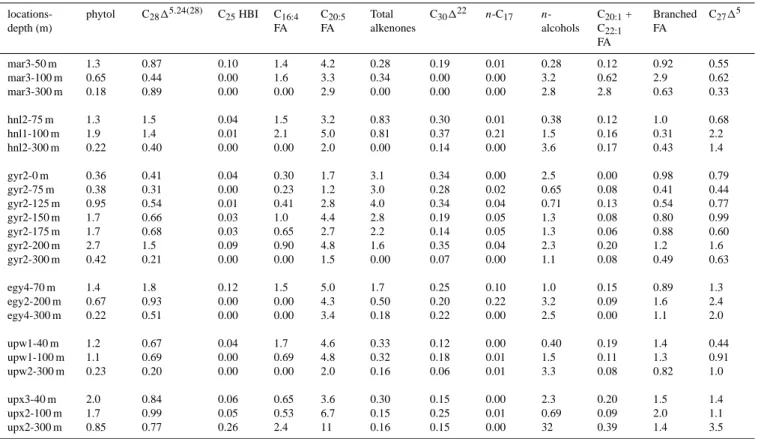
Table 4. Selected lipid biomarkers concentrations (ng l−1)in suspended particles from the South Pacific Ocean. locations-depth (m) phytol C2815,24(28) C25HBI C16:4 FA C20:5 FA Total alkenones C30122 n-C17 n -alcohols C20:1+C22:1 FA Branched FA C2715 mar3-50 m 31 20 2.32 33 98 6.5 4.4 0.13 6.7 2.8 22 13 mar3-100 m 7.0 4.7 0.02 18 36 3.7 0.0 0.04 35 6.7 31 6.7 mar3-300 m 0.60 3.0 0.00 0.0 9.7 0.0 0.0 0.00 9.5 9.3 2.1 1.1 hnl2-75 m 25 30 0.80 29 62 16 5.7 0.25 7.3 2.3 19 13 hnl1-100 m 21 15 0.07 22 54 8.8 4.0 2.3 16 1.7 3.4 24 hnl2-300 m 0.60 1.1 0.00 0.0 5.5 0.0 0.4 0.00 10 0.47 1.2 3.8 gyr2-0 m 1.7 1.9 0.21 1.4 8.2 14 1.6 0.00 12 0.00 4.6 3.7 gyr2-75 m 2.3 1.9 0.02 1.4 7.2 18 1.7 0.13 4.0 0.52 2.5 2.7 gyr2-125 m 5.6 3.2 0.03 2.4 16 23 2.0 0.26 4.2 0.79 3.2 4.5 gyr2-150 m 9.6 3.8 0.15 5.9 25 16 1.1 0.29 7.5 0.46 4.6 5.7 gyr2-175 m 9.9 4.0 0.18 3.8 16 13 0.8 0.32 7.4 0.33 5.2 3.5 gyr2-200 m 12 6.5 0.41 3.9 21 6.9 1.5 0.19 9.8 0.87 5.3 7.0 gyr2-300 m 0.60 0.3 0.00 0.0 2.2 0.0 0.1 0.00 1.6 0.11 0.7 0.9 egy4-70 m 16 20 1.40 17 57 20 2.8 1.2 12 1.7 10 15 egy2-200 m 2.0 2.8 0.00 0.0 13 1.5 0.6 0.67 9.6 0.27 4.7 7.3 egy4-300 m 0.60 1.4 0.00 0.0 9.4 0.5 0.6 0.00 7.0 0.00 3.1 5.6 upw1-40 m 103 55 3.69 139 379 27 9.7 0.23 34 15.8 114 36 upw1-100 m 24 15 0.09 15 106 7.0 3.9 0.28 34 2.5 30 20 upw2-300 m 2.8 2.5 0.00 0.0 24 2.0 0.8 0.08 41 1.1 10 13 upx3-40 m 79 33 2.29 26 143 12 6.1 0.18 90 7.8 57 55 upx2-100 m 26 15 0.75 8.0 101 2.3 3.8 0.16 10 1.4 30 16 upx2-300 m 5.7 5.2 1.73 16 72 1.1 1.0 0.00 215 2.6 9.4 23
3.1 Distribution of phytoplankton, zooplankton and bacte-rial markers in different trophic environments
Concentrations of phytol, a non-specific marker for pho-totrophic organisms, if compared at the depth of chlorophyll and POC maxima, were highest at the upwelling sites with 102 ng l−1at UPW and 78 ng l−1at UPX. The mesotrophic sites, MAR and HNL, exhibited intermediate phytol concen-trations of 25 to 31 ng l−1. The lowest values were measured at the oligotrophic sites, EGY (16 ng l−1)and in particular at GYR (11 ng l−1), where maximum values of chlorophyll and POC were at 175 m depth. Concentrations of diatom biomarkers, e.g. (C2815.24(28)sterol, C25HBI alkenes, C16:4 FA, C20:5FA), haptophytes biomarkers (total alkenones) and dinoflagellates markers (dinosterol) exhibited a similar distri-bution as phytol concentrations (Table 4), except in the Gyre where alkenones and dinosterol peaked at shallower depths than phytol and diatom markers.
Highest concentrations of long-chain C37 and C38 alkenones were measured at the eutrophic UPW site (27 ng l−1)but also at the two gyre sites EGY (20 ng l−1) and GYR (23 ng l−1). These peak values corresponded to the depth of chlorophyll and POC maxima except for the GYR site where the peak was situated at 125 m depth, above the chlorophyll maximum but within maximum POC con-centrations. A much lower concentration (6.5 ng l−1)was
recorded at the MAR site. These values are much lower than those reported for suspended particles from the Bering Sea after blooms of Emiliania huxleyi and ranging from 0.15 to 3.12 µg l−1(Harada et al., 2003), but similar to concentra-tions observed in suspended particles collected under non-bloom conditions in the surface waters of the North Atlantic and Nordic Sea (Sicre et al., 2002), in the western Sargasso Sea (100 ng l−1)(Conte et al., 2001) and in the oligotrophic North Pacific subtropical gyre (0.5–15 ng l−1)(Prahl et al., 2005).
The C17 n-alkane, which is produced by aerobic photo-synthetic bacteria and green algae (Han and Calvin, 1969; Winters et al., 1969) exhibited a maximum concentration of 2.3 ng l−1, below the chlorophyll and POC maxima at the HNL site and of 1.2 ng l−1 at the same depth (70 m) as chlorophyll and POC maxima at the EGY site. The other sites showed concentration levels below 0.5 ng l−1 (Ta-ble 4). These concentrations were consistent with the abun-dance distribution of prokaryotic phototrophic organisms, with high abundances at the HNL and EGY sites (Grob et al., 2007).
In all samples, the n-alkanols were dominated by the short-chain fatty alcohols of even carbon number (n-C14, n-C16 and n-C18), which are associated to zooplankton markers (Sargent et al., 1977). With the exception of the two gyre sites (GYR and EGY), maximum concentrations of linear
0 10 20 30 40 100 300 60 100 300 75 175 300 70 200 300 40 100 300 40 100 300 0 5 10 15 20 0 10 20 30 40 0 2 4 6 8 10 12 a % phytol b % C28∆5,24(28) c % alkenones D e p th ( m ) MAR HNL GYR EGY UPW UPX 50 100 300 75 100 300 75 175 300 300 200 70 300 300 100 40 100 40 d C28∆5,24(28)/ alkenones ratio 0 20 0 15 0 30 0 10
Fig. 1Fig. 1. Percentage contribution of selected lipid biomarkers and
bio-chemical indices: (a) percentage of phytol relative to total neutral lipid concentrations, (b) percentage of 24methylcholesta5,24(28)-dien3βol relative to total neutral lipids concentrations; (c) percent-age of total alkenones relative to total neutral lipid concentrations; (d) Ratio of 24methylcholesta5,24(28)dien3βol to total alkenones to evaluate the relative contribution of diatoms vs. haptophytes.
alcohols were found below the depth of chlorophyll and POC maxima, at the upwelling sites (UPW, UPX) at 300 m and at the Marquesas sites (MAR, HNL) at 100 m depth. In the Gyre, maximum concentrations of n-alcohols coincided with the phytol maximum, though another peak (11.6 ng l−1)was registered at the surface of the GYR site. The fatty acids C20:1 and C22:1, typical markers of herbivorous mesozoo-plankton (Graeve et al., 1994, Dalsgaard et al., 2003, Lee et al., 2006), exhibited the highest concentrations at the up-welling sites (UPW, UPX) at the depth of chlorophyll and POC maxima, but also below the euphotic zone (300 m) at the MAR and UPX sites.
Similar to the phytol distribution, the concentrations of bacterial biomarkers, such as branched fatty acids, were highest at the UPW site (Table 4), whereas the concentra-tions of zooplankton markers, such as cholesterol and n-alcohols exhibited higher abundance at UPX. In general, heterotrophic bacterial populations seemed to be associated to diatom biomass, which is supported by the positive corre-lation between the δ13C of the branched fatty acid (i-C15FA) and the δ13C of the C20:5FA (r=0.81, p<0.05).
Some more insight into the phytoplankton distribution may be gained by comparing the relative contribution of the biomarkers within the total neutral lipids, or normaliz-ing their concentrations to the POC content (Appendix B1). Since both approaches provided similar trends, we used the first approach for our discussion illustrated in Fig. 1. The per-centage of phototrophic biomarkers generally followed the chlorophyll and POC distribution except at UPX, where phy-tol and diatom markers peaked at 100 m depth. Also at HNL, phytol showed relatively high percentages i.e. was enriched
0 0.5 1 40 100 300 60 100 300 75 175 300 70 200 300 40 100 300 40 100 300 0 % Branched FA2 4 6 0 10 20 0 10 20 % C16 PUFA a b c d D e p th ( m ) MAR HNL GYR EGY UPW UPX Phytosterols / Phytol ratio Cholesterol / Phytosterols ratio 100 100 100 100 50 300 300 300 300 300 300 75 75 175 70 200 40 40 0 0.5 0 4 0 20 0 20 Fig. 2
Fig. 2. Values of selected biochemical indices to elucidate the dom-inant sources in the suspended particles from the different sites. (a) Cholesterol/phytosterolsaratio to evaluate the relative contribution of zooplankton vs. algal. (b) % Bacterial fatty acid indicator is the sum of all iso and anteiso- branched chain fatty acids expressed as percent of total fatty acids. (c) Phytosterols/phytol ratio to eluci-date the degradation state of the phytoplankton material. (d) % C16
PUFA is the polyunsaturation index of C16 fatty acids to evaluate the ecophysiological state of the marine diatoms.
aPhytosterols are listed in Table 3.
in the POC, down to 100 m depth. This may be related to the highest relative importance of diatom sterol observed in the euphotic layer (Fig. 1b) and to the presence of diatoms which formed “balls of needles” or clusters (G´omez et al., 2007). In contrast to the diatom biomarkers, the percent-age of total alkenones was by far highest in the gyre espe-cially above the chlorophyll maximum (Fig. 1c), where also the concentrations were among the highest of all sites (Ta-ble 4). Prymnesiophytes were likely to be the major con-stituents of eukaryotic phytoplankton in the gyre, suggest-ing that haptophytes are well adapted to the low nitrate con-centrations prevailing in the oligotrophic zone of the Pacific Gyre. Although the lipid content and composition of mi-croalgae can be affected by changes in environmental con-ditions such as nutrient status, light intensity and tempera-ture (Shifrin and Chrisholm, 1981; Reitan et al., 1994), the C2815.24(28) sterol/alkenones ratio may provide us with an overview on the relative contribution of C2815.24(28) sterol-producing diatoms to alkenone-sterol-producing prymnesiophytes. Highest ratios were obtained at the UPX site, and in par-ticular below the euphotic zone. Alkenone-producing hap-tophytes predominated over diatoms at the GYR site, espe-cially above the chlorophyll maximum whereas the diatom signal showed a deeper maximum at 175 m corresponding to the maximum of both phytol and chlorophyll-a. Dinos-terol showed overall low percentages (<3%) or concentra-tions normalized to POC (<0.37 mg g−1C), which indicated a minor contribution of dinoflagellates in the algal mixture of these Pacific waters. The highest dinosterol values were recorded in the HNL as it was also confirmed by pigment
analyses (Ras et al., 2008).
Figure 2 illustrates other diagnostic biomarkers indices to evaluate the relative dominance of zooplankton and bacterial sources within each site as well as the state of the particu-late material in the different zones. Although cholesterol is also present in many classes of algae, it is considered a typ-ical marker for zooplankton derived organic matter supply because its concentration becomes enriched after passing the organisms in relation to the algal diet (Harvey et al., 1987). Therefore, the relative abundance of cholesterol over phy-tosterols has been used as a relative indicator of zooplank-ton over phytoplankzooplank-ton abundance (Muhleback and Weber, 1998; Tolosa et al., 2003). Here, the cholesterol/phytosterol ratio increased with depth at all sites, and in particular at UPX. This was consistent with the substantial concentrations of n-alcohols and zooplanktonic C20:1and C22:1fatty acids found at 300 m depth. At most of the sites, the relative im-portance of bacterial fatty acids was higher below than at the depth of chlorophyll maximum. A contrasting image was observed at UPX where this relative importance was lower. In fact, high bacterial production and a negative net com-munity production were reported from the euphotic zone of UPX (Van Wambeke et al., 2008), which suggests rather “de-composing” conditions compared to “productive” conditions at UPW. At all sites, the ratio of phytosterols/phytol indi-cated more degraded phytoplankton material at depths below the chlorophyll maximum, but at the gyre site, this was also the case above the maximum. The ratio showed a slightly more degraded material in the euphotic zone of the UPX site as compared to UPW but, at 300 m depth, fresher material was found at UPX.
The polyunsaturation index of C16 fatty acids (PUFA % of C16)is an indicator of the ecophysiological state of ma-rine diatom populations because storage lipids, mainly C16:0 and C16:1FA, are synthesized during senescence, rather than during logarithmic growth (Shin et al., 2000). The high in-dices observed in the euphotic zone of the UPW site and at 300 m depth of UPX suggest that these PUFA originated from diatoms at logarithmic growth. Moreover, the car-bon isotope ratios of lipid biomarkers in the euphotic zone were generally more enriched at UPW compared to UPX (Fig. 3), likely indicating higher growth rates at UPW than at UPX. However, below the euphotic zone of UPX, δ13C values identified higher growth rates at depth compared to the surface. All these parameter point out that post-bloom conditions with high concentrations of animal-derived detri-tus prevailed at the surface of the UPX site, whereas the im-portant signal of zooplankton and diatom markers below the euphotic layer indicated the presence of zooplankton feeding on phytoplankton produced during bloom conditions. These findings are supported by the highest particle flux measured at UPX compared to the UPW site (Miquel et al., 2006) and the high concentration of detritus and senescent colo-nial diatoms observed by microscope in samples from the euphotic zone at the UPX site (G´omez, personal
commu--34.00 -32.00 -30.00 -28.00 -26.00 -24.00 -22.00 -20.00 upx-300m upx-40m upw-40m phytol C28∆∆∆∆5,24(28) C C30∆∆∆∆22 37:2 δ 1 3C ( ‰ ) C17 Fig. 3
Fig. 3. Carbon isotope ratios (δ13C) for selected lipid biomarkers in the upwelling zone.
nication). These conclusions contrast, however, with those derived from pigment biomarkers (Ras et al., 2008) where UPW site was characteristic of a typically mature bloom of diatoms and the phytoplankton at site UPX was probably at an early stage of development. Also, much higher nutrient concentrations at the surface of UPX site indicated a recent upwelling of deep water. Overall, these contrasted observa-tions might be accounted for by the different turnover and lability between pigment and lipid compounds which repre-sent different pools of the particulate matter. Pigments are relatively more labile and associated with the living material. In contrast, lipids are included in both the living and detrital particulate pools of the matter.
3.2 Vertical distribution of biomarkers in the center of the gyre
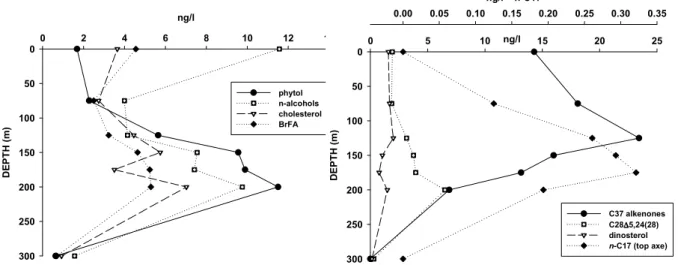
Depth profiles of selected accessory lipid biomarkers in sus-pended matter from the center of the Gyre are presented in Fig. 4. Phytol concentrations showed very low surface values and they were increasing progressively with depth, with maximum concentration at 150–200 m depth. Rel-atively high concentrations of n-alcohols, cholesterol and branched fatty acids at the surface indicated an important heterotrophic activity in the upper waters. At higher depths (>75 m), both alcohols and cholesterol showed similar pro-files as phytol, likely indicating that here, these biomark-ers were mainly phytoplanktonic-derived or that zooplank-ton biomass was strongly associated with the phytoplank-ton abundance. Branched fatty acids which are derived from heterotrophic bacteria exhibited the maximum concentration between 150 and 200 m depth, following the same trend as planktonic biomass. This feature indicates that the bacterial population is associated with the major planktonic biomass.
Other more specific phototrophic biomarkers, such as sterol markers for diatoms exhibited a similar profile as phy-tol with two maximum at 150 and 200 m depth. Only few macro diatom species, such as Nitzschia and Dactyliosolen
ng/l 0 2 4 6 8 10 12 14 D E P T H ( m ) 0 50 100 150 200 250 300 phytol n-alcohols cholesterol BrFA ng/l 0 5 10 15 20 25 D E P T H ( m ) 0 50 100 150 200 250 300 ng/l n-C17 0.00 0.05 0.10 0.15 0.20 0.25 0.30 0.35 C37 alkenones C28∆∆∆∆5,24(28) dinosterol n-C17 (top axe)
Fig. 4
Fig. 4. Depth distribution of selected lipid biomarkers in the suspended particles from the gyre.
19'HF (m g m-3) 0.00 0.01 0.02 0.03 0.04 0.05 D E P T H ( m ) 0 50 100 150 200 250 300 C37 alk (ng/l) 0 2 4 6 8 10 12 19' HF C37 alk Fig.5
Fig. 5. Profiles for total C37 alkenones concentrations (C37 alk)
and 19hexanoyloxyfucoxanthin pigment (19’HF) with depth in the suspended particles from the gyre.
were observed between 200 and 300 m depth and a signifi-cant number of Bacteriastrum associated to a cyanobacteria symbiont was also observed around 140 m depth (G´omez, personal communication). In contrast, the sterol marker for dinoflagellates exhibited a uniform distribution from surface to 125 m depth and a deeper maximum concentration at 200 m depth. Small dinoflagellates were observed in the sur-face waters of the Gyre center (G´omez, personal communica-tion). The n-alkane C17, which is produced by cyanobacteria and other eukaryotic algae, increased with depth showing a maximum concentration between 125 and 175 m. This co-incides with the maximum abundances of Prochlorococcus and picoeukaryotes recorded between 100 and 200 m depth (Grob et al., 2007).
The C37 alkenones, which are specific markers for some algae of the class Haptophyceae/Prymnesiophyceae, includ-ing coccolithophorid species such as Emiliania huxleyi, ex-hibited the maximum concentration above the deep chloro-phyll maximum, at 125 m depth. Cell densities of different coccolithophorid taxa showed, however, different depth pro-files, with a maximum peak between 150–200 m for
Emil-iania huxleyi whereas other taxa peaked at shallower depths
(∼100 m) (Beaufort et al., 2007). These findings indicate that (i) other non-calcifying haptophytes might synthetize alkenones at shallower depths, (ii) that alkenones are not as-sociated with the integrity of coccospheres and/or (iii) that cellular alkenone concentrations varied with the physiolog-ical status and species composition of the coccolithophorid assemblage. Furthermore, the concentration of alkenones and the accessory carotenoid 19’Hexanoyloxyfucoxanthin (19’HF) (Ras et al., 2008), characteristics of prymnesio-phytes, also exhibited different depth distributions (Fig. 5). Such discrepancy reflects that alkenone-producers in these waters are minor contributors to the 19’HF stock, and that the habitat of alkenone synthesizers diverges from that of the major phytoplankton taxa contributing to the 19’HF dis-tribution. An analogous feature was observed at station ALOHA from the oligotrophic North Pacific Subtropical Gyre (Prahl et al., 2005) and other studies showed that 19’HF abundance was generally not tightly correlated with that of coccolithophorids (Dandonneau et al., 2006). Figure 6 il-lustrates the carbon isotope composition of the diunsatu-rated alkenone together with the total concentrations of C37 alkenones. More enriched δ13C values were obtained for alkenones measured at the depth of the chlorophyll maxi-mum, whereas the higher concentrations of alkenones found at 125 m depth were associated to lower δ13C values. Change in irradiance could also partially explain the abrupt change of the carbon isotope composition of the alkenones, since lower photon flux density leads to a lower13C discrimination
δδδδ13131313C -31 -30 -29 -28 -27 -26 D E P T H ( m ) 0 50 100 150 200 C37alk (ng l-1) 0 2 4 6 8 10 12 δδδδ13131313C C37 alk Fig.6
Fig. 6. Profiles for total C37alkenone concentrations and carbon
isotope ratio (δ13C) for the diunsaturated C37alkenone.
increasing the δ13C values (Rost et al., 2002; Thompson and Calvert, 1995). As it is shown in Table 2, the % PAR val-ues at depths higher than 125 m were lower than 1%, which would mean that haptophytes were light-limited at these high depths. Consequently, the more enriched δ13C values of the alkenone markers at the depth of the chlorophyll maximum might infer that haptophytes are under limited light condi-tions.
The unsaturation index (UK370)which is widely used as a proxy of sea surface temperature (Prahl and Wakeham, 1987) was calculated as the relative proportion of di-and triunsatu-rated C37 alkenones. This index was converted to a mea-sure of temperature by the commonly used empirical cali-bration equation T =(UK370–0.039)/0.034 (Prahl et al., 1988). The derived temperatures (Fig. 7) were 2 to 3 degrees higher than the measured (CTD) temperatures in surface waters. Discrepancies between the alkenone-calculated and observed temperatures might be caused by stress due to nutrient and light limitation and to differences in the stage of the growth cycle (Conte et al., 1998; Epstein et al., 1998; Yamamoto et al., 2000; Prahl et al., 2003), which result in variable alkenone synthesis. Similar observations were reported in winter at ALOHA station (Prahl et al., 2005). They were explained by simply biogeographical variations observed in the alkenone vs. temperature relationship in natural waters, which may reflect differences in genetic and physiological status of the local alkenone-synthesizing populations. Since haptophytes have a low inorganic phosphorous requirement (critical concentrations of 0.2 µmol l−1), nitrogen limitation seems likely since inorganic N concentrations at the Gyre stations were well below the half-saturation constant (Ks, the
concentration supporting an uptake rate one-half the maxi-mum rate) determined for E. huxleyi (≤0.5 µmol l−1) (Ep-pley et al., 1969). Overall and according to batch cultures
T (oC) 12 14 16 18 20 22 24 26 D E P T H ( m ) 0 50 100 150 200 250 300 T (CTD) T (UK) Fig.7
Fig. 7. Profile for CTD temperature and plot for UK370derived water temperature estimates (see text for details) from suspended particles in the gyre.
of haptophytes (Epstein et al., 1998), the observed increase in the UK370 values with the consequent overestimation of the temperatures, might indicate that this marine phytoplankton taxon is under nutrient-limited “stationary growth” condi-tions. Although other studies showed an overestimation of temperatures in light-limited cultures (e.g. Prahl et al., 2003), we exclude light limitation as the reason for our overestima-tion. The light levels measured down to 125 m depth were above light limitation level (Table 2). This overestimation can also be explained by a change in haptophyte ecology to-wards a dominance of alkenone-producing algae (Prahl et al., 2005; Popp et al., 2006b). Other reasons may be autoxida-tion of alkenones in these highly irradiated waters (Rontani et al., 2006), and/or degradation of alkenones by aerobic heterotrophic bacteria (Rontani et al., 2008), especially when residence times of particles are long.
3.3 Biogeochemical implications from carbon isotope frac-tionation
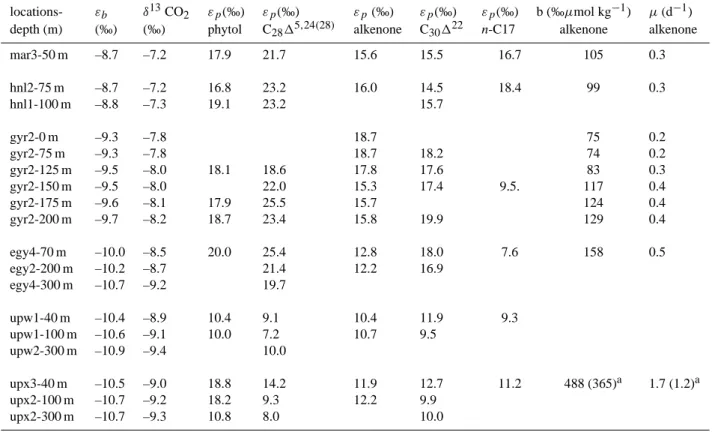
Stable carbon isotope differences between the inorganic car-bon source and that of organic carcar-bon synthesized by au-totrophic organisms known as photosynthetic carbon frac-tionation (εp), can assist in distinguishing between the
different CO2 fixation pathways (Table 5). Maximum car-bon isotope fractionation of photoautotrophic organisms us-ing the Calvin cycle, like micro-algae and cyanobacteria is in the range of 20 to 27‰ (Popp et al., 1998b; Sakata et al., 1997). However, the εpexpected for biomarkers derived
from eukaryotes can vary between 5 and 25‰ depending ba-sically on [CO2], growth rate and the ratio of cellular surface area to volume (Bidigare et al., 1997a; Popp et al., 1998). In contrast, εp for prokaryotes (cyanobacteria) ranges between
16 and 22‰ because the large surface-to-volume ratio guar-antees a large CO2 supply relative to the cellular demand.
Table 5. Carbon isotope fractionation of CO2aq with respect to bicarbonate (εb), δ13CO2(dissolved in the water column), different carbon
isotope fractionation associated with photosynthetic carbon fixation using molecular specific lipid biomarkers (εpof biomarkers) and b-value
(‰ µmol kg−1)and specific growth rate for alkenone synthesizers.
locations- εb δ13CO2 εp(‰) εp(‰) εp(‰) εp(‰) εp(‰) b (‰µmol kg−1) µ(d−1)
depth (m) (‰) (‰) phytol C2815,24(28) alkenone C30122 n-C17 alkenone alkenone
mar3-50 m –8.7 –7.2 17.9 21.7 15.6 15.5 16.7 105 0.3 hnl2-75 m –8.7 –7.2 16.8 23.2 16.0 14.5 18.4 99 0.3 hnl1-100 m –8.8 –7.3 19.1 23.2 15.7 gyr2-0 m –9.3 –7.8 18.7 75 0.2 gyr2-75 m –9.3 –7.8 18.7 18.2 74 0.2 gyr2-125 m –9.5 –8.0 18.1 18.6 17.8 17.6 83 0.3 gyr2-150 m –9.5 –8.0 22.0 15.3 17.4 9.5. 117 0.4 gyr2-175 m –9.6 –8.1 17.9 25.5 15.7 124 0.4 gyr2-200 m –9.7 –8.2 18.7 23.4 15.8 19.9 129 0.4 egy4-70 m –10.0 –8.5 20.0 25.4 12.8 18.0 7.6 158 0.5 egy2-200 m –10.2 –8.7 21.4 12.2 16.9 egy4-300 m –10.7 –9.2 19.7 upw1-40 m –10.4 –8.9 10.4 9.1 10.4 11.9 9.3 upw1-100 m –10.6 –9.1 10.0 7.2 10.7 9.5 upw2-300 m –10.9 –9.4 10.0 upx3-40 m –10.5 –9.0 18.8 14.2 11.9 12.7 11.2 488 (365)a 1.7 (1.2)a upx2-100 m –10.7 –9.2 18.2 9.3 12.2 9.9 upx2-300 m –10.7 –9.3 10.8 8.0 10.0
acalculated with the [CO
2] at the surface
Others pathways, apparently restricted to other bacteria, such as anoxygenic phototrophic bacteria, are the reversed tri-carboxylic acid cycle and the 3-hydroxypropionate pathway, both of which are characterized by significantly smaller iso-tope effects (εpof 2–14 ‰)(van der Meer et al., 2001).
We observed higher taxonomic variations in εp for
eu-karyotic algae growing in the oligotrophic areas (variations of ∼10‰) compared to the eutrophic sites of the upwelling (variations of 3 to 7‰). The variation of the carbon iso-tope fractionation for the diatom marker covered a range of ∼16‰ along the different trophic systems. In contrast, εpof
dinoflagellate and alkenone markers varied much less ca. 10 and 7‰, respectively.
Plots of the carbon isotope fractionation of the different eukaryotic markers vs the three major nutrients in the eu-photic layer showed similar trends. An example is given in Fig. 8 for the nitrate concentrations, showing a negative logarithmic curve for the diatom biomarker. εpvalues from
nutrient-rich waters at eutrophic sites were much lower com-pared to those in the nitrate limited conditions of the Gyre. However, in oligotrophic waters, the high scatter of εp
indi-cates that other factors besides major nutrients are probably affecting the carbon isotope fractionation. This is illustrated
by the small effect of nitrate concentrations on the carbon isotope fractionation of the haptophytes (alkenones).
The carbon isotope fractionation of eukaryotic mark-ers showed also a negative trend with [CO2]aq (Fig. 9). These relationships deviate from the previously reported gen-eral oceanic trend (Rau et al., 2001) and culture studies (Burkhardt et al., 1999a) where carbon isotope fractionation increases (δ13C decrease) when [CO2]aq increases. How-ever, this apparent deviation has already been observed in Peruvian upwelling waters where it was suggested that a diatom carbon concentrating mechanism (CCM) was likely the cause of the lower εpof diatoms in these waters with high
[CO2]aq. In the present study, we also observed a small ef-fect of [CO2]aqon isotope fractionation of alkenones, which agrees with other studies that privileged potential changes of εp due to growth rate and carbon uptake mechanisms in E. huxleyi (Benthien et al., 2007; Bidigare et al., 1997). A
simi-lar trend was found between [CO2] and the εpof n-C17 (data
not shown) which is consistent with a previous work with Popp et al. (1998b) who found for Synechococcus that εp
is independent of the concentration of dissolved CO2, likely because its cell geometry guarantees a large CO2supply.
y = -0.1854x + 15.181 R2 = 0.5602 y = -2.9614Ln(x) + 21.961 R2 = 0.7603 8 10 12 14 16 18 20 22 24 26 28 0 5 10 15 20 25 NO3 (µM) εεεεp ( ‰ ) haptophytes diatoms dinoflagellates haptophytes diatoms figure 8
Fig. 8. Carbon isotope fractionation factor of the eukaryotic mark-ers vs. measured nitrate concentrations across the South Pacific Ocean. Logarithmic curve fitting corresponds to diatom marker, linear fitting for haptophytes is shown to illustrate the contrast be-tween diatoms and haptophytes.
Overall, the lower isotope fractionation factors and smaller variations between the different eukaryotic markers mea-sured in the upwelling area might indicate uniformly high growth rates for the three phytoplankton taxa, diatoms, hap-tophytes and dinoflagellates and/or that phytoplankton may employ carbon concentrating mechanisms (CCM) other than diffusion, which actively transport inorganic carbon into cells. Similar findings were reported by other authors (Pan-cost et al., 1999; Pan(Pan-cost et al., 1997; Rau et al., 2001; Werne and Hollander, 2004) who invoked that an active transport of bicarbonate into the cell may play a role in the carbon isotope fractionation by phytoplankon in upwelling areas with high concentrations of CO2. Light is another factor which may decrease the carbon isotope fractionation under low satura-tion levels since it has opposite effects on the εp compared
to nutrient-limited conditions (Rost et al., 2002, Cassar et al., 2006). However, despite light limiting conditions at 40 m, phytoplankton sampled at theses depths are not necessarily light limited. In hydrodynamically active zones like the up-welling, it can be reasonably admitted that phytoplankton cells produce under light conditions averaged over the mixed layer and not encountered at the depths they were sampled. Hence, it can be excluded that irradiance affected the isotopic fractionation of the different phytoplankton taxa in the upper mixed layer of the upwelling area.
In contrast, the GYR and EGY sites exhibited the high-est carbon isotope fractionation factors for eukaryotic algae and in particular for the diatom marker. Their values reached 25–26‰ which is close to the maximum isotope fractiona-tion of eukaryotic algae utilizing Rubisco and β-carboxylase enzymes (Goericke et al., 1994; Laws et al., 1997). Such high εp values cannot be obtained by bicarbonate uptake
and are indicative of diffusive CO2 uptake. Moreover,
ac-y = -0.1804x + 18.491 R2 = 0.4148 8 10 12 14 16 18 20 22 24 26 28 10 15 20 25 30 35 40 CO2 (µM) εεεεp ( ‰ ) haptophytes diatoms dinoflagellates haptophytes diatoms figure 9
Fig. 9. Carbon isotope fractionation factors of eukaryotic markers vs. CO2concentrations.
tive uptake of carbon in oligotrophic sites is rather unlikely because of the higher metabolic energy required and CCM may be inhibited by the low oceanic concentrations of cer-tain trace metals (Morel et al., 1994). In these oligotrophic sites, lowest εp values were measured for the haptophytes
and dinoflagellates, which might infer higher growth rates for these organisms compared to diatoms.
In the mesotrophic areas of the Marquesas Islands (MAR and HNL sites), εpvalues for alkenone producers and
dinos-terol were also lower than those for diatoms, but still higher than those estimated in the upwelling area. The similar εp
values for alkenones measured in the poor-nitrated waters of the Gyre and in the high nutrient waters of the HNL site sug-gest that nitrogen and phosphate are not the limiting nutrients affecting carbon isotope fractionation by the prymnesiophyte algae. This finding contrasts with a study from the NE Pacific where nitrogen starvation seemed to affect the εpvalues for
alkenones (Eek et al., 1999) and adds further support to the “trace-metal-growth-rate” hypothesis (Bidigare et al., 1997), which suggested that micronutrients control growth regard-less of the concentrations of PO4. Overall, the relatively low εpvalues for alkenones from the oligo- and mesotrophic
wa-ters seem to indicate the use of a CCM other than diffusion. However, recent studies provided clear evidence that hap-tophytes have developed an inefficient but regulated CCM, with a direct uptake of HCO−3 (Rost et al., 2003). The high-est εpfor dinoflagellates at the GYR and EGY sites are likely
associated to lower growth rates and might be explained by the low N:P ratios since optimum dinoflagellate growth oc-curs at ratios ranging between 6 and 15 (Hodgkiss and Ho, 1997).
The carbon isotope fractionation derived from n-C17 alkane reached the values of 17–19‰ in the mesotrophic wa-ters of the HNL and MAR sites, which are within the range of 16–22‰ reported for cyanobacteria biomass (Sakata et al., 1997). In contrast, the low carbon isotope fractionations
(8 to 12‰) obtained for n-C17 in the oligotrophic waters of the GYR and EGY sites as well as in the eutrophic wa-ters of the upwelling area are suggestive of microorganisms which use CO2-concentrating mechanisms. Despite substan-tial advances over the past few years, in the understand-ing of the mechanism and genes involved in cyanobacte-rial CCMs (Badger and Price, 2003), the induction of the CCM mechanism remains to be determined (McGinn et al., 2003; Woodger et al., 2005). Also, since similar εp values
were measured in the upwelling area for biomarkers derived from eukaryotic plankton, it cannot be ruled out that n-C17in the upwelling sites is mainly derived from some eukaryotic source.
The b-values and growth rates for alkenone-producing haptophytes measured in the euphotic layer varied almost tenfold, ranging from 75 to 490‰ µmol kg−1and from 0.2 to 1.7 d−1, respectively. The highest growth rates were esti-mated in the waters of the Chilean upwelling, followed by the EGY (0.5 d−1), the GYR (0.4 d−1)and finally the MAR and HNL (0.3 d−1)sites. The lowest values were found in the surface waters of the Gyre (0.2 d−1). Overall, our b-values and growth rates compare to those reported for the Bering Sea, Arabian Sea, Southern Ocean and equatorial Pacific at 140◦W (84–136 ‰ µmol kg−1and 0.2–0.4 d−1)(Bidigare et al., 1997; Harada et al., 2003; Laws et al., 2001) but they are slightly higher than those reported from the Peru upwelling zone (197–397‰ µmol kg−1 and 0.5–1 d−1) (Bidigare et al., 1997). This is probably related to the strength of the upwelling as indicated by the higher nutrient and CO2 con-centrations in the sampled area and by the larger photope-riod. It is also noteworthy that the calculated growth rates are maximum estimates and are valid only on the assump-tion that alkenone producing haptophytes obtain CO2(as the only carbon source) solely by passive diffusion, which may not be the case in the nutrient-rich waters of the upwelling zone. Moreover, alkenones may occur well below the eu-photic zone (40–100 m) in fecal material produced by her-bivorous zooplankton (Grice et al., 1998) and other particles, which have been transported down due to physical mixing and sinking. Through the continuous convective movement in the water column of this dynamic area, the phytoplankton cells are likely to encounter lower average CO2 concentra-tions and higher irradiance than at the depths they were sam-pled. In this sense, if we consider that alkenones found at depths of 40–100 m were produced in the upper layer where CO2 concentration is lower (∼28 µmol kg−1)and light is not limited, the estimated growth rate decreases to 1.2 d−1, which is in the range of typical values found in field popula-tions of nutrient rich waters (Bidigare et al., 1997).
The b-values for the alkenone synthesizer phytoplankton were well distinguishable between the two contrasting envi-ronments: low at the oligotrophic sites and a high value in the upwelling zone. Due to the natural correlation between concentrations of dissolved CO2and nutrients, b-values ob-viously co-varied with the concentrations of silicate,
ni-trate and phosphate. However, at the very low phosphate levels (<0.4 µmol l−1) of the oligotrophic sites, b-values showed relatively high variation (75–160‰ µmol kg−1)and compared very well with the corresponding values reported by Bidigare et al. (1997), but also with those from other oligotrophic areas (Laws e al., 2001; Benthien et al., 2002). This confirms the interpretation given by these authors that growth rates may be controlled by some trace micronutrient (e.g. Zn) (Bidigare et al., 1997; Shaked et al., 2006), and/or that adaptation of the phytoplankton physiology to the low nutrient waters might result in higher variability in the effi-ciency of the different carbon uptake mechanisms.
4 Summary and conclusions
As a summary, lipid biomarker abundances together with their relative component contribution confirmed the general expectations on the predominance of diatom algae in nutrient-rich waters, and of zooplankton, bacteria and de-graded material below the euphotic zone. In contrast, the hyperoligotrophic area of the Gyre was characterized by low concentrations of lipid biomarkers, and especially by un-precedented deep maxima of eukaryotic markers, and rather unexpectedly high heterotrophic activity in surface waters. Among these biomarkers, phytol and the more specific diatom sterols followed the chlorophyll profile. However, highest concentrations were measured for alkenones with maximum values above chlorophyll maximum and above the concentration peak of 19’HF, thus indicating a quite specific community of the alkenone producing prymnesiophytes. Discrepancies between the alkenone-calculated and the in situ temperatures of the surface layer from the gyre seemed to be caused by nutrient limitation and/or degradation of alkenones. Carbon isotope ratios of alkenones markers ev-idenced that prymnesiophytes inhabiting the depth of the chlorophyll maximum were likely light-limited.
Our results along the different trophic systems in the South East Pacific showed also that source-specific algal biomarkers and compound specific isotope analyses largely responded to the composition of the phytoplankton and to the different processes of carbon acquisition. Within a prob-ably complex pattern of processes that link the εp of the
different phytoplankton taxa and their environmental factors, our field study illustrates that carbon isotope fractionation values from nutrient-rich waters were much lower compared to those in nitrate limited. However, the high scatter of εp
in the oligotrophic conditions indicates that other factors be-sides major nutrients are probably affecting the carbon iso-tope fractionation. Light not being generally a limiting fac-tor in the euphotic layer, higher growth rates and/or active uptake of HCO−3 could explain the reduced εpvalues of the
nutrient-rich waters. These relatively low and similar εp
over the different phytoplankton taxa of the nutrient-rich wa-ters implied non-diffusive C transport, whereas the high and
4000 t (s) 4700 0.0 3.0 1.09 1.13 4 4 [ V ] 4 5 /4 4 C28∆5,24(28) C30∆22 Annex A C28∆24(28)
Fig. A1. GC-C-IRMS of the sterol fraction showing the incomplete chromatographic separation of the compound 24-methylcholesta-5,24(28)-dien-3β-ol (C2815,24(28)) stenol with their minor stanol pair compound (24-methyl-5α-cholest-24(28)-en-3β-ol, C28124(28)). Both compounds were integrated together
to yield a single δ13C value.
dispersed εp values from the nutrient-poor waters might
re-sult from the lower growth rates and from higher variability in the efficiency of the carbon uptake mechanism by diffu-sion. However, the available data do not allow distinguishing between the two factors.
Acknowledgements. We thank James Orr and Lamia Azouzi for
helpful science discussions. Dominique Tailliez and Claudie Bournot are warmly thanked for their efficient help in CTD rosette management and data processing. A. Benthien and two anonymous reviewers are acknowledged by their valuable suggestions and com-ments on an earlier version of the manuscript.
This is a contribution of the BIOSOPE project of the LEFE-CYBER program. This research was funded by the Centre National de la Recherche Scientifique (CNRS), the Institut des Sciences de l’Univers (INSU), the Centre National d’Etudes Spatiales (CNES), the European Space Agency (ESA), The National Aeronautics and Space Administration (NASA) and the Natural Sciences and Engineering Research Council of Canada (NSERC). The IAEA is grateful for the support provided to its Marine Environment Laboratories by the Government of the Principality of Monaco. Edited by: J. Middelburg
References
Azouzi, L., Gonc¸alves Ito, R., Touratier, F., and Goyet, C.: An-thropogenic carbon in the eastern South Pacific Ocean, Biogeo-sciences Discuss., 4, 1815–1837, 2007,
http://www.biogeosciences-discuss.net/4/1815/2007/.
Badger, M. R. and Price, G. D.: CO2concentrating mechanisms in
cyanobacteria: molecular components, their diversity and evolu-tion, J. Exp. Bot., 54, 609–622, 2003.
Baker, E. W. and Louda, J. W.: Thermal aspects in chlorophyll geo-chemistry. In: Adv. Org. Geochem., 1981, edited by: M. Bjorøy, Wiley, Chichester, 401–421, 1983
Barlow, R. G., Mantoura, R. F. C., Gough, M. A., and Fileman, T. W.: Pigment signatures of the phytoplankton composition in the northeastern Atlantic during the 1990 spring bloom. Deep Sea-Res. Pt. II, 40, 459–477, 1993.
Beaufort, L., Couapel, M., Buchet, N., and Claustre, H.: Calcite production by Coccolithophores in the South East Pacific Ocean: from desert to jungle, Biogeosciences Discuss., 4, 3267–3299, 2007,
http://www.biogeosciences-discuss.net/4/3267/2007/.
Benthien, A., Andersen, N., Schulte, S., M¨uller, P. J., Schneider R. R., and Wefer, G: Carbon isotopic composition of the C37:2
alkenone in core-top sediments of the South Atlantic Ocean: ef-fects of CO2and nutrient concentrations, Global Biogeochem.
Cy., 16, 1012, doi:10.1029/2001GB001433, 2002.
Benthien, A., Andersen, N., Schulte, S., Muller, P. J., Schneider, R. R. and Wefer, G.: The carbon isotopic record of the C37:2 alkenone in the South Atlantic: Last Glacial Maximum (LGM) vs. Holocene, Palaeogeography, Palaeoclimatology, Palaeoecol-ogy, 221, 123–140, 2005.
Benthien, A., Zondervan, I., Engel, A., Hefter, J., Terbruggen, A., and Riebesell, U.: Carbon isotopic fractionation during a meso-cosm bloom experiment dominated by Emiliania huxleyi: Ef-fects of CO2 concentration and primary production. Geochim.
Cosmochim. Ac., 71, 1528–1541, 2007.
Bidigare, R. R., Fluegge, A., Freeman, K. H., Hanson, K. L., Hayes, J. M., Hollander, D., Jasper, J. P., King, L. L., Laws, E. A., Milder, J., Millero, F. J., Pancost, R. D., Popp, B. N., Stein-berg, P. A., and Wakeham, S. G.: Consistent fractionation of C in nature and in the laboratory: growth-rate effects in some haptophyte algae, Global Biogeochem. Cy., 11, 279–292, 1997. Bidigare, R. R., Hanson, K. L., Buesseler, K. O., Wakeham, S. G.,
Freeman, K. H., Pancost, R. D., Millero, F. J., Steinberg, P. A., Popp, B. N., Latasa, M., Landry, M. R., and Laws, E. A.: Iron-stimulated changes in13C fractionation and export by equatorial Pacific phytoplankton: Toward a paleogrowth rate proxy, Paleo-ceanography, 14, 589–595, 1999.
Burkhardt, S., Riebesell, U., and Zondervan, I.: Effects of growth rate, CO2 concentration, and cell size on the stable carbon isotope fractionation in marine phytoplankton, Geochim. Cos-mochim. Ac., 63, 3729–3741, 1999a.
Burkhardt, S., Riebesell, U., and Zondervan, I.: Stable carbon isotope fractionation by marine phytoplankton in response to daylength, growth rate, and CO2availability, Mar. Ecol.-Progr.
Ser., 184, 31-41, 1999b.
Cassar, N., Laws, E. A., and Popp, B. N.: Carbon isotopic frac-tionation by the marine diatom Phaeodactylum tricornutum un-der nutrient- and light-limited growth conditions, Geochim. Cos-mochim Ac, 70, 5323–5335, 2006.