HAL Id: hal-02929953
https://hal.archives-ouvertes.fr/hal-02929953
Submitted on 16 Sep 2020
HAL is a multi-disciplinary open access
archive for the deposit and dissemination of
sci-entific research documents, whether they are
pub-lished or not. The documents may come from
teaching and research institutions in France or
abroad, or from public or private research centers.
L’archive ouverte pluridisciplinaire HAL, est
destinée au dépôt et à la diffusion de documents
scientifiques de niveau recherche, publiés ou non,
émanant des établissements d’enseignement et de
recherche français ou étrangers, des laboratoires
publics ou privés.
Distributed under a Creative Commons Attribution| 4.0 International License
Change in snow phenology and its potential feedback to
temperature in the Northern Hemisphere over the last
three decades
Shushi Peng, Shilong Piao, Philippe Ciais, Pierre Friedlingstein, Liming Zhou,
Tao Wang
To cite this version:
Shushi Peng, Shilong Piao, Philippe Ciais, Pierre Friedlingstein, Liming Zhou, et al.. Change in snow
phenology and its potential feedback to temperature in the Northern Hemisphere over the last three
decades. Environmental Research Letters, IOP Publishing, 2013, 8 (1), pp.014008.
�10.1088/1748-9326/8/1/014008�. �hal-02929953�
Environmental Research Letters
LETTER • OPEN ACCESS
Change in snow phenology and its potential
feedback to temperature in the Northern
Hemisphere over the last three decades
To cite this article: Shushi Peng et al 2013 Environ. Res. Lett. 8 014008
View the article online for updates and enhancements.
Related content
Recent changes in phenology over the northern high latitudes detected from multi-satellite data
Heqing Zeng, Gensuo Jia and Howard Epstein
-Spatiotemporal patterns of
evapotranspiration in response to multiple environmental factors simulated by the Community Land Model
Xiaoying Shi, Jiafu Mao, Peter E Thornton et al.
-Is Eurasian October snow cover extent increasing?
R D Brown and C Derksen
-Recent citations
Spatiotemporal variability of snow cover timing and duration over the Eurasian continent during 1966–2012 Xinyue Zhong et al
-Evaluation of snow cover and snow water equivalent in the continental Arctic in CMIP5 models
María Santolaria-Otín and Olga Zolina
-Snow cover change and its relationship with land surface temperature and vegetation in northeastern North America from 2000 to 2017
Kristen Thiebault and Stephen Young
-IOP PUBLISHING ENVIRONMENTALRESEARCHLETTERS Environ. Res. Lett. 8 (2013) 014008 (10pp) doi:10.1088/1748-9326/8/1/014008
Change in snow phenology and its
potential feedback to temperature in the
Northern Hemisphere over the last three
decades
Shushi Peng
1, Shilong Piao
1,2,6, Philippe Ciais
3, Pierre Friedlingstein
4,
Liming Zhou
5and Tao Wang
31Department of Ecology, College of Urban and Environmental Sciences, Peking University, Beijing 100871, People’s Republic of China
2Institute of Tibetan Plateau Research, Chinese Academy of Sciences, Beijing 100085, People’s Republic of China
3LSCE, UMR CEA-CNRS-UVSQ, CEA, L’Orme des Merisiers, F-91191 Gif-sur-Yvette, France 4QUEST/Department of Earth Sciences, University of Bristol, Bristol BS8 1RJ, UK
5Department of Atmospheric and Environmental Sciences, State University of New York, Albany, NY 12222, USA
E-mail:[email protected] Received 25 October 2012
Accepted for publication 7 January 2013 Published 21 January 2013
Online atstacks.iop.org/ERL/8/014008
Abstract
Trends in the duration or extent of snow cover are expected to feedback to temperature trends. We analyzed trends in dates of onset and termination of snow cover in relation to temperature over the past 27 years (1980–2006) from over 636 meteorological stations in the Northern Hemisphere. Different trends in snow duration are observed over North America and Eurasia. Over North America, the termination date of snow cover remained stable during the 27 years, whereas over Eurasia it has advanced by 2.6 ± 5.6 d decade−1. Earlier snow cover termination is systematically correlated on a year-to-year basis with a positive temperature anomaly during the snowmelt month with a sensitivity of −0.077◦C d−1. These snow feedbacks to air temperature are more important in spring, because high net radiation is coupled with thin snow cover.
Keywords: climate change, climate feedback, global warming, snow phenology S Online supplementary data available fromstacks.iop.org/ERL/8/014008/mmedia
1. Introduction
The widely distributed snow cover across the Northern Hemisphere (NH) during the winter season has been shown
Content from this work may be used under the terms of theCreative Commons Attribution 3.0 licence. Any further distribution of this work must maintain attribution to the author(s) and the title of the work, journal citation and DOI.
6 Address for correspondence: Peking University, Beijing 100871, People’s
Republic of China.
to be a sensitive indicator of climate change (IPCC2007). As a consequence of current global warming, particularly over the high latitude regions (IPCC 2007), the spatial extent and the duration of snow cover in the NH have both decreased remarkably, and will continue to do so in the future, according to climate projections (IPCC 2007, Brown and Robinson
2011, Smith et al2004). Both satellite measurements and in situ observations robustly document a persistent decreasing trend in snow cover extent (IPCC2007, Groisman et al1994, Serreze and Francis2006, Dye2002, Choi et al2010) and a shortening of snow cover duration associated with the increase
1
in temperature during winter and spring over the high latitude regions of NH (Smith et al2004, Choi et al2010, Kapnick and Hall2010). For example, using multi-data sets from satellites and climate reanalysis products, Brown and Robinson (2011) reported that spring (March and April) snow cover extent over NH retreated by −0.8 million km2 decade−1 (7% in March and 11% in April) from 1970 to 2010. Similarly, using weekly snow cover dataset derived from NOAA satellites data (Robinson1993), Choi et al (2010) also found that full snow cover duration decreased by 5.3 d decade−1from 1972 to 2007, mostly due to earlier snowmelt date. The decrease in snow cover and earlier snow melt in NH have important impacts on the hydrological cycle and biogeochemical cycles of terrestrial ecosystems (Smith et al 2004, Stewart et al
2005, Grippa et al2005). The spring stream-flow peak could shift earlier and affect the soil water storage in response to earlier snowmelt (Stewart et al2005). Moreover, changes in snow cover extent and snow melt timing have been shown to correlate with vegetation activity (Grippa et al 2005, Peng et al 2010) and to impact the carbon balance of terrestrial ecosystems (Monson et al2006, McDonald et al2004, Zhou et al 2001, Jonas et al 2008). Therefore, it is essential to understand the processes that control snow cover changes (IPCC2007, Brown and Robinson2011).
Previous studies suggested that the decrease in snow cover extent and duration is a direct response to the increasing temperature (Brown and Robinson 2011, Stone et al 2002, Chapin et al 2005). During the period 1922–2010, air temperature could explain ∼50% of the interannual variance in NH spring snow cover extent (Brown and Robinson2011), and the sensitivity of spring snow cover extent to temperature is estimated as −0.8 to −1.0 million km2 ◦C−1 (Brown and Robinson 2011). Hence, changes in snow cover extent and duration are indicators of warming (IPCC2007, Chapin et al 2005). But in turn, changes in snow cover extent and duration also feedback on temperature. Changes in snow cover and snow thickness alter the surface albedo (Chapin et al 2005, Euskirchen et al 2007), the surface energy partitioning (Groisman et al1994), and the hydrological cycle (Stewart et al 2005, Hamlet et al 2005). The decrease in surface albedo due to decrease in snow cover fractional area and duration could induce more absorbed solar radiation at the surface, which in turn amplify the increase in temperature. These processes are estimated to act as a robust positive feedback, i.e. to further amplify the warming trends in pan-Arctic regions (Kapnick and Hall2010, D´ery and Brown
2007, Chapin et al 2005, Euskirchen et al 2007). This feedback is usually referred as snow albedo feedback (Bony et al2006, Hall and Qu2006, Fernandes et al2009).
Stone et al (2002) estimated that an 8 d advance of snow melt date led to additional ∼64 MJ m−2 of absorbed solar radiation (∼2 W m−2 feedback forcing on an annual basis) at the surface of Barrow station from 1966 to 2000. Using satellite-based snow cover and planetary albedo data products, Groisman et al (1994) estimated an increase in net radiation of 0.9 W m−2 due to the albedo decrease from decreasing snow cover extent over northern extratropical land regions from 1979 to 1990. Comparing the observed snow albedo
feedback with the simulation results of 17 IPCC AR4 climate models, the sensitivity of surface albedo to temperature is the main uncertainty in the models (0.4–1.4% K−1) (Hall and Qu
2006). Thus, quantifying and understanding the sensitivity of surface albedo to temperature in the snow albedo feedback is critical for assessing and projecting the future climate.
In this study, using daily observations of snow cover and monthly mean air temperature from 636 meteorological stations over NH, we first characterize the spatial patterns of change in snow cover duration and the snow onset and end dates in different regions of the NH, and then estimate the sensitivity of snow disappearance date to surface air tempera-ture and the feedback, defined in this study as the sensitivity of surface air temperature to snow disappearance date during the period 1980–2006. Moreover, we separate the contribution of snow albedo feedback to the observed increase in surface air temperature during the snow melt season in spring.
2. Datasets and methods
2.1. Datasets
Table 1 summarizes the datasets used in this study. Daily snow depth and surface air temperature data from August 1979 to July 2006 in China, Europe, Russia, Canada and USA were obtained from the National Meteorological Information Center of the China Meteorological Admin-istration (Peng et al 2010), European Climate Assess-ment & Dataset (ECA&D) (available at http://ecad.knmi. nl/dailydata/predefinedseries.php), Russian Research Institute of Hydrometeorological Information—World Data Center (RIHMI-WDC) (Bulygina et al 2011), the National Climate Data and Information Archive of Environment Canada (available at http://climate.weatheroffice.gc.ca/prods servs/ index e.html) and the United States Historical Climatology Network (USHCN) (available at http://cdiac.ornl.gov/epubs/ ndp/ushcn/ushcn.html), respectively. The albedo dataset used in this study was from EOS-Terra-MODIS MOD43C3 Nadir BRDF-Adjusted Reflectance (NBAR) 2001–2006 products, at a spatial resolution of 0.05◦×0.05◦and 8 d interval including black sky albedo (BSA) and white sky albedo (WSA) over short-wave broadband (0.3–5.0 µm) (Schaaf et al 2002). WSA shows similar results to BSA, so we used BSA to illustrate the results here. The bias in MODIS albedo data (Collection V005) is mostly less than 5% (Liu et al2009). The incoming short-wave radiation dataset used in this study was from ERA-Interim reanalysis produced by European Centre for Medium-Range Weather Forecasts (ECMWF) over the period 2001–2006, at ∼0.7◦× ∼0.7◦ spatial resolution and 6 h temporal resolution, with the bias of ∼2 W m−2 (Dee et al2011).
2.2. Analyses
To avoid the impact of ephemeral snow on the ground on the snow cover duration, the onset date of snow cover for year (t) at each meteorological station is defined as the first continuous five days on which snow was observed to cover the ground
Environ. Res. Lett. 8 (2013) 014008 S Peng et al
Table 1. Datasets used in this study.
Datasets Method
Spatial
domain Time span
Temporal resolution Number of stations/spatial resolution Source/reference Snow depth and surface air temperature Ground-based meteorological station observation
China 1979–2006 Daily 108 National Meteorological Information Center of the China Meteorological
Administration (Peng et al2010) Europe 1979–2006 Daily 108 European Climate Assessment & Dataset (ECA&D) (available at
http://ecad.knmi.nl/dailydata/ predefinedseries.php) Russia 1979–2006 Daily 89 Russian Research Institute of
Hydrometeorological Information World Data Center
(RIHMI-WDC) (Bulygina et al
2011)
Canada 1979–2006 Daily 130 National Climate Data and Information Archive of
Environment Canada (available at
http://climate.weatheroffice.gc.ca/ prods servs/index e.html) United
States
1979–2006 Daily 201 United States Historical Climatology Network (USHCN) (available athttp://cdiac.ornl.gov/ epubs/ndp/ushcn/ushcn.html) Albedo Satellite Global 2001–2006 8 d 0.05◦
×0.05◦ www-modis.bu.edu/brdf/product. html(Schaaf et al2002) Incoming short-wave radiation Reanalysis Global 2001–2006 6 h ∼0.7◦× ∼ 0.7◦
European Centre for
Medium-Range Weather Forecasts (ECMWF) (Dee et al2011)
surface in the fall of the year (t − 1); the end date of snow cover is defined as the last continuous five days when snow cover was observed in the spring of the year (t). The snow cover duration is defined as the number of days from the onset date of snow cover to the end date of snow cover for the year (t). For any site, the year (t) was omitted from the analysis if there were one or more days without snow depth data during the period from 1 August of year (t − 1) to 31 July of year (t). Furthermore, in order to reduce uncertainties caused by the short time period of observation, we consider only stations for which at least 20 years of daily snow depth data are available during the study period. Among 636 meteorological stations, which have at least 20 years of daily snow depth data, only 575 stations have at least 20 years of both daily snow depth and monthly air temperature data during the study period 1980–2006. Maximum snow depth during snow season is calculated as the maximum snow depth record from the onset date of snow cover to the end date of snow cover. We referred spring and fall as the snowmelt (February–July) and onset (September–January) season.
To map the spatial distribution of the trend of the end date of snow cover (DE), we applied the trend
detection methodology from Weatherhead et al (1998) which consider the autocorrelation of the underlying noise processes (assuming noise is autoregressive of the order of 1), at each of the 636 meteorological stations with at least 20 years of daily snow depth data during the period 1980–2006. We similarly calculated the trend of the onset date of snow cover(DO), the
duration of snow cover and the temperature at each site.
For the sensitivity of DE to temperature, to remove the
effects of snow depth on DE, we regressed the end date DEas
dependent variable with average air temperature during the month before snowmelt (TM−1) and maximum snow depth
(SDM) as independent variables.
DE=a × TM−1+b × SDM+c (1)
where a and b are regression coefficients, and c is the residual error. DEmainly depends on the temperature before snowmelt
and the maximum snow depth to melt (see section 3). We defined the regression coefficient of TM−1(a) as the sensitivity
of DEto temperature.
To examine the effect of positive feedback of earlier snowmelt on temperature, we performed a multiple linear regression (equation (2)) using average air temperature during snowmelt month (TM) as the dependent variable, and DEand
average air temperature during the month before snowmelt (TM−1) as independent variables.
TM=s × DE+p × TM−1+q (2)
where s and p are regression coefficients, and q is the residual error. We assumed that interannual variations of TM
come from general atmosphere circulation and the local snow albedo feedback, which are reflected by the term p×TM−1and
s × DE, respectively. The slope of the regression, s, defines the
sensitivity of temperature to DE.
Similarly, for the sensitivity of temperature to DO, we
performed the multiple linear regression as equation (2), but using the average air temperature during snow onset month
(TO) as the dependent variable, and DO and average air
temperature during the month before snow onset (TO−1) as
independent variables as equation (3)
TO=s × DO+p × TO−1+q, (3)
where s and p are regression coefficients, and q is the residual error. The slope of the regression, s, defines the sensitivity of temperature to DO.
For the incoming short-wave (SW) radiation at surface at DE or DO in each station, we used average daily incoming
SW radiation at DEor DOduring the period 2001–2006 in the
pixel (6 h, ∼0.7◦× ∼0.7◦) where the station located. For the
surface albedo, we resample the station surface albedo from MODIS MOD43C3 (8 d, 0.05◦×0.05◦). For each station,
we used maximum and minimum black sky albedo (BSA) and white sky albedo (WSA) from MODIS MOD43C3 during the month of snowmelt as the surface albedo before and after snowmelt (figure S1 available atstacks.iop.org/ERL/8/ 014008/mmedia), respectively. Then we took the difference in BSA before and after snowmelt as δBSA. The product of incoming SW radiation during snowmelt (snow onset) by δBSA is the difference in absorbed short-wave energy (ASR) between snow free and snow covered surface (δASR).
3. Results and discussion
3.1. Changes in the onset (end) date and duration of snow cover from 1980 to 2006
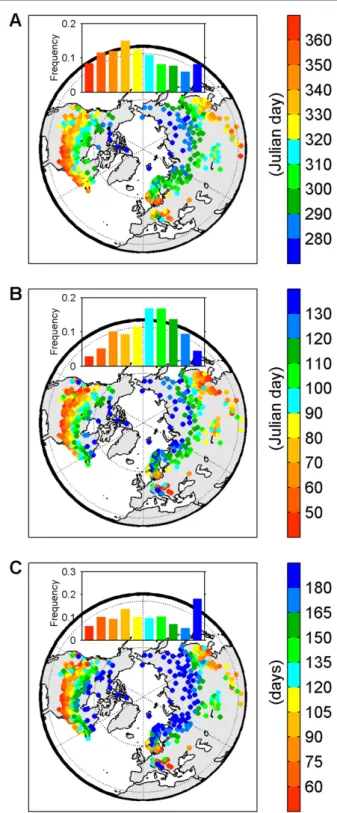
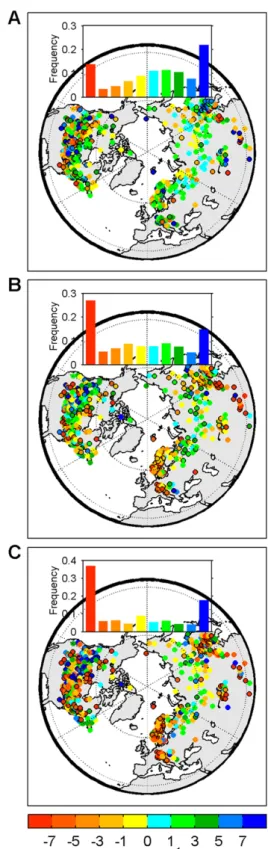
Figures1(A) and (B) show the spatial patterns of mean onset and end date of snow cover during the period 1980–2006. There are clear latitudinal gradient patterns for the onset (earlier with higher latitude) and end (later with higher latitude) date of snow cover (figures 1(A) and (B)). Then the mean snow cover duration shows longer snow duration period with higher latitude (figure 1(C)). We first applied the trend detection method (Weatherhead et al 1998) to the time series of the onset and end date of the snow cover in each year, and of the snow cover duration at each station (figure 2). A decrease in snow cover duration is found for 63% of the stations (figure 2(C)). This result agrees with the observation from Scanning Multi-channel Microwave Radiometer (SMMR) satellite data with global coverage at 25 km resolution and 2 d revisit (Choi et al 2010, Takala et al2009). The rate of shrinking of snow duration is greater than five days per decade at more than 34% of the 636 stations (figure2(C)). Interestingly, North America and Eurasia show different trends for the end date of snow cover in spring. A trend towards an earlier end date of snow cover is found at 70% of the Eurasian sites, with 28% of the sites showing an advance of snowmelt in spring as fast as five days per decade. By contrast, the trends in the end date of snow cover over North America exhibit a fragmented spatial pattern. At the continental scale, the end date of snow cover over the last 27 years shows a rapid advance for Eurasia (−2.6 ± 5.6 d decade−1) and virtually no trend for North America (0.1 ± 5.8 d decade−1). The onset date of the first snow shows a trend towards later dates in Eurasia (1.3±4.9 d decade−1) and North
Figure 1. Spatial patterns of mean (A) onset date of snow cover (Julian day), (B) end date of snow cover (Julian day), and (C) snow cover duration (days) from 1980 to 2006 over 636 meteorological stations in the Northern Hemisphere. The insets show the frequency distributions of corresponding means.
America (1.1 ± 4.9 d decade−1). These results are consistent with the trends of vegetation phenology estimated by satellite observation and some terrestrial biogeochemical cycle models (Smith et al 2004, Tucker et al2001, Piao et al2008, Jeong et al 2011). The green-up of vegetation in spring for many ecosystems north of 25◦N was modeled to follow a trend
Environ. Res. Lett. 8 (2013) 014008 S Peng et al
Figure 2. Trends in (A) the onset date of snow cover (d decade−1), (B) the end date of snow cover (d decade−1), and (C) snow cover duration (d decade−1) from 1980 to 2006 over 636 meteorological stations in the Northern Hemisphere. The insets show the frequency distributions of corresponding trends. Black-edged circles indicates that the trend is statistically significant (P< 0.05).
towards earlier dates in Eurasia (Piao et al2008, Jeong et al
2011), in agreement with satellite observation of vegetation reflectance (Zhou et al2001).
3.2. Sensitivity of the end date of snow cover to temperature We hypothesize that the geographically different trends in snow cover phenology between North America and Eurasia for the end date of snow cover, are associated with local temperature trends. From co-located temperature records at 575 snow measurement stations (see datasets and methods), we found that in the seasons of snow melt (February–July), 85% of the Eurasian meteorological stations indeed show an increase in temperature during the month of snowmelt (TM) and TM increased by 0.21 ± 0.18◦C decade−1 for all
Eurasian stations, whereas only 49% of the North American stations show an increase in TM and at a smaller rate of
0.00 ± 0.21◦C decade−1 for all North American stations. During the fall (seasons of snow accumulation beginning), however, air temperature appears to increase at a similar rate over North America (0.10±0.15◦C decade−1) as over Eurasia
(0.13 ± 0.14◦C decade−1), in agreement with the hypothesis of a co-variation between temperature and the presence of snow.
In addition to spring air temperature, we also hypothesize that the end date of snowmelt is also related to snow depth, a proxy for the amount of snow to be melted (Stone et al
2002). Among the 636 stations in this study, 95% of them show a positive correlation of the end date of snowmelt with the maximum snow depth during the snow season (statistically significant at 49% of the 636 stations). This corroborates the work by Stone et al (2002) who reported that snow water equivalent influences the snowmelt date at Barrow station. We found that the spatial distribution of the trend in maximum snow depth during the snow season can only explain a limited (7.0%), but statistically significant (P< 0.001) portion of the observed distribution in the trend in end date of snowmelt over the 636 stations.
To estimate the coupling between spring snow disappear-ance and air temperature, we first performed a correlation analysis between the end dates of snow cover each year and TM−1(monthly air temperature during the month before
snowmelt) across 575 stations where at least 20 years of daily snow cover and collocated air temperature data were available during the study period. A negative correlation between the end date of snow cover and TM−1was obtained at more than
94% of the 575 stations (statistically significant at 40% of the stations), suggesting that spring air temperature plays a critical role in controlling the timing of snowmelt. Because both maximum snow depth during snow season and spring air temperature can influence the end date of snow cover, equation (1) was applied to estimate the sensitivity of the end date of snow cover to TM−1after controlling the effect of snow
depth on the end date of snow cover for each station (partial correlation analysis). We found that, for a given increase of TM−1of 1◦C, the end date of snow cover advances on average
by 1.6 ± 1.8 d (figure 3(A)). In addition to the impact of warmer spring temperatures on the end date of snow cover, a feedback of snowmelt on air temperature is also expected (Groisman et al 1994, D´ery and Brown2007, Hall and Qu
2006). The magnitude of this feedback is analyzed below.
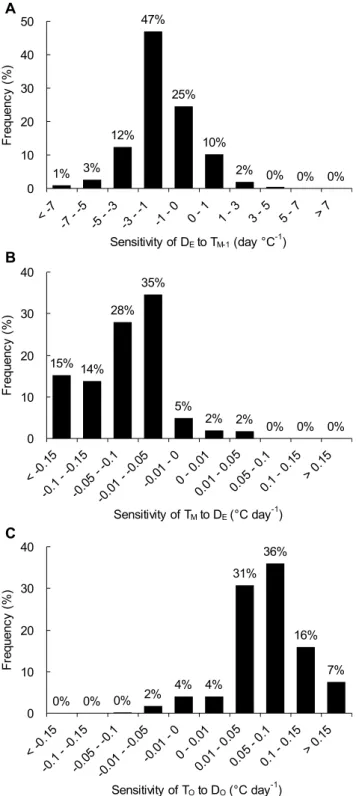
Figure 3. Histogram of (A) sensitivity of the end date of snow cover (DE) to temperature during the month before snowmelt (TM−1), (B) sensitivity of temperature during the month of snowmelt (TM) to the end date of snow cover (DE), and
(C) sensitivity of temperature during the month of snow onset (TO) to the onset date of snow cover (DO).
3.3. Sensitivity of spring (autumn) temperature to the end (onset) date of snow cover
In this section, we made an attempt to quantify the feedback of snowmelt on spring temperature. To do so, we established a relationship between the end date of snow cover (DE) and
temperature during the month of snowmelt (TM) for each
station (retaining only sites with at least 20 years of daily snow cover and air temperature data from 1980 to 2006). We found that 98% of the stations exhibited a negative correlation between TM and DE (statistically significant at 67% of
stations). At 69% of the stations, TMshows an even stronger
negative correlation with DEthan with TM−1. We performed
multiple linear regression analysis using TMas the dependent
variable and both DE and TM−1 as independent variables
(predictors) to further remove the effect of autocorrelation of temperature between two consecutive spring months (see datasets and methods). The result was that changes in DE
are significantly and negatively correlated with TM at 332
of the 575 NH stations, when controlling for the effect of TM−1. The probability that this occurs purely by chance is
estimated to be less than 0.1% if all station records are assumed to be independent. The linear regression slope, or sensitivity, of spring temperature to DE is −0.077 ±
0.067◦C d−1(figure3(B)). This sensitivity can be interpreted as a measure of the snow-temperature feedback. In other words, an earlier disappearance of snow cover by 1 d could result in an additional warming of monthly temperature of 0.077 ± 0.067◦C.
Likewise, in the fall (onset of snow) we found positive correlations between the onset date of snow cover (DO) and
the temperature during the month of snow onset (TO) in 98%
of the stations (statistically significant at 54% of the stations). In other words, a colder autumn coincides with an earlier snow onset. When we remove the effect of temperature during the month preceding snow onset (TO−1), the sensitivity of TOto
DO is 0.068 ± 0.051◦C d−1 (figure3(C)), a little smaller in
absolute value than the sensitivity of TM to DE (−0.077 ±
0.067◦C d−1). This result suggests a small feedback of snow cover on local temperature in autumn, a period of the year when the incoming solar radiation (the total amount of energy whose availability is controlled by albedo) is smaller than that in snowmelt season (spring).
In addition to temporal relationships at each site, we also found a negative (positive) correlation between trends in the end (onset) date of snow cover and trends in spring (autumn) temperature across the sites. We regressed the trends in TM (TO) against the trends in DE (DO) across the 575
stations, respectively (figure 4). The key result is that the trends in TM (TO) are negatively (positively) associated with
the trends in DE (DO) across the sites with R = −0.27,
P< 0.001 (R = 0.22, P < 0.001). After removing the effect of the trend in TM−1 (TO−1), there is still a significant
residual negative partial correlation between the trend in TM (TO) and the trend in DE (DO) across the stations
(R = 0.20, P < 0.001; R = −0.20, P < 0.001; figure4). The spatial sensitivity of temperature to DE (DO), given by the
linear slope between the TM (TO) and DE (DO) trend is
−0.007◦C d−1 (0.008◦C d−1), which is smaller than the temporal sensitivityestablished above (−0.077±0.067◦C d−1 for the sensitivity of TMto DEand 0.068 ± 0.051◦C d−1for
the sensitivity of TOto DO, respectively).
The sensitivity of TM (TO) to DE (DO) depends among
Environ. Res. Lett. 8 (2013) 014008 S Peng et al
Figure 4. Relationship between (A) trend in the onset date of snow cover (DO) (d yr−1) and trend in temperature during the month of snow onset (TO) (◦C yr−1) and between (B) trend in the end date of snow cover (DE) (d yr−1) and trend in temperature during the month of snowmelt (TM) (◦C yr−1) across 575 meteorological stations in the Northern Hemisphere. Red and green filled circles indicate meteorological stations from Eurasia (EA) and North America (NA), respectively.
(SW) radiation due to earlier snowmelt (later snow onset), which is the product of incoming SW radiation during snowmelt (snow onset) and the difference of albedo between snow free and snow covered surfaces. We quantified two important driving factors that are hypothesized to control the sensitivity of TM (TO) to DE (DO): short-wave incoming
radiation, and surface albedo. Firstly, we correlated the sensitivity of TMto DEto daily short-wave incoming radiation
across the 575 selected stations. Figure 5(A) shows that the sensitivity of TM to DE is significantly and negatively
correlated with incoming SW radiation at the end date of snow cover (R = −0.29, P < 0.001). Secondly, albedo is the other factor that can feedback on temperature during snowmelt as discussed in previous studies (Groisman et al 1994, Bony et al 2006, Hall and Qu 2006, Fernandes et al 2009, Qu and Hall2006, Flanner et al2011). An earlier disappearance of snow influences temperature locally by diminishing surface albedo, causing more incoming SW radiation to be absorbed by the surface (Hall and Qu2006). Here, we used albedo (black sky albedo (BSA)) from EOS-Terra-MODIS (MODerate-resolution Imaging Spectrometer) MCD43C3 version 5 products over the period 2001–2006 separated between snow free and snow cover (δBSA) to estimate the
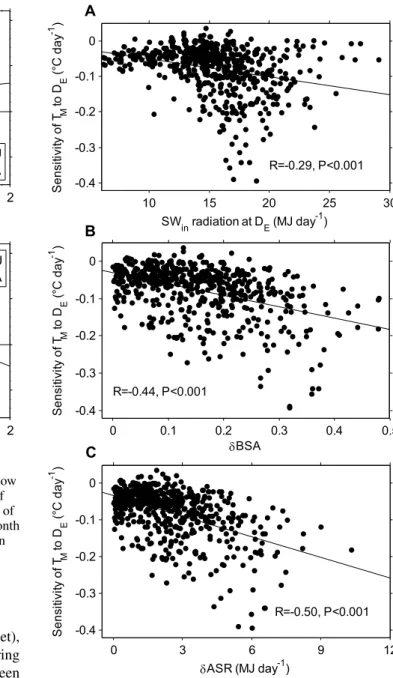
Figure 5. Relationship between the sensitivity of temperature during the month of snowmelt (TM) to the end date of snow cover (DE) and (A) incoming short-wave (SWin) radiation at DE, (B) the difference in albedo (black sky albedo (BSA)) before and after snowmelt (δBSA), and (C) the difference in absorbed short-wave radiation (ASR) after and before snowmelt at surface (δASR) across the 575 stations with matching albedo values from MODIS.
snow albedo change around the snowmelt (see section2and figure S1 available atstacks.iop.org/ERL/8/014008/mmedia). Figure 5(B) shows the relationship between the temporal sensitivity of TM to DE (see above) and δBSA across the
575 stations for which there is matching albedo data over the period 2001–2006 (R = −0.44, P < 0.001). We found that the temporal sensitivity of TM to DE is significantly
and negatively correlated with both incoming SW radiation andδBSA, verifying the larger difference in absorbed energy before and after snowmelt associated with larger snow albedo feedback on temperature (figures 5(A) and (B)). We took the product of incoming SW radiation by δBSA to present
the extra absorbed energy by surface because of change in DE(δASR), which exhibited a stronger relationship with the
temporal sensitivity of TM to DE (R = −0.50, P < 0.001)
than that using incoming SW radiation orδBSA alone (R = −0.29, P < 0.001; R = −0.44, P < 0.001).
In addition, the temporal sensitivity of TO to DO is
much less correlated with incoming SW radiation during snow onset andδASR (R = −0.21, P < 0.001; R = 0.06, P = 0.121; figure S2 available at stacks.iop.org/ERL/8/014008/ mmedia). This may be related to the smaller incoming SW radiation during snow onset season (incoming SW radiation in 97% of stations smaller than 10 MJ d−1) and δASR is limited (δASR in 97% of stations smaller than 2 MJ d−1). However, the incoming SW radiation during snowmelt season (spring) exceeds 10 MJ d−1 over most of the stations and δASR exceeds 2 MJ d−1 over 51% of the stations. The
albedo also has influence on the sensitivity of TOto DO, but
the explanation is limited (R = 0.30, P < 0.001; figure S2 available atstacks.iop.org/ERL/8/014008/mmedia).
The average temporal sensitivity in temperate regions (south of 50◦N) (−0.059 ± 0.055◦C d−1, n = 358) is larger
than that in boreal regions (north of 50◦N) (−0.106 ± 0.075◦C d−1, n = 217) (P< 0.001). This may be related to the fact that a higher incoming SW radiation could be available during snowmelt in boreal regions (16.1 ± 4.1 MJ d−1) than in temperate regions (14.5 ± 3.8 MJ d−1) over NH (P< 0.001), considering the later snowmelt date in higher latitude (figure S3 available atstacks.iop.org/ERL/8/014008/ mmedia) (Choi et al 2010). In addition, δBSA in boreal regions (0.17 ± 0.10) is also higher than that in temperate regions (0.14±0.1). This could explain why the magnitude of snow albedo feedback is larger in the high latitude region over NH (Serreze and Francis2006, Chapin et al2005, Euskirchen et al2007, Bony et al2006).
At Barrow station (latitude is about 70◦N), Stone et al (2002) found that temperature in June increased by 0.9◦C when snowmelt date advanced by 14 d (table 2 in their paper). In other words, the sensitivity of temperature to DE
is −0.064◦C d−1at this site, which is a little smaller than the average result (−0.092 ± 0.054◦C d−1) at 12 stations located between 69◦N and 71◦N in this study. Based on the seasonal cycles of satellite-derived albedo and air temperature, the sensitivity of surface albedo to temperature was estimated as −0.93 ± 0.06% K−1and −1.06 ± 0.08% K−1in Fernandes et al(2009) and Hall and Qu (2006) over the regions north of 30◦N, respectively. In this study, the sensitivity of surface albedo to air temperature is estimated as the product of the sensitivity of DE to temperature by δBSA of −0.90 ±
0.86% K−1. In terms of radiative forcing, we used the product of sensitivity of DE(DO) to temperature byδASR as
the magnitude of snow albedo feedback, which are 0.13 ± 0.13 W m−2K−1and 0.06 ± 0.09 W m−2K−1in spring and autumn, respectively. The total annual snow albedo feedback (spring plus autumn) over the land of Northern Hemisphere found in this study is 0.19 ± 0.17 W m−2K−1, while the total cryosphere albedo feedbacks including snow and ice over NH was estimated to lie in the range of 0.3–1.1 W m−2K−1from satellite observation, and to average at 0.25±0.17 W m−2K−1
from 18 CMIP3 climate models (IPCC 2007, Flanner et al
2011). The estimate of our study, based on in situ records is comparable to these earlier estimates, although our results only include the local albedo feedback and are limited to the amount of in situ stations and their spatial distribution. The uncertainty in our estimate is larger, however, because it includes the variation across the 575 stations.
In this study, we used the extra absorbed energy at surface due to earlier snow disappearance (later snow onset) to explain the magnitude of the sensitivity of temperature to the end (onset) date of snow cover, assuming that the sensible heat flux allocation is related to absorbed energy at surface. Actually, earlier snowmelt can impact air temperature through changing the hydrological cycle. Snowmelt increases surface runoff in the beginning of the snowmelt period, but earlier snowmelt potentially leads to decreased soil water availability by the end of the snowmelt period (Hamlet et al 2005), particularly if frozen soils prevent snowmelt from recharging the soil moisture reservoir (Dunne runoff) (Dunne and Black
1970). As a consequence, an increase in the exchange of sensible heat between the earth surface and the atmosphere is expected; this will further contribute to an increase in TM
(Seneviratne et al2006, Tchebakova et al2002, Chapin et al
2008). In addition, we did not consider the cloud variation which could impact the solar radiation at the surface, and then impact the snow albedo feedback (Bony et al2006, Qu and Hall 2006, Flanner et al2011). More complex drivers such as sensible and latent heat flux allocation and cloud impacts on the snow albedo feedback should be included in future modeling studies.
4. Conclusions
From 1980 to 2006, at the continental scale, the end date of snow cover over the last 27 years shows a rapid advance for Eurasia (−2.6 ± 5.6 d decade−1) and virtually no trend for North America (0.1 ± 5.8 d decade−1). The onset date of the first snow cover shows a trend towards later dates in both Eurasia (1.3 ± 4.9 d decade−1) and North America (1.1 ± 4.9 d decade−1). The differences in snow cover trends between North America and Eurasia are associated with local temperature trends. By the end of this century, a global increase in surface air temperature will result from increasing concentrations of greenhouse gases in the atmosphere (IPCC
2007). Our analyses of available records from meteorological stations indicate that snow cover in the NH is very sensitive to rising temperature, and that there could be a positive feedback of snow cover change to spring temperature. When we apply this empirical sensitivity of temperature to snow disappearance date (−0.077◦C d−1) to the average observed
trend in snow disappearance date (−1.3 d decade−1) across the 575 stations where at least 20 years of daily snow cover and air temperature data are available from 1980 to 2006, we predict a contribution of snow cover feedback to spring warming to be 0.10◦C decade−1. This rate accounts for 32% of the observed linear trend in spring temperature from 1980 to 2006 (0.31◦C decade−1). Furthermore, applying the future northern land surface (north of 30◦N) spring warming of
Environ. Res. Lett. 8 (2013) 014008 S Peng et al
1.0–5.3◦C predicted by IPCC climate models to the average temperature sensitivity of the end date of snow cover observed in this study (1.6 d◦C−1) gives a projected advance of 1.6–8.5 d by the end of this century, which will probably further amplify spring warming by 0.12–0.65◦C. Note that this does not account for further atmospheric circulation feedbacks. Our observational estimate of the snow-temperature feedback may contain very useful information that can be used to evaluate coupled land surface–atmosphere models, and to improve the quantification of snow–climate feedbacks.
Acknowledgments
We thank Dr Olga N Bulygina for the Russian meteorological station datasets and Dr J H Gash for English language editing. This study was supported by the National Natural Science Foundation of China (grant 41125004 and 30970511), and CARBONES EU F7 foundation (242316).
References
Bony S et al 2006 How well do we understand and evaluate climate change feedback processes J. Clim.19 3445–82
Brown R D and Robinson D A 2011 Northern Hemisphere spring snow cover variability and change over 1922–2010 including an assessment of uncertainty Cryosphere5 219–29
Bulygina O N, Groisman P Y, Razuvaev V N and
Korshunova N N 2011 Changes in snow cover characteristics over Northern Eurasia since 1966 Environ. Res. Lett.6 045204
Chapin F S et al 2005 Role of land-surface changes in Arctic summer warming Science310 657–60
Chapin F S, Randerson J T, McGuire A D, Foley J A and Field C B 2008 Changing feedbacks in the climate–biosphere system Front. Ecol. Environ.6 313–20
Choi G, Robinson D A and Kang S 2010 Changing Northern Hemisphere snow seasons J. Clim.23 5305–10
Dee D P et al 2011 The ERA-Interim reanalysis: configuration and performance of the data assimilation system Q. J. R. Meteorol. Soc.137 553–97
D´ery S J and Brown R D 2007 Recent Northern Hemisphere snow cover extent trends and implications for the snow–albedo feedback Geophys. Res. Lett.34 L22504
Dunne T and Black R D 1970 Partial area contributions to storm runoff in a small New England watershed Water Resour. Res.
6 1296–311
Dye D G 2002 Variability and trends in the annual snow-cover cycle in Northern Hemisphere land areas, 1972–2000 Hydrol. Process.16 3065–77
Euskirchen E S, McGuire A D and Chapin F S III 2007 Energy feedbacks of northern high-latitude ecosystems to the climate system due to reduced snow cover during 20th century warming Glob. Change Biol.13 2425–38
Fernandes R, Zhao H, Wang X, Key J, Qu X and Hall A 2009 Controls on Northern Hemisphere snow albedo feedback quantified using satellite Earth observations Geophys. Res. Lett.36 L21702
Flanner M G, Shell K M, Barlage M, Perovich D K and Tschudi M A 2011 Radiative forcing and albedo feedback from the Northern Hemisphere cryosphere between 1979 and 2008 Nature Geosci.4 151–5
Grippa M, Kergoat L, Le Toan T, Mognard N M, Delbart N, L’Hermitte J and Vicente-Serrano S M 2005 The impact of snow depth and snowmelt on the vegetation variability over central Siberia Geophys. Res. Lett.32 L21412
Groisman P Y, Karl T R and Knight R W 1994 Observed impact of snow cover on the heat balance and the rise of continental spring temperatures Science263 198–200
Hall A and Qu X 2006 Using the current seasonal cycle to constrain snow albedo feedback in future climate change Geophys. Res. Lett.33 L03502
Hamlet A F, Mote P W, Clark M P and Lettenmaier D P 2005 Effects of temperature and precipitation variability on snowpack trends in the western United States J. Clim.
18 4545–61
IPCC 2007 Climate Change 2007: The Physical Science Basis (Cambridge: Cambridge University Press)
Jonas T, Rixen C, Sturm M and Stoeckli V 2008 How alpine plant growth is linked to snow cover and climate variability J. Geophys. Res.113 G03013
Jeong S-J, Ho C-H, Gim H-J and Brown M E 2011 Phenology shifts at start vs. end of growing season in temperate vegetation over the Northern Hemisphere for the period 1982–2008 Glob. Change Biol.17 2385–99
Kapnick S and Hall A 2010 Observed climate-snowpack
relationships in california and their implications for the future J. Clim.23 3446–56
Liu J, Schaaf C, Strahler A, Jiao Z, Shuai Y, Zhang Q, Roman M, Augustine J A and Dutton E G 2009 Validation of moderate resolution imaging spectroradiometer (MODIS) albedo retrieval algorithm: dependence of albedo on solar zenith angle J. Geophys. Res.114 D01106
McDonald K C, Kimball J S, Njoku E, Zimmermann R and Zhao M S 2004 Variability in springtime thaw in the terrestrial high latitudes: monitoring a major control on the biospheric assimilation of atmospheric CO2with spaceborne microwave remote sensing Earth Interact.8 1–23
Monson R K, Lipson D L, Burns S P, Turnipseed A A, Delany A C, Williams M W and Schmidt S K 2006 Winter forest soil respiration controlled by climate and microbial community composition Nature439 711–4
Peng S S, Piao S L, Ciais P, Fang J Y and Wang X H 2010 Change in winter snow depth and its impacts on vegetation in China Glob. Change Biol.16 3004–13
Piao S L et al 2008 Net carbon dioxide losses of northern
ecosystems in response to autumn warming Nature451 49–52
Qu X and Hall A 2006 Assessing snow albedo feedback in simulated climate change J. Clim.19 2617–30
Robinson D A 1993 Hemispheric snow cover from satellites Annals Glaciol.17 367–71
Schaaf C B et al 2002 First operational BRDF, albedo nadir reflectance products from MODIS Remote Sens. Environ.
83 135–48
Seneviratne S I, Luthi D, Litschi M and Schar C 2006 Land–atmosphere coupling and climate change in Europe Nature443 205–9
Serreze M C and Francis J A 2006 The arctic amplification debate Clim. Change76 241–64
Smith N V, Saatchi S S and Randerson J T 2004 Trends in high northern latitude soil freeze and thaw cycles from 1988 to 2002 J. Geophys. Res.109 D12101
Stewart I T, Cayan D R and Dettinger M D 2005 Changes toward earlier streamflow timing across western North America J. Clim.18 1136–55
Stone R S, Dutton E G, Harris J M and Longenecker D 2002 Earlier spring snowmelt in northern Alaska as an indicator of climate change J. Geophys. Res.107 4089
Takala M, Pulliainen J, Metsamaki S J and Koskinen J T 2009 Detection of snowmelt using spaceborne microwave radiometer data in Eurasia from 1979 to 2007 IEEE Trans. Geosci. Remote Sens.47 2996–3007
Tchebakova N M, Kolle O, Zolotoukhine D, Arneth A, Styles J M, Vygodskaya N N, Schulze E D, Shibistova O and Lloyd J 2002
Inter-annual and seasonal variations of energy and water vapour fluxes above a Pinus sylvestris forest in the Siberian middle taiga Tellus54 537–51
Tucker C J, Slayback D A, Pinzon J E, Los S O, Myneni R B and Taylor M G 2001 Higher northern latitude normalized difference vegetation index and growing season trends from 1982 to 1999 Int. J. Biometeorol.45 184–90
Weatherhead E C et al 1998 Factors affecting the detection of trends: statistical considerations and applications to environmental data J. Geophys. Res.103 17149–61
Zhou L M, Tucker C J, Kaufmann R K, Slayback D,
Shabanov N V and Myneni R B 2001 Variations in northern vegetation activity inferred from satellite data of vegetation index during 1981 to 1999 J. Geophys. Res.106 20069–83