HAL Id: hal-00987218
https://hal.archives-ouvertes.fr/hal-00987218
Submitted on 26 Sep 2017
HAL is a multi-disciplinary open access archive for the deposit and dissemination of sci-entific research documents, whether they are pub-lished or not. The documents may come from teaching and research institutions in France or abroad, or from public or private research centers.
L’archive ouverte pluridisciplinaire HAL, est destinée au dépôt et à la diffusion de documents scientifiques de niveau recherche, publiés ou non, émanant des établissements d’enseignement et de recherche français ou étrangers, des laboratoires publics ou privés.
A Technosol as archives of organic matter related to
past industrial activities
Hermine Huot, Pierre Faure, Coralie Biache, Catherine Lorgeoux, Marie-Odile
Simonnot, Jean-Louis Morel
To cite this version:
Hermine Huot, Pierre Faure, Coralie Biache, Catherine Lorgeoux, Marie-Odile Simonnot, et al.. A Technosol as archives of organic matter related to past industrial activities. Science of the Total Environment, Elsevier, 2014, 487 (2014), pp.389-398. �10.1016/j.scitotenv.2014.04.047�. �hal-00987218�
1 SCIENCE OF THE TOTAL ENVIRONMENT 487(2014)389–398
A Technosol as archives of organic matter
related to past industrial activities
Hermine Huota,b,c,d, Pierre Fauree,f, Coralie Biachee,f, Catherine Lorgeouxg,h, Marie-Odile Simonnotc,d, Jean Louis Morela,b
a
Université de Lorraine, Laboratoire Sols et Environnement, UMR 1120, 2, avenue de la Forêt de Haye, TSA 40602, 54518 Vandœuvre-lès-Nancy cedex, France
b
INRA, Laboratoire Sols et Environnement, UMR 1120, 2 avenue de la Forêt de Haye, TSA 40602, 54518 Vandœuvre-lès-Nancy cedex, France
c
Université de Lorraine, Laboratoire Réactions et Génie des Procédés, UMR 7274, 1 rue Grandville, BP 20451, 54001 Nancy cedex, France
d
CNRS, Laboratoire Réactions et Génie des Procédés, UMR 7274, 1 rue Grandville, BP 20451, 54001 Nancy cedex, France
e
Université de Lorraine, Laboratoire Interdisciplinaire des Environnements Continentaux, UMR 7360, Faculté des Sciences et Techniques - Campus des Aiguillettes BP 70239, 54506 Vandœuvre-lès-Nancy, France
f
CNRS, Laboratoire Interdisciplinaire des Environnements Continentaux, UMR 7360, Faculté des Sciences et Techniques - Campus des Aiguillettes BP 70239, 54506 Vandœuvre-lès-Nancy, France
g
Université de Lorraine, GéoRessources, UMR 7359, Faculté des Sciences et Techniques - Campus des Aiguillettes BP 70239, 54506 Vandœuvre-lès-Nancy, France
h
CNRS, GéoRessources, UMR 7359, Faculté des Sciences et Techniques - Campus des Aiguillettes BP 70239, 54506 Vandœuvre-lès-Nancy, France
Email addresses: hermine.huot@univ-lorraine.fr pierre.faure@univ-lorraine.fr catherine.lorgeoux@univ-lorraine.fr coralie.biache@univ-lorraine.fr marie-odile.simonnot@univ-lorraine.fr jean-louis.morel@univ-lorraine.fr Corresponding author: Marie-Odile Simonnot
Laboratoire Réactions et Génie des Procédés (LRGP) Université de Lorraine - CNRS (UMR 7274)
1, rue Grandville BP20451 F-54001 Nancy Cedex France
Email : marie-odile.simonnot@univ-lorraine.fr Tel : +33(0)383 175 260
2 Abstract
To better understand formation, functioning and evolution of a Technosol developing on a former settling pond of iron industry under forest cover, organic matter (OM) of layers along the soil profile was investigated. Spectroscopic and molecular analyses of extractable OM gave information on OM origin and state of preservation. In the surface layer, OM fingerprints indicated fresh input from vegetation while they revealed well preserved anthropogenic compounds related to industrial processes in deeper layers. OM variability and distribution according to the layers recorded deposition cycles of industrial effluents into the pond. Thus, the Technosol can be considered as archives of past industrial activities. The preservation of anthropogenic OM could be connected with mineralogy, high metal contents and particular physical properties of the Technosol.
Keywords: organic matter, biomarkers, anthropogenic, preservation, Technosol
Highlights
The Technosol profile showed a strong variability of OM quantity and composition.
Anthropogenic OM was well preserved and recorded deposition cycles into the pond.
OM preservation could be due to minerals, metal contents and physical properties.
The Technosol can be considered as archives of OM produced by industrial activities.
3 1. Introduction
Human activities leave their marks in all environment compartments (atmosphere, biosphere, and hydrosphere). Global and local changes induced by human activities can be recorded over time in environmental archives (e.g. sediments, ice, peat bogs). Sedimentary records can be archives of land use changes in watershed (Bertrand et al., 2012) and their associated contaminations, reflecting impacts of industrialization (Schindler and Kamber, 2013) or regulations and technological developments (Charles and Hites, 1987), as shown in the Seine river basin (Meybeck et al., 2007; Le Cloarec et al., 2011).
Industrial activities have generated by-products, which have often been stored on industrial sites (e.g. slag heaps, settling ponds). After industry closure, these industrial deposits remain as testimony of industrial past and can serve as environmental archives of industrial impact (Hutchinson, 2003). In brownfield sites, these technogenic materials are subjected to environmental factors, climate and biological activity when organisms have colonized industrial sites, leading to the formation of Technosols (IUSS Working Group WRB, 2006). Little is known about the pedogenetic evolution of these soils, although their constitutive industrial materials may contain potentially toxic compounds such as heavy metals or persistent organic pollutants. A better understanding of the pedogenetic processes occurring in these Technosols would provide information on the impact of these compounds in surrounding environments.
In these soils, organic matter (OM) is often a complex mixture of anthropogenic compounds related to industrial processes and natural recent OM. Preservation, degradation and fate of organic compounds in ecosystems mainly depend on their chemical structure, (bio)availability and mobility which are related to sorption phenomena onto inorganic and organic soil components and soil physical properties. Under some conditions (e.g. sorption and mineral-bound protection, low microbial degradation), anthropogenic OM was preserved, and can be used as archives of the past human activities (Coulon et al., 2013; Pernot et al., 2013).
In order to better understand the formation, functioning and evolution of Technosols, a former settling pond of iron and steel industry, colonized by vegetation, was thoroughly characterized. It contained mainly blast furnace sludge, resulting from the wet cleaning of dusty blast furnace top gas. Dusts were composed of fine particles from ore, coke and fluxstones carried by the gas as well as particles formed by condensation of elements volatilized at high temperature at the bottom of blast furnace (Truffaut, 1989). Due to its high Zn, Pb and alkali metals contents damaging the blast furnace functioning, this sludge could not be recycled and was often dumped into settling ponds (Mansfeldt and Dohrmann, 2004). Other by-products were generated during the iron and steel-making processes, such as oily and greasy sludge containing hydrocarbons from rolling mill (Raguin, 1992). This former settling pond has been evolving under the influence of climatic and biologic factors for at least 50 years.
In relation to its composition as well as its chemical and physical properties, the soil developing on this material can be classified as a Spolic Technosol (Calcaric, Laxic,
4 Hydric, Thixotropic, Andic, Toxic) according to WRB (IUSS Working Group WRB, 2006) (Huot et al., 2013). The analyses of mineralogy and soil structure at different scales, combined with the knowledge of industrial operations have evidenced deposition cycles along the profile as well as early processes of mineral transformation and solute transfer. These processes were driven firstly by drying-wetting cycles and then by biological activity (Huot et al., 2014).
In parallel, the Technosol OM was characterized by using organic geochemistry tools on the extractable fraction with global to molecular analyses. Molecular marker approach provides information on the origin and the degradation rate of organic compounds (Tissot and Welte, 1984; Hunt, 1996; Peters et al., 2005). It is based on the ability for some organic molecules, called biomarkers, to be source specific and to be preserved over time (Eganhouse, 1997). The occurrence and the relative abundance of biomarkers, expressed by specific ratios, allow to differentiate anthropogenic from natural organic inputs and to determine the source apportionment of anthropogenic OM in relation to human activities, using petrogenetic, pyrogenetic or sewage water markers. For example, natural markers include molecules synthetized by plants and/or microorganisms (e.g. sterols, alcohols, acids) whereas petrogenetic markers are molecules coming from the use of fossil OM (e.g. fuel, lubricant, grease, road asphalt), including n-alkanes, triterpanes, isoprenoids or steranes (Jeanneau et al., 2008a; 200 8b). The biomarker approach is used to characterize organic contamination and its evolution in soils and sediments (e.g. Faure et al., 2000; Faure et al., 2007; Badin et al., 2008; Bloundi et al., 2008; Kèlomè et al., 2012). Radiocarbon analysis validated this quantitative multimolecular marker approach as an efficient tool to quantify fossil OM in contaminated river sediments (Jeanneau and Faure, 2010).
In this study, composition and variability of organic matter along the Technosol profile was investigated through spectroscopic and molecular analyses of the extractable organic fraction. Main objectives were:
1) to track the origin (anthropogenic versus natural) and the distribution of organic compounds and to compare them with information about the formation of the Technosol obtained by mineralogy and soil structure analyses ;
2) to assess the OM preservation rate and to connect it to the mineral composition and the properties of the Technosol.
2. Materials and methods
2.1. Presentation of the studied site
The studied site was a former settling pond of the iron and steel complex in Pompey-Frouard-Custines (Lorraine, France). It produced a large range of pig iron and steels from 1872 to 1986, date of the closure of the industry. Its worldwide reputation was achieved through the production of puddled iron used to build the Eiffel tower. This settling pond is located on an island at the confluence of the Meurthe and the Moselle
5 rivers. It occupies 2.6 ha and deposit is ca. 10-m deep. The pond was filled progressively by successive sludge supplies until probably the 1950s, generating a stratified deposit. After the suspension of sludge dumping, vegetation has colonized the pond, which is nowadays covered by a diversified deciduous forest.
2.2. Profile and sampling description
Soil profile was described and characterized in a 2-m deep pit, opened in June 2009 in the north-western part of the pond. The profile displayed an alternation of dark layers with a crumbly structure and of light layers with a laminar compacted structure and a 15 to 20 cm-thick organo-mineral horizon has developed at the surface (Huot et al., 2014). Roots occurred all along the 2-m deep profile with areas of preferential development. After removing the litter on the soil surface, the organo-mineral horizon and 11 contrasted deeper layers were sampled along the profile in May 2010 (Figure 1). For each layer, one sample of 1-1.5 kg of field-wet soil was collected, of which half was freeze-dried for chemical and OM analysis.
Figure 1 Localization of sampled layers along the Technosol profile
6 2.3. Quantification of OM content
OM content was assessed by the total organic carbon (TOC), calculated by removing the inorganic carbon from the total C. Total C was determined by dry combustion (NF ISO 10694) and total carbonates by calcimetry (NF ISO 10693) by the Laboratoire d’Analyse des Sols (INRA, Arras, France). Contents were expressed with respect to freeze-dried soils.
2.4. OM extraction
Extractable organic matter (EOM) was collected from aliquots (5-10 g) of the freeze-dried samples of the 12 layers, after crushing the soils at 500 µm. EOM was obtained from two successive extractions by methylene chloride (DCM) with an extractor (Dionex ASE 200) at 130 °C under 130 bars (Li et al., 2002; Jeanneau et al., 2008b; Bertrand et al., 2012). Prior to the extraction, 5 g of activated copper powder and 1 g of sodium sulfate were added in extraction cells to remove elemental sulfur and the remaining water from soil sample, respectively. Extracts were diluted with DCM to reach 5 or 10 mL according to the samples. The extraction rate was determined by weighing the dry extract obtained after solvent evaporation under N2 flow.
2.5. Gel Permeation Chromatography-High Performance Liquid Chromatography (GPC-HPLC)
The molecular mass distribution of EOM was assessed by Gel Permeation Chromatography-High Performance Liquid Chromatography (GPC-HPLC). Dry EOMs were diluted in tetrahydrofuran (THF) stabilized with 0.025% of BHT (3,5-di-tert.-butyl-4-hydroxytoluene) at 0.69 mg mL-1 Aliquots of 50 µL were injected into an HPLC (Hewlett Packard) equipped with a column PLgel Mixed-E (Varian) and a diode array detector (DAD G1315A – HP Series 1100) to measure absorbance at a wavelength of 254 nm. Analyses were carried out with an eluent (THF) flow rate of 1 mL min-1 and under a temperature of 23 °C. Calibration was performed with a polystyrene standard solution (Easycal PS-L Polystyrene Kit, Varian) for a molecular mass range of 162-38,600 Da (Blanchart et al., 2012). This calibration permits to obtain distribution of molecular mass of organic compounds, despite the possible bias induced by the different structure of natural, anthropogenic OM and polystyrene.
2.6. Infrared spectroscopy (IFTS)
Functional analyses were carried out by infrared Fourier transform spectroscopy (IFS 55 Bruker) coupled to microscopy (Multipurpose Bruker IR with MCT detector cooled with liquid nitrogen) on the dry EOMs (Faure et al., 1999; Benhabib et al., 2010; Usman et al., 2012).
7 2.7. Gas Chromatography coupled to Mass Spectrometry (GC-MS)
Qualitative and quantitative analyses were conducted on the EOM by capillary gas chromatography coupled to mass spectrometry (GC-MS) to identify organic molecules, particularly biomarkers (Faure et al., 2000; Jeanneau et al., 2008a; 2008b; Biache et al., 2011; Bertrand et al., 2012). For the qualitative series, dry extracts (500 µL of EOM) were solubilized in 250 µL of DCM and 250 µL of BSTFA (N, O bis(trimethylsilyl)trifluoroacetamide) and heated at 60°C during 15 min to activate the silylation, before being injected into a GC (Agilent Technology 6890 N) coupled to a MS (Agilent Technology 5973 Inert Mass Selective Detector). Aliphatic (n-alkanes from n-C11 to n-C40 including pristane (Pr) and phytane (Ph)) and aromatic compounds (the 16 polycyclic aromatic hydrocarbons (PAHs) of the US-EPA list) were quantified. Internal standards (50 µL) containing four perdeuterated n-alkanes: [2H34]n-hexadecane, [2H42]n-eicosane, [2H50]n-tetracosane and [2H62]n-triacontane and five perdeuterated PAHs: [2H8]naphthalene, [2H10]acenaphthene, [2H10]phenanthrene, [2H12]chrysene, [2H12]perylene (supplied by Cluzeau®, were added to 150 µL of EOM before being injected into a GC-MS (GC-2010 plus gas chromatograph and QP2012 Ultra mass spectrometer Shimadzu). All the quantification results were expressed with respect to the freeze-dried soils. Compounds not resolved by the chromatographic column generated a broad hump in the baseline of chromatograms, called unresolved complex mixtures (UCM; Gough and Rowland, 1990). Its area was estimated by subtracting the total area of resolved peaks from the total detector response.
3. Results
3.1. Global analysis of OM
Global analyses on bulk soil revealed that the quantity and the nature of the OM were variable along the Technosol profile (Table 1).
TOC contents reached high value in the surface layer (108 g kg-1) while they were lower in the deeper layers. They ranged from 30 to 60 g kg-1 in layers 2, 4, 11 and 12 and from 10 to 20 g kg-1 in layers 3, 9 and 10. They were very low (4-5 g kg-1) in consecutive layers 5-8.
OM can be subdivided into EOM and an insoluble fraction. When related to TOC, the EOM rate was rather low in most layers, except in layer 4, in which it represented 80% of TOC. It was lower than 30 % of TOC in layers 5, 7, 9, 11 and 12 and lower than 10% of TOC in layers 1-3, 6, 8 and 10.
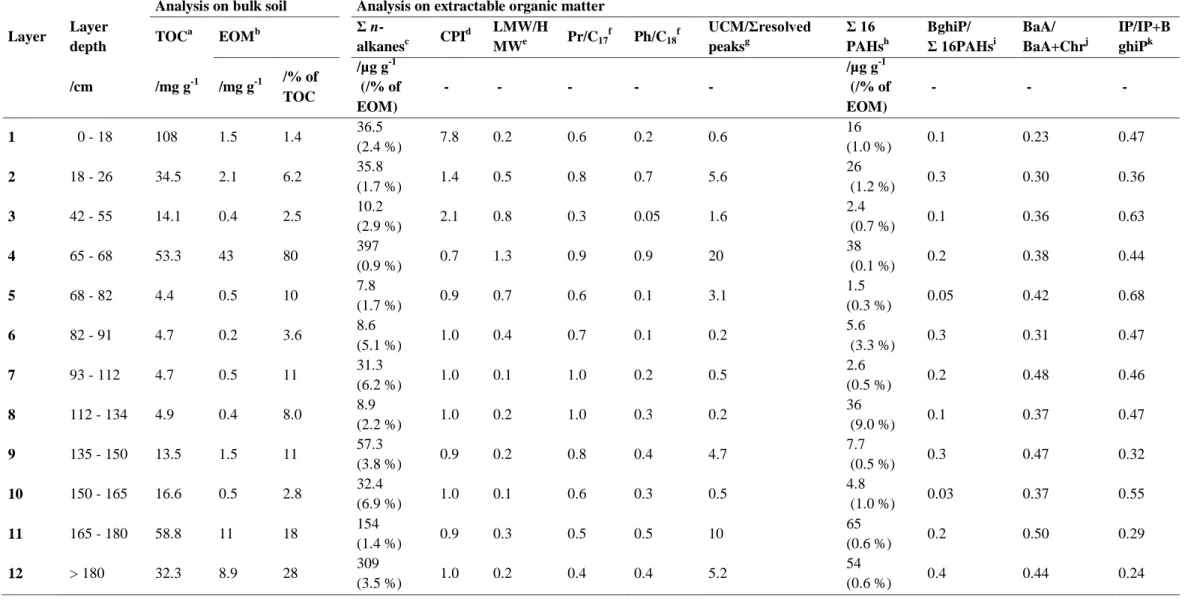
8 Table 1 Quantitative characterization of organic matter of 12 layers along the profile of the Technosol
Analysis on bulk soil Analysis on extractable organic matter Layer Layer depth TOC a EOMb Σ n-alkanesc CPI d LMW/H MWe Pr/C17 f Ph/C18f UCM/Σresolved peaksg Σ 16 PAHsh BghiP/ Σ 16PAHsi BaA/ BaA+Chrj IP/IP+B ghiPk /cm /mg g-1 /mg g-1 /% of TOC /µg g-1 (/% of EOM) - - - - - /µg g-1 (/% of EOM) - - - 1 0 - 18 108 1.5 1.4 36.5 (2.4 %) 7.8 0.2 0.6 0.2 0.6 16 (1.0 %) 0.1 0.23 0.47 2 18 - 26 34.5 2.1 6.2 35.8 (1.7 %) 1.4 0.5 0.8 0.7 5.6 26 (1.2 %) 0.3 0.30 0.36 3 42 - 55 14.1 0.4 2.5 10.2 (2.9 %) 2.1 0.8 0.3 0.05 1.6 2.4 (0.7 %) 0.1 0.36 0.63 4 65 - 68 53.3 43 80 397 (0.9 %) 0.7 1.3 0.9 0.9 20 38 (0.1 %) 0.2 0.38 0.44 5 68 - 82 4.4 0.5 10 7.8 (1.7 %) 0.9 0.7 0.6 0.1 3.1 1.5 (0.3 %) 0.05 0.42 0.68 6 82 - 91 4.7 0.2 3.6 8.6 (5.1 %) 1.0 0.4 0.7 0.1 0.2 5.6 (3.3 %) 0.3 0.31 0.47 7 93 - 112 4.7 0.5 11 31.3 (6.2 %) 1.0 0.1 1.0 0.2 0.5 2.6 (0.5 %) 0.2 0.48 0.46 8 112 - 134 4.9 0.4 8.0 8.9 (2.2 %) 1.0 0.2 1.0 0.3 0.2 36 (9.0 %) 0.1 0.37 0.47 9 135 - 150 13.5 1.5 11 57.3 (3.8 %) 0.9 0.2 0.8 0.4 4.7 7.7 (0.5 %) 0.3 0.47 0.32 10 150 - 165 16.6 0.5 2.8 32.4 (6.9 %) 1.0 0.1 0.6 0.3 0.5 4.8 (1.0 %) 0.03 0.37 0.55 11 165 - 180 58.8 11 18 154 (1.4 %) 0.9 0.3 0.5 0.5 10 65 (0.6 %) 0.2 0.50 0.29 12 > 180 32.3 8.9 28 309 (3.5 %) 1.0 0.2 0.4 0.4 5.2 54 (0.6 %) 0.4 0.44 0.24
9 a
TOC: content of total organic carbon b
EOM: content of extractable organic matter by organic solvent (dichloromethane) cΣ n-alkanes : sum of n-alkanes from n-C
11 to n-C40 including pristane (Pr) and phytane (Ph) d
CPI: Carbon Preference Index calculated as
CPI = 1/2 × [((C25+C27+C29+C31+C33)/(C24+C26+C28+C30+C32))+((C25+C27+C29+C31+C33)/(C24+C26+C28+C30+C32+C34))] with Cx: n-alkane with x carbons (Bray and Evans, 1961)
e
LMW/HMW: ratio of low molecular weight n-alkanes (LMW) by high molecular weight n-alkanes (HMW), calculated as Σ n-alkanesn≤20+pristane+phytane/ Σ n-alkanesn≥21 f
Pr/C17 andPh/C18 are the ratios of pristane content by n-C17 alkane content and phytane content by n-C18 alkane content, respectively. g
UCM/Σ(resolved peaks): estimation of Unresolved Complex Mixture (UCM) area divided by the total area of resolved peaks hΣ 16 PAHs: sum of the 16 polycyclic aromatic hydrocarbons (PAHs) of the US-EPA list
i
BghiP/Σ 16 PAHs: ratio of benzo[ghi]perylene concentration by sum of the 16 PAHs of the US-EPA list
j
BaA/BaA+Chr: specific PAH ratio of benzo[a]anthracene (BaA) and chrysene (Chr) contents used to trace source apportionment. BaA/BaA+Chr ratios <0.20 imply petroleum, from 0.2 to 0.35 indicate either petroleum or combustion and >0.35 imply combustion (Yunker et al., 2002).
k
IP/IP+BghiP: specific PAH ratio of indeno[1, 2,3-cd]pyrene (IP) and benzo[ghi]perylene (BghiP) contents used to trace source apportionment. IP/IP+BghiP ratios <0.20 imply petroleum, from 0.2 to 0.5 liquid fossil fuel combustion and >0.35 imply grass, wood and coal combustion (Yunker et al., 2002).
10 3.2. Molecular mass distribution (GPC)
Molecular mass distribution of EOM varied along the soil profile (Figure 2). In the surface layer, the distribution was dominated by low molecular mass compounds (< 50 Da) with a peak around 10 Da (Peak a). This peak was also present in the mass distribution of layers 2, 3, 6-10 and, to a lesser extent, in layer 5, along with a contribution of heavier compounds. The mass distribution of layers 3, 5, 7, 8, 10 and, to a lesser extent, layers 6 and 9 showed narrow peaks around 85-100 Da (Peak b) and 1100-1200 Da (Peak d). The distribution of layer 4 was dominated by compounds with a mass around 120 Da. Deeper layers (11 and 12) had similar mass distribution with a predominant contribution of compounds with a molecular mass around 425-450 Da (Peak c). This contribution occurred also on the distribution of layers 8 and 9.
Figure 2 Molecular mass distribution of extractable organic matter obtained by HPLC-GPC for the 12 layers sampled along the Technosol profile
Each curve represented the absorbance, normalized by the maximum of each distribution and expressed in %, as a function of the molecular mass. Shaded areas referenced from a to d highlighted peaks in mass distributions.
11 3.3. Spectroscopic analyses (FTIR)
Functional analyses, obtained by FTIR spectroscopy, showed that EOM was dominated by aliphatic compounds. In fact, CHali stretching bands (3000-2800 cm-1) and CHali twisting bands (1470-1440 cm-1) of aliphatic compounds were detected in all the layers as well as r(CH2)n, n>4 vibration (720 cm-1) in most of layers (Figure 3).
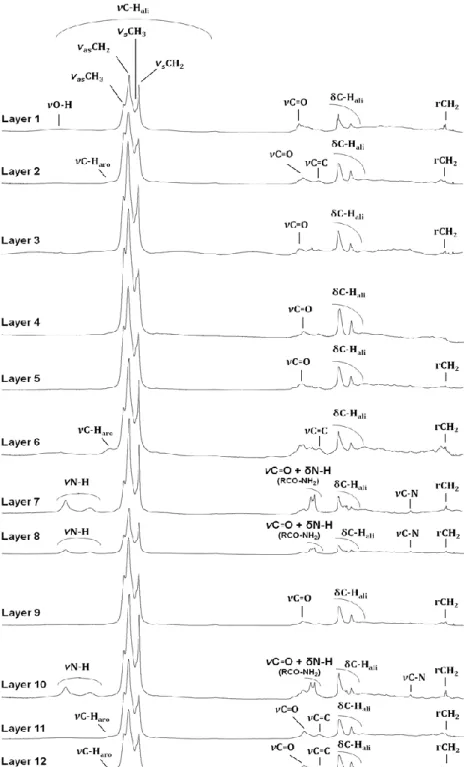
Figure 3 FTIR spectra of extractable organic matter for the 12 layers sampled along the Technosol profile νC-Hali: C-H stretching bands of aliphatic compounds; νs: symmetrical stretching; νas: antisymmetrical stretching; δC-Hali: C-H twisting bands of aliphatic compounds; rCH2: (CH2)n, n>4 rocking bands of aliphatic compounds; νC-Haro: C-H stretching bands of aromatic compounds; νC=O: C=O stretching
bands; νC=C: C=C
stretching bands; νH: O-H stretching bands; νN-O-H: N-H stretching bands; νC=O + δN-H (RCO-NH2): C=O stretching bands and N-H twisting bands of amide compounds (RCO-NH2); νC-N: C-N stretching bands
12 The proportion of the bands assigned to CH3 groups, compared with those relative to CH2 groups, varied depending on the layers. It was more important in layers 2, 4, 5, 9, 11 and 12, indicating the presence of shorter and/or branched aliphatic chains and is linked with the lower intensity of the r(CH2)n band.
Two N-H stretching bands (3250-3450 cm-1), C=O stretching band and δN-H twisting band (1640-1690 cm-1) and C-N stretching band (1055-1175 cm-1) of amide compounds (RCO-NH2) were present in layers 7, 8 and 10 and, with a lower intensity, in layers 3 and 5.
C=O stretching band (1800-1650 cm-1) was present in most layers. The stretching bands associated to aromatic compounds (C=C, 1620-1590 cm-1 and C-Haro 3100-3000 cm-1) were present in the spectra of layers 2, 6, 11 and 12 with low intensity.
3.4. Molecular analyses (GC-MS)
Molecular analyses revealed heterogeneity in the EOM along the profile. However, chromatogram similarities were recorded between those of layers 7, 8 and 10, of layers 11 and 12 and of layers 3 and 5 (Figure 4).
3.4.1. Aliphatic hydrocarbons
N-alkane contents (n-C11 to n-C40 including Pr and Ph) ranged from 8 to 396 µg g-1 (1 - 7 % of the EOM, Table 1) with the highest values in layers 4, 11 and 12. From the n-alkane distribution, layers can be divided into several groups. In layer 1, the distribution featured an odd-over-even predominance, confirmed by the high value of the Carbon Preference Index (CPI) (Table 1). The distribution in layer 3 and, to a lesser extent, layer 2 showed a slight odd-over-even predominance whereas in the other layers no predominance was observed and the CPI values were close to unity. The distributions in the deeper layers (7-12) and the surface layer were dominated by high molecular weight n-alkanes (HMW– n-C21 to n-C40). On the contrary, low molecular weight n-alkanes (LMW– n-C11 to n-C20 including Pr and Ph) accounted for a higher proportion in the upper layers (2-6), as highlighted by the LMW/HMW ratio (Table 1). The distribution in layer 4 was particularly dominated by LMW n-alkanes as well as Pr and Ph while the distributions in layers 3 and 5 showed a high contribution of n-C18. Both isoprenoids (Pr and Ph) were present in lower content than the n-alkanes n-C17 and
n-C18 (Table 1).
Chromatograms displayed a broad UCM (Figure 4), revealing the occurrence of some iso- and cyclo-alkanes, compounds not resolved by the chromatographic column (Gough and Rowland, 1990). The relative proportion of UCM area to the total area of resolved peaks was higher in layers 2, 4, 9, 11 and 12 (Table 1).
Chromatograms revealed the presence of tri-, tetra- and pentacyclic triterpanes (hopanes) (Figure 4). Tri-, tetracyclic triterpanes and some hopanes did not appear on chromatograms of layers 1, 6, 7, 8 and 10. The hopane distribution was characterized by a predominance of 17α(H),21β(H)-30-norhopane and 17α(H),21β(H)-30-hopane in association with a decrease in homohopanes from 31 to 35 carbons with a stronger contribution of the S diastereoisomers than of the R diastereoisomers (Figure 5).
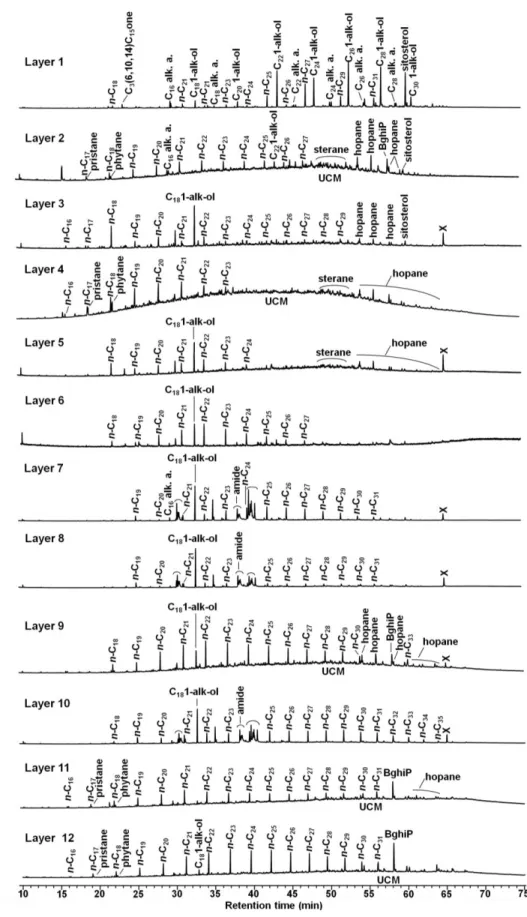
13 Figure 4 Chromatograms of extractable organic matter (GC-MS, full scan) for 12 layers along the Technosol profile
n-Cx: n-alkane with x atoms of C; Cx alk. a.: alkanoic acid with x atoms of C; Cx 1-alk-ol: 1-alkanol with x atoms
of C; C3(6,10,14) C15 one: 2-pentadecanone 6, 10, 14 trimethyl; x: non identified compound; amide:
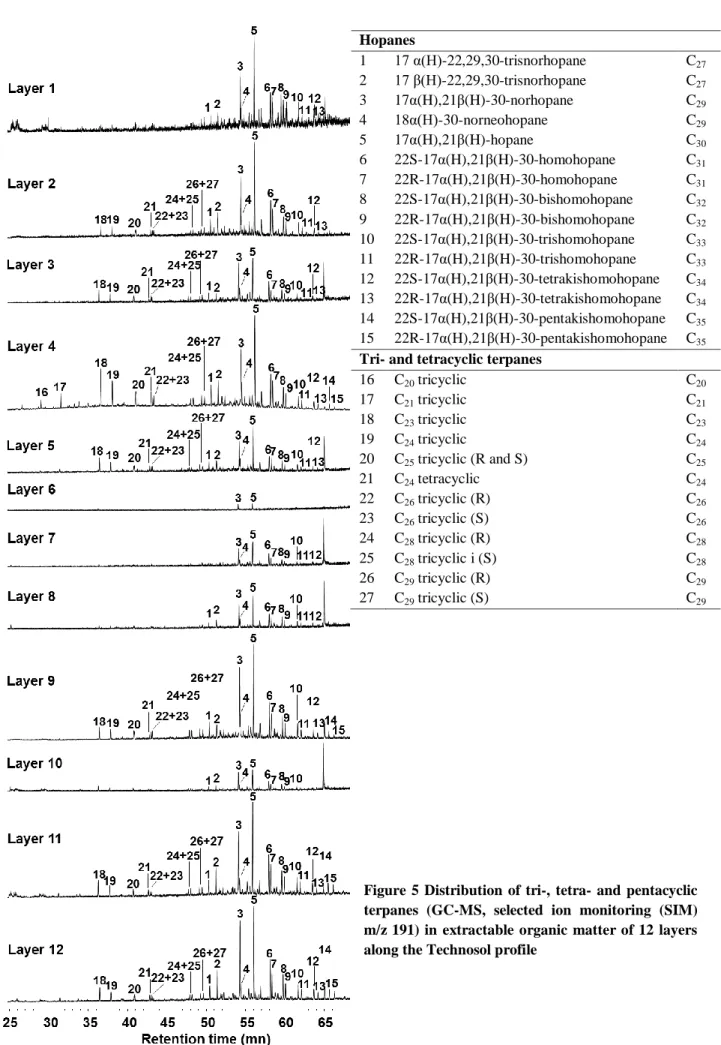
14 Figure 5 Distribution of tri-, tetra- and pentacyclic terpanes (GC-MS, selected ion monitoring (SIM) m/z 191) in extractable organic matter of 12 layers along the Technosol profile
Hopanes 1 17 α(H)-22,29,30-trisnorhopane C27 2 17 β(H)-22,29,30-trisnorhopane C27 3 17α(H),21β(H)-30-norhopane C29 4 18α(H)-30-norneohopane C29 5 17α(H),21β(H)-hopane C30 6 22S-17α(H),21β(H)-30-homohopane C31 7 22R-17α(H),21β(H)-30-homohopane C31 8 22S-17α(H),21β(H)-30-bishomohopane C32 9 22R-17α(H),21β(H)-30-bishomohopane C32 10 22S-17α(H),21β(H)-30-trishomohopane C33 11 22R-17α(H),21β(H)-30-trishomohopane C33 12 22S-17α(H),21β(H)-30-tetrakishomohopane C34 13 22R-17α(H),21β(H)-30-tetrakishomohopane C34 14 22S-17α(H),21β(H)-30-pentakishomohopane C35 15 22R-17α(H),21β(H)-30-pentakishomohopane C35 Tri- and tetracyclic terpanes
16 C20 tricyclic C20 17 C21 tricyclic C21 18 C23 tricyclic C23 19 C24 tricyclic C24 20 C25 tricyclic (R and S) C25 21 C24 tetracyclic C24 22 C26 tricyclic (R) C26 23 C26 tricyclic (S) C26 24 C28 tricyclic (R) C28 25 C28 tricyclic i (S) C28 26 C29 tricyclic (R) C29 27 C29 tricyclic (S) C29
15 3.4.2. Aromatic hydrocarbons
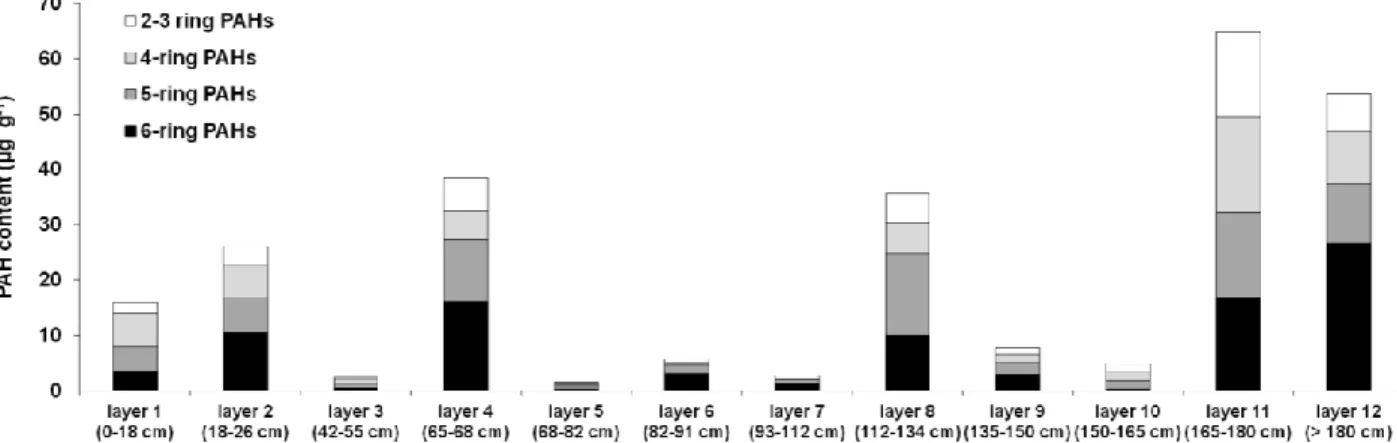
The total concentrations of the 16 US-EPA PAHs ranged from 3 to 65 µg g-1 (0.3 - 9 % of the EOM, Table 1). Content and distribution of the 16 PAHs varied along the profile (Figure 6) with the highest contents measured in layers 11, 12, 4 and 8. The PAH distribution in layers 2, 4, 6, 7, 8, 9 and 12 was dominated by 5- and 6-ring PAHs. Benzo[ghi]perylene (BghiP) represented at least 20 % of the 16 PAHs in these layers, except in layer 8, where 5-ring PAHs (benzo[b]fluoranthene and benzo[a]pyrene) presented a higher contribution (Table 1). The PAH distribution in layer 11 exhibited high proportion of BghiP but also of 2-3 ring PAHs (naphthalene and phenanthrene). The PAH distribution in the surface layer displayed a high proportion of 4- (fluoranthene) and 2-3-ring PAHs while the distribution in layers 3 and 5 were dominated by 4- and 5-ring PAHs. Layer 10 featured a higher contribution of 2-3 ring PAHs and 4-5-ring PAHs. There were no or very few alkylated PAHs.
Figure 6 Content and distribution of polycyclic aromatic hydrocarbons (PAHs) in 12 layers of the Technosol
The PAHs are classified in relation to their number of cycles.
2- and 3-ring PAHs: Naphthalene, Acenaphthene, Acenaphtylene, Fluorene, Phenanthrene, Anthracene. 4-ring PAHs: Fluoranthene, Pyrene, Benzo[a]anthracene, Chrysene.
5-ring PAHs: Benzo[b]fluoranthene, Benzo[a]pyrene, Dibenzo[a,h]anthracene, Benzo[k]fluoranthene. 6-ring PAHs: Benzo[ghi]perylene, Indeno[1,2,3-cd]pyrene.
3.4.3. Polar compounds
In the surface layer, the n-alkan-1-ol distribution was dominated by compounds containing 18 to 30 carbons with an even-over-odd predominance (Figure 4). In underlying layer 2, the distribution was similar but the n-alkan-1-ol relative abundance was smaller. In deeper layers (3 to 12), 1-octadecanol (C18:0) was present in high proportion.
The n-alkanoic acid distribution was dominated by LMW carboxylic acids containing 14 to 18 carbons, with a higher contribution of C16:0 and C18:0. In the surface layer, acids with an even carbon number between 20 and 28 also occurred.
16 Sitosterol and traces of sigmastanol were analyzed in the surface layer. Sitosterol was also present in layers 2 and 3 (Figure 4). An isoprenoid ketone, 6,10,14-trimethylpentadecan-2-one (phytone), was detected in the surface layer.
Chromatograms revealed the presence of particular compounds including octadecenamides in layers 7, 8 and 10 (Figure 4). An unidentified peak (with a retention time of 65 min) appeared on chromatograms of layers 3, 5, 7, 8, 9 and 10 (Figure 4).
4. Discussion
Analyses revealed the variability of OM quantity and composition along the profile. Characterizations carried out on extractable OM enabled us to trace the origin of organic compounds (anthropogenic versus natural) and their distribution, in relation to industrial and pedogenetic processes. It also gave information on the OM preservation state in technogenic materials, evolving under the influence of environmental factors since ca. 50 years.
4.1. Source apportionment of OM (natural versus anthropogenic origin) along the Technosol profile
The TOC distribution along the profile revealed strong accumulation of OM in the surface layer and the variability of OM contents according to the deeper layers, with low contents in some layers.
OM of the surface layer displayed a natural fingerprint. The n-alkane distribution, dominated by HMW compounds (n-C27 to n-C31) with a strong odd-over-even predominance (CPI>5), could indicate the contribution of cuticular waxes from higher plants (Bray and Evans, 1961; Eglington and Hamilton, 1967). This hypothesis was supported by the concomitant presence of HMW n-alkan-1-ols and n-alkanoic acids (C18 to C30) with an even-over-odd predominance and phytosterols (sitosterol and sigmastanol) (Simoneit, 1986). Phytone (6,10,14-trimethylpentadecan-2-one) could originate from the degradation of phytol (ester-linked side-chain of chlorophyll-a) (Rontani and Volkman, 2003). However, the occurrence of compounds such as hopanes and PAHs indicated the contribution of anthropogenic OM in the surface layer (Faure et al., 2000; Peters et al., 2005).
Sub-surface layers (2 and 3) were characterized by a specific n-alkanes distribution leading to CPI values higher than unity, a distribution of n-alkan-1-ols with even-over-odd predominance and sitosterol was also detected. Except this limited molecular evidence of natural OM contribution in layers 2 and 3, dominant biomarkers revealed mainly anthropogenic origin of OM. From the layer 4, the HMW n-alkane distribution displayed no odd-over-even predominance (CPI close to one), which is a distinctive feature of fossil OM (Jeanneau et al., 2008a). As a matter of fact, layers 2 and 3 marked the transition between the surface layer impacted by natural input and deeper layers characterized mainly by anthropogenic contribution.
All along the profile, the contribution of anthropogenic OM was supported by the presence of PAHs and petrogenic biomarkers such as hopanes and iso- and cyclo-alkanes, reflected by the occurrence of an UCM. The distribution of stable configuration hopanes (17α,21β) is
17 characteristic of thermal mature crude oil (Peters et al., 2005) or by-products, such as lubricant oils and greases and road asphalt (Faure et al., 2000; Jeanneau, 2007). Aromatic compound profiles showed the predominance of HMW parent PAHs with a low proportion of alkyl-PAHs which is typical of pyrogenic PAHs (Stout et al., 2004). Values of some specific PAH ratios used to trace source apportionment (Budzinski et al., 1997; Yunker et al., 2002) involving 4-ring PAHs (benzo[a]anthracene (BaA) and chrysene (Chr), BaA/BaA+Chr) and 6-ring PAHs (indeno[1,2,3-cd]pyrene (IP) and BghiP, IP/IP+BghiP) confirmed that PAHs would be produced by combustion processes (Table 1).
4.2. Variability of EOM fingerprints along the Technosol profile in relation to natural input and industrial processes
At the profile scale, a contribution of higher plants was evidenced by an accumulation of fresh OM in the surface layer as well as a limited incorporation in the underlying layers. In deeper layers, EOM fingerprints exhibited an important variability along the profile and revealed the presence of various anthropogenic constituents including oil, combustion by-products and other compounds in relation to iron and steel-making processes.
Blast furnaces release PAHs with an emission factor depending essentially on the raw materials, especially the fuel type and the heating processes (Yang et al., 1998). At the top of blast furnace, PAHs are mainly in the gaseous phase with a predominance of LMW PAHs (2-3 ring PAHs) while HMW PAHs (5-6-ring PAHs) are rather sorbed on the particles (Yang et al., 2002), which could explain the predominance of HMW PAHs in sludge resulting from wet cleaning of blast furnace gas. BghiP, which can be considered as an indicator for steel and iron plants using coal as fuel, in contrast to plants using heaving oil as fuel or heated by electric arc (Yang et al., 2002), was present in high proportion in some layers of the Technosol. The fact that coke was the main fuel used in the iron and steel complex in Pompey is consistent with our observations since coke is produced from coal pyrolysis.
Despite the variability of EOM fingerprints along the profile, two groups of layers can be outlined:
1) Layers 4, 11 and 12 were characterized by higher EOM content along the profile and higher n-alkane and PAH concentrations. These features were also observed but to a lesser extent in layers 2 and 9. Petrogenic biomarkers were identified, including high UCM intensity (Figure 4 and Table 1) and elevated proportion of tri-, tetra-, pentacyclic triterpanes (Figure 5). This petroleum by-product fingerprint suggested that dumping of waste oil, grease or lubricants may have occurred in the settling pond. These products are used in some operations of steel production, such as rolling mill (Raguin, 1992). BghiP was also detected in high abundance in all these layers (Table 1).
2) Layers 7, 8 and 10 were characterized by the occurrence of particular compounds including octadecenamide (oleamide). Infrared spectroscopy confirmed the specific occurrence of nitrogenated organic compounds (N-H band). The molecular mass distribution of the EOM in these layers displayed the contribution of HMW compounds (1100-1200 Da). This feature was also detected for layers 3 and 5 and, to a lesser extent, for layer 6. In all these layers, EOM, n-alkane and PAH contents were low, except in layer 8 displaying elevated
18 PAH content. Molecular analyses showed also a strong contribution of C18:0 alcohol. The presence of petrogenic biomarkers was less pronounced in EOM of layers 6, 7, 8 and 10 than in the previous layer group with a smaller relative intensity of UCM and a low triterpane diversity (absence of tri- and tetracyclic triterpanes, Figure 5). In these layers, anthropogenic OM composition was probably related to industrial operations. For instance, amides can be used as flocculating agents, lubricants in metallurgy or ore floating agents. Finally, the molecular and spectroscopic EOM characterizations enabled us to divide deeper layers into two groups. These two groups corresponded to groups determined from structure and mineralogy analyses (Huot et al., 2014). Group 1 (layers 2, 4, 9, 11 and 12) was composed of Fe-, carbonate-, and aluminosilicate-rich layers with a compact laminar structure while group 2 (layers 3, 5, 7, 8 and 10) was constituted of Mn oxide-rich layers with a crumblier structure, probably related to the production of ferromanganese, a Mn-rich ferroalloy (Huot et al., 2014). Thus, analyses of inorganic and organic constituents were consistent and gave evidence of deposition cycles in the pond, resulting from the variability of blast furnace sludge according to the nature of the used raw materials, the operations in the blast furnace and the potential effluent discharge from other operations of steel production (e.g. rolling mill). It also highlighted the formation of a 20 cm-thick organo-mineral horizon at the surface, by mixing of fresh OM and blast furnace sludge.
4.3. Preservation of OM in the Technosol
Industrial deposits and OM they contained have been subjected to environmental factors (climate, organisms) since the pond was progressively colonized by vegetation, microorganims and fauna several decades ago, leading to the establishment of a forest ecosystem. At the profile scale, the layer succession of the two contrasted groups, evidenced by OM geochemical fingerprints, suggested a particularly well preserved system with limited and/or slow OM degradation and transfer. This OM preservation was confirmed by the presence of compounds easily degradable by biotic and abiotic oxidation, such as LMW n-alkanes. Predominance of n-alkanes and especially n-C17 and n-C18 compared to two refractory isoprenoids (Pr and Ph) facing biodegradation revealed a low degradation along all the profile (Peters et al., 2005; Galperin and Kaplan, 2011). Thus, the Technosol seemed to have a preserving role of anthropogenic OM despite the biological activity in the soil and the processes of weathering and solute transfer evidenced by mineralogy and soil structure analyses (Huot et al., 2014).
Main mechanisms contributing to OM stabilization in temperate soils are i) selective preservation due to OM recalcitrance in initial phases of decomposition, ii) spatial inaccessibility of OM against decomposer organisms due to occlusion, intercalation, hydrophobicity and encapsulation and iii) stabilization by interaction with mineral surfaces (Fe-, Al-, Mn-oxides, phyllosilicates) and metal ions (Lützow et al., 2006).
Physical and hydraulic properties (high porosity, high water retention capacity and semi-permeable behavior at saturation) of these finely divided materials (Huot et al., 2013) could explain the low OM degradation rate and limited and/or slow vertical transfers. Porosity was dominated by capillary pores, with a significant part potentially occupied by pores of diameter
19 lower than 0.2 µm, which is considered to be the limiting size for access by bacteria (Lützow et al., 2006). Moreover, the Technosol displays andic properties (IUSS Working Group WRB, 2006) as in allophanic soils, in which high stabilization of organic C results partly from its poor accessibility into the fractal mesopore structure (Chevallier et al., 2010). It is also likely that OM stabilization in allophanic soils results from the incorporation of secondary OM by mesofaunal activity into fine and stable aggregates, formed by allophanes, saturated with water (Buurman et al., 2007). The degree to which the soil pore space is filled with water is an important parameter affecting the gas exchange and hence the oxygen required for hydrocarbon mineralization. Aerobic degradation is generally considered to be more rapid and efficient than anaerobic degradation (Galperin and Kaplan, 2011). In the Technosol, water retention rate can reach high proportion (more than 70% of total porosity in deeper layers at sampling time) compared to optimal values (30-70 % according to the soil texture, Galperin and Kaplan 2011). Moreover, during the infilling of settling pond, sludge layers were gradually buried, which could have limited gas diffusion from atmosphere and hence oxygen supply. The characterization of microstructure and mineralogy revealed changes of redox potential during the deposition (Huot et al., 2014).
Mineralogy of the Technosol is dominated by poorly crystalline phases, such as allophane-like phases and Mn and Fe (hydr)oxides, which have developed high specific surface area (Huot et al., 2013; 2014). These reactive phases could constitute sorption surfaces for OM. Materials are also carbonated with a complex saturated by Ca2+ ions, which have a stabilizing effect on soil OM (Oades, 1988). Finally, these technogenic materials contain high concentrations of heavy metals, especially Pb and Zn, which might have direct or indirect influence on OM stabilization, by OM complexation, toxic effect on soil microorganisms or inhibitory effects on extracellular enzymes (Lützow et al., 2006).
5. Conclusions
OM was characterized in a former settling pond of iron and steel industry, which evolved under the influence of environmental factors (climate and living organisms) since ca. 50 years. Investigations, using spectroscopic and molecular characterization on EOM enabled us to infer OM sources, their distribution along the soil profile and their state of preservation. OM has little changed over time, except through input and incorporation of fresh OM from vegetation in the surface layer. In deeper layers, OM was mainly of anthropogenic origin displaying geochemical signatures of oil products and combustion processes. These organic compounds related to iron and steel production processes were well preserved in deeper layers despite the existence of weathering and transfer processes. Thus, the former settling pond can be considered as archives of past industrial activities through the preservation of sedimentary records of organic effluent dumping. OM stabilization was probably due to the nature of mineral constituents as well as chemical and physical properties of these technogenic materials. However, these archives evolve under the influence of environmental factors and will probably disappear progressively.
20 Acknowledgements
This work was conducted within the framework of the GISFI program (www.gisfi.fr) and supported by the Région Lorraine, Institut Carnot Energie Environnement Lorraine (ICEEL) and ArcelorMittal Real Estate France (AMREF). The authors wish to thank technical staffs of the Laboratoire Sols et Environnement and the GISFI.
References
Badin AL, Faure P, Bedell JP, Delolme C. Distribution of organic pollutants and natural organic matter in urban storm water sediments as a function of grain size. Sci Total Environ 2008;403(1):178‑187.
Benhabib K, Faure P, Sardin M, Simonnot M-O. Characteristics of a solid coal tar sampled from a contaminated soil and of the organics transferred into water. Fuel 2010;89(2):352‑9. Bertrand O, Mansuy-Huault L, Montargès-Pelletier E, Losson B, Argant J, Ruffaldi P, et al. Molecular evidence for recent land use change from a swampy environment to a pond (Lorraine, France). Org Geochem 2012;50:1-10.
Biache C, Ghislain T, Faure P, Mansuy-Huault L. Low temperature oxidation of a coking plant soil organic matter and its major constituents: An experimental approach to simulate a long term evolution. J Hazard Mater 2011;188:221-30.
Blanchart P, Faure P, De Craen M, Bruggeman C, Michels R. In-situ and laboratory investigation of the alteration of Boom Clay (Oligocene) at the air- geological barrier interface within the Mol underground facility (Belgium): consequences on kerogen and bitumen compositions. Appl Geochem 2012;27:2476-85.
Bloundi KM, Faure P, Duplay J. Organic contamination identification in sediments from a Mediterranean coastal ecosystem: The case of the Nador lagoon (Eastern Morocco). Comptes Rendus Geosci 2008;340(12):840‑9.
Bray EE, Evans ED. Distribution of n-paraffins as a clue to recognition of source beds. Geochim Cosmochim Ac 1961;22(1):2-15.
Budzinski H, Jones I, Bellocq J, Pierard C, Garrigues PH. Evaluation of sediment contamination by polycyclic aromatic hydrocarbons in the Gironde estuary. Mar Chem 1997;58(1):85–97.
Buurman P, Peterse F, Almendros Martin G. Soil organic matter chemistry in allophanic soils: a pyrolysis-GC/MS study of a Costa Rican Andosol catena. Eur J Soil Sci 2007;58:1330-47. Charles MJ, Hites RA. Sediments as archives of environmental pollution trends. In: Hites RA, Eisenreich SJ, editors. Sources and fates of aquatic pollutants. Washington: American Chemical Society; 1987. p. 365-69.
Chevallier T, Woignier T, Toucet J, Blanchart E. Organic carbon stabilization in the fractal pore structure of Andosols. Geoderma 2010;159(1):182–88.
21 Coulon A, El-Mufleh A, Cannavo P, Vidal-Beaudet L, Béchet B, Charpentier S. Specific Stability of Organic Matter in a Stormwater Infiltration Basin. J Soils Sediments 2013;13(3):508-18.
Eganhouse RP. Molecular markers and environmental organic geochemistry: an overview. In: Molecular Markers in Environmental Geochemistry. Washington: American Chemical Society, ACS Symposium Series 671; 1997. p. 1-21.
Eglinton G, Hamilton RJ. Leaf epicuticular waxes. Science 1967;156(3780):1322–35.
Faure P, Mansuy-Huault L, Su X. Alkanes and hopanes for pollution source apportionment in coking plant soils. Environ Chem Lett 2007;5:41-6.
Faure P, Landais P, Schlepp L, Michels R. Evidence for Diffuse Contamination of River Sediments by Road Asphalt Particles. Environ Sci Technol 2000;34(7):1174-81.
Faure P, Landais P, Griffault L. Behavior of organic matter from Callovian shales during low-temperature air oxidation. Fuel 1999;78:1515-25.
Galperin Y, Kaplan IR. Review of Microbial Processes in the Near-Surface Environment and Their Implications for the Chemical Fingerprinting of Hydrocarbon Fuels. Environ Forensics 2011;12(3):236-52.
Gough MA, Rowland SJ. Characterization of unresolved complex mixtures of hydrocarbons in petroleum. Nature 1990;344(6267):648–50.
Hunt JM. Petroleum geochemistry and geology. 2nd ed. San Francisco: Ed. James Gilluly. W.H. Freeman and Company; 1996.
Huot H, Simonnot MO, Watteau F, Marion P, Yvon J, De Donato P, et al. Early transformation and transfer processes in a Technosol developing on iron industry deposits. Eur J Soil Sci 2014 (in press).
Huot H, Simonnot MO, Marion P, Yvon J, De Donato P, Morel JL. Characteristics and potential pedogenetic processes of a Technosol developing on iron industry deposits. J Soils Sediments 2013;13(3):555-68.
Hutchinson SM. Environmental archives of heavy metal pollution or contaminated land? A case study of former water powered industrial sites in South Yorkshire, UK. Jo Phys IV 2003;107:645–48.
IUSS Working Group WRB. World reference base for soil resources 2006. World Soil Resources Reports 103. Rome: FAO; 2006.
Jeanneau L, Faure P. Quantification of fossil organic matter in contaminated sediments from an industrial watershed: Validation of the quantitative multimolecular approach by radiocarbon analysis. Sci Total Environ 2010;408(19):4251–56.
Jeanneau L, Faure P, Montargès-Pelletier. Evolution of the source apportionment of the lipidic fraction from sediments along the Fensch River, France: A multimolecular approach. Sci Total Environ 2008b;398(1):96–106.
Jeanneau L, Faure P, Montargès-Pelletier E. Quantitative multimolecular marker approach to investigate the spatial variability of the transfer of pollution from the Fensch River to the Moselle River (France). Sci Total Environ 2008a;389(2):503–13.
22 Jeanneau L. Approche moléculaire quantitative appliquée à l’étude du transfert de micropolluants organiques à la confluence entre la Fensch et la Moselle (France) [PhD dissertation]. Nancy: Institut National Polytechnique de Lorraine; 2007.
Kèlomè NC, Faure P, Mathieu O, Lévêque J, Oyédé LM. Evidence of organic contamination in urban soils of Cotonou town (Benin). Br J Environ Clim Change 2012;2(1):99‑112.
Le Cloarec MF, Bonte PH, Lestel L, Lefèvre I, Ayrault S. Sedimentary record of metal contamination in the Seine River during the last century. Phys Chem Earth 2011; 36(12):515-29.
Li Y, Michels R, Mansuy L, Fleck S, Faure P. Comparison of pressurized liquid extraction with classical solvent extraction and microwave-assisted extraction - application to the investigation of the artificial maturation of Mahakam coal. Fuel 2002;81:747-55.
Lützow Mv, Kögel-Knabner I, Ekschmitt K, Matzner E, Guggenberger G, Marschner B, et al. Stabilization of Organic Matter in Temperate Soils: Mechanisms and Their Relevance Under Different Soil Conditions – a Review. Eur J Soil Sci 2006;57(4):426–45.
Mansfeldt T, Dohrmann R. Chemical and mineralogical characterization of blast-furnace sludge from an abandoned landfill. Environ Sci Technol 2004;38(22):5977-84.
Meybeck M, Lestel L, Bonté P, Moilleron R, Colin JL, Rousselot O, et al. Historical perspective of heavy metals contamination (Cd, Cr, Cu, Hg, Pb, Zn) in the Seine River basin (France) following a DPSIR approach (1950–2005). Sci Total Environ 2007;375(1):204–31. Oades JM.. The Retention of Organic Matter in Soils. Biogeochemistry 1988;5(1): 35-70. Pernot A, Ouvrard S, Leglize P, Faure P. Protective role of fine silts for PAH in a former industrial soil. Environ Pollut 2013;179:81-7.
Peters KE, Walters CC, Moldowan JM. The biomarker guide. Cambridge: Cambridge University Press; 2005.
Raguin J. Protection de l’environnement : Technologie. Paris: Edition Techniques de l'Ingénieur; 1992.
Rontani JF, Volkman JK. Phytol degradation products as biogeochemical tracers in aquatic environments. Org Geochem 2003;34(1):1-35.
Schindler M, Kamber BS. High-resolution lake sediment reconstruction of industrial impact in a world-class mining and smelting center, Sudbury, Ontario, Canada. Appl Geochem 2013;37:102-16.
Simoneit BRT. Cyclic terpenoids of the geosphere. Meth Geoch 1986;24:43–99.
Stout SA, Uhler AD, Emsbo-Mattingly SD. Comparative evaluation of background anthropogenic hydrocarbons in surficial sediments from nine urban waterways. Environ Sci Technol 2004;38(11):2987–94.
Tissot BP, Welte DH. Petroleum Formation and Occurrence. 2nd ed. New York: Springer-Verlag; 1984.
Truffaut E. Ferromanganèse élaboré au haut fourneau. Paris: Techniques de l'Ingénieur; 1989. Usman M, Faure P, Ruby C, Hanna K. Application of magnetite-activated persulfate oxidation for the degradation of PAHs in contaminated soils. Chemosphere 2012;87:234-40.
23 Yang HH, Lai SO, Hsieh LT, Hsueh HJ, Chi TW. Profiles of PAH emission from steel and iron industries. Chemosphere 2002;48(10):1061–74.
Yang HH, Lee WJ, Chen SJ, Lai SO. PAH emission from various industrial stacks. J Hazard Mater 1998;60(2):159–74.
Yunker MB, Backus SM, Graf Pannatier E, Jeffries DS, Macdonald RW. Sources and significance of alkane and PAH hydrocarbons in Canadian arctic rivers. Estuar Coast Shelf S 2002;55(1),1–31.