HAL Id: hal-01264169
https://hal.archives-ouvertes.fr/hal-01264169
Submitted on 1 Feb 2016
HAL is a multi-disciplinary open access
archive for the deposit and dissemination of
sci-entific research documents, whether they are
pub-lished or not. The documents may come from
teaching and research institutions in France or
abroad, or from public or private research centers.
L’archive ouverte pluridisciplinaire HAL, est
destinée au dépôt et à la diffusion de documents
scientifiques de niveau recherche, publiés ou non,
émanant des établissements d’enseignement et de
recherche français ou étrangers, des laboratoires
publics ou privés.
Distributed under a Creative Commons Attribution - NonCommercial - NoDerivatives| 4.0
(eastern Turkey): Implications for the loading and
release of interseismic strain accumulation
Ziyadin Cakir, Semih Ergintav, Ahmet Akoglu, Rahşan Çakmak, Orhan
Tatar, Mustapha Meghraoui
To cite this version:
Ziyadin Cakir, Semih Ergintav, Ahmet Akoglu, Rahşan Çakmak, Orhan Tatar, et al.. InSAR velocity
field across the North Anatolian Fault (eastern Turkey): Implications for the loading and release
of interseismic strain accumulation. Journal of Geophysical Research, American Geophysical Union,
2014, 119 (10), pp. 7934-7943. �10.1002/2014JB011360�. �hal-01264169�
InSAR velocity
field across the North Anatolian Fault
(eastern Turkey): Implications for the loading
and release of interseismic strain accumulation
Ziyadin Cakir1,2, Semih Ergintav3, Ahmet M. Akoğlu4, Rahşan Çakmak2, Orhan Tatar5, and Mustapha Meghraoui6
1
Faculty of Mines, Istanbul Technical University, Istanbul, Turkey,2TÜBİTAK MRC, Institute of Marine and Earth Sciences, Izmit, Turkey,3Kandilli Observatory and Earthquake Research Institute, Department of Geodesy, Boğaziçi University, Istanbul, Turkey,4Physical Sciences and Engineering Division, King Abdullah University of Science and Technology, Thuwal, Saudi Arabia,5Department of Geology, Cumhuriyet University, Sivas, Turkey,6Institut de Physique du Globe de Strasbourg, CNRS/University of Strasbourg, Strasbourg, France
Abstract
We use the Persistent Scatterer Interferometric Synthetic Aperture Radar (PS-InSAR) technique with the European Space Agency’s Envisat and ERS SAR data acquired on three neighboring descending tracks (T350, T078, and T307) to map the interseismic strain accumulation along a ~225 km long, NW-SE trending section of the North Anatolian Fault that ruptured during the 1939, 1942, and 1943 earthquakes in eastern Turkey. We derive a line-of-sight velocity map of the region with a high spatial resolution and accuracy which, together with the maps of earthquake surface ruptures, shed light on the style of continental deformation and the relationships between the loading and release of interseismic strain along segmented continental strike-slip faults. In contrast with the geometric complexities at the ground surface that appear to control rupture propagation of the 1939 event, modeling of the high-resolution PS-InSAR velocityfield reveals a fairly linear and narrow throughgoing shear zone with an overall 20 ± 3 mm/yr slip rate above an unexpectedly shallow 7 ± 2 km locking depth. Such a shallow locking depth may result from the postseismic effects following recent earthquakes or from a simplified model that assumes a uniform degree of locking with depth on the fault. A narrow throughgoing shear zone supports the thick lithosphere model in which continental strike-slip faults are thought to extend as discrete shear zones through the entire crust. Fault segmentation previously reported from coseismic surface ruptures is thus likely inherited from heterogeneities in the upper crust that either preexist and/or develop during coseismic rupture propagation. The geometrical complexities that apparently persist for long periods may guide the dynamic rupture propagation surviving thousands of earthquake cycles.1. Introduction
Continental strike-slip faults are divided along their strike into segments separated by step overs and restraining or releasing bends or combinations of the two structures [Allen, 1968; Sibson, 1989]. As predicted by laboratory and numerical experiments and inferred fromfield observations, geometrical fault complexities appear to persist over a long period of time surviving thousands of earthquake cycles but are eventually smoothed out with increasing cumulative offset across the fault [Sieh, 1996; Finzi et al., 2009]. By forming asperities and/or barriers, such discontinuities have long been thought to control the initiation, propagation, and termination of earthquakes along major active faults [Das and Aki, 1977; Aki, 1984; King and Yielding, 1984; Barka and Kadinsky-Cade, 1988; Wesnousky, 2006; Klinger et al., 2006]. However, how the interseismic strain accumulates along such segmented faults, particularly around geometrical heterogeneities, has not yet been clearly documented. Global Positioning System (GPS) measurements are generally too sparse for determining the pattern of strain accumulation along active faults at a kilometer scale, and conventional interferometric synthetic aperture radar (InSAR) measurements are often heavily hampered by atmospheric effects and signal decorrelation. Here, together with GPS data, we use the Persistent Scatterer synthetic aperture radar (SAR) Interferometry technique [Hooper, 2008] with Envisat and ERS satellite SAR data acquired on three neighboring descending tracks to map the interseismic strain accumulation along a ~225 km long NW-SE trending section of the North Anatolian Fault (NAF) along the Kelkit Valley in eastern Turkey (Figure 1). The strike of the NAF along the Kelkit Valley being nearly parallel to the ERS and Envisat satellites’ look direction and the relatively low vegetation due to arid to semiarid climate south of the Black Sea coastal range
PUBLICATIONS
Journal of Geophysical Research: Solid Earth
RESEARCH ARTICLE
10.1002/2014JB011360
Key Points:
• InSAR data across the North Anatolian Fault support the thick
lithosphere model
• Along-strike complexity of strike-slip faults disappears at depth • InSAR data imply shallow locking
depths (< 10 km) on the North Anatolian Fault Supporting Information: • Readme • Data Set S1 • Data Set S2 • Data Set S3 Correspondence to: Z. Cakir, [email protected] Citation:
Cakir, Z., S. Ergintav, A. M. Akoğlu, R. Çakmak, O. Tatar, and M. Meghraoui (2014), InSAR velocityfield across the North Anatolian Fault (eastern Turkey): Implications for the loading and release of interseismic strain accumulation, J. Geophys. Res. Solid Earth, 119, doi:10.1002/2014JB011360. Received 9 JUN 2014 Accepted 24 SEP 2014
make the region ideal for using InSAR to determine interseismic strain accumulation [Wright et al., 2001]. Unlike the interferogram stacking methods previously applied to the NAF [Wright et al., 2001; Walters et al., 2011, 2014; Cavalie and Jónsson, 2014], the Persistent Scatterer SAR Interferometry (PS-InSAR) technique we use in this study provides a line-of-sight (LOS) velocity map of the region along the NAF with an unprecedented spatial resolution and accuracy as it estimates and reduces atmospheric noise. With the maps of earthquake surface ruptures [Barka and Kadinsky-Cade, 1988], our InSAR analysis allows us to improve our understanding of the relationship between the loading and release of interseismic strain along the NAF and similarly segmented strike-slip faults.
2. Seismotectonics and
Segmentation of the NAF
Extending for over 1500 km from the Karlıova Triple Junction in eastern Turkey to the Corinth Rift in central Greece with a concave shape and a slip rate of 2.4 cm/yr [McClusky et al., 2000], the right-lateral NAF accommodates the anticlockwise rotation of the Anatolian Plate with respect to Eurasia that is thought to result from Hellenic trench suction [Reilinger et al., 2006] and continental collision between Arabian and Eurasian Plates [Sengor et al., 1985] (Figure 1a). The small circle arc of Anatolian Plate rotation is nearly parallel to the part of the NAF studied here, imposing a predominantly strike-slip motion on it [Reilinger et al., 2006; Tatar et al., 2012]. The SAR image frames we use cover parts of the NAF that ruptured during the 1939 (Mw7.9), 1942 (Mw6.9), and 1943 (Mw7.7) earthquakes, thefirst three events of the well-known westward
migrating sequence of earthquakes in the last century along the NAF [Toksöz et al., 1979] (Figure 1). The 1939 earthquake rupture initiated near Erzincan and propagated unilaterally to the west running about 250 km along the NAF [Dewey, 1976] (Figure 1a). However, instead of continuing straight northwest along the South Erbaa Fault or jumping to the north over a 10 km wide pull-apart basin at Niksar to follow the Taşova-Niksar Fault that ruptured 3 years later in 1942, the rupture propagated westward on the lower slip rate Ezinepazarı Fault (also known as the Ezinepazarı-Sungurlu Fault) [Erturaç and Tüysüz, 2012], running for an additional 75 km into the Anatolian Plate (Figure 1b) [Yavaşoğlu et al., 2011]. Thus, the Niksar-Erbaa extensional step over appears to have acted as a barrier to westward rupture propagation during the 1939 event, diverting it from the main trace of the NAF [Barka, 1996]. The Ezinepazarı Fault, extending into the interior of the Anatolian Plate, is probably an older structure that developed as part of the NAF during an early period of collision between the Anatolian and Arabian Plates [Sengor et al., 1985]. With increasing convergence and changes in plate rotations and the associated stressfield, the NAF propagated northwestward forming the Niksar pull-apart basin. Paleoseismological studies and historical documents suggest that in addition to medium-to-large-sized earthquakes, like those in the twentieth century sequence, very large earthquakes greater than magnitude 8 (like the 1668 event; Figure 1), infrequently take place on the NAF [Kondo et al., 2009; Kozaci et al., 2011; Zabcı et al., 2011]. Thus, the repeatability of surface slip and associated fault segments during earthquakes
a
b
Figure 1. (a) Shaded relief image map (SRTM30-Plus) of NE Turkey [Becker et al., 2009] showing active faults (black lines) and the twentieth century earthquake ruptures (colored lines) along the North Anatolian Fault (NAF) and East Anatolian Fault (EAF) [Saroglu et al., 1992] that meet in the Karlıova Triple Junction (KTJ) in eastern Turkey [Barka, 1996]. Arrows are GPS velo-cities with respect to Eurasia [from Reilinger et al., 2006; Ozener et al., 2010; Yavaşoğlu et al., 2011; Tatar et al., 2012]. Dashed rectangles show the SAR image frames on descending tracks of ERS (T350 and T307) and Envisat (T078) satellites. Combined white and black arrows indicate satellites’ LOS look andflight directions, respectively. The inset map shows the tectonic plates and major faults (red lines) in the study region and the potential extent of the 1668 earthquake (white line) along the NAF [Kondo et al., 2009]. (b) Shaded elevation map (SRTM3) of the Niksar-Erbaa pull-apart basin and its vicinity where the 1939, 1942, and 1943 earthquakes took place.
along the NAF may not be constant; segments may not break with characteristic earthquakes along the NAF as is observed along subduction zones [Konca et al., 2008].
2.1. Velocity Field From InSAR Time Series
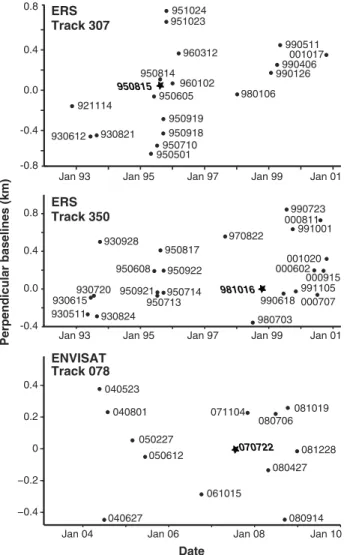
We generated time series and mean radar line-of-sight (LOS) interseismic velocity maps along the eastern portion of the NAF from European Space Agency’s ERS and Envisat SAR data using the PS-InSAR technique. As a multitemporal InSAR method, the PS-InSAR technique allows a diminution in the effects of signal decorrelation due to atmospheric changes, digital elevation model errors, and orbital inaccuracies byfiltering in time and space and selecting only the most coherent pixels for analysis, which is necessary when studying subtle and slow deformation such as interseismic strain accumulation [Ferretti et al., 2001; Hooper, 2008]. However, temporalfiltering of unevenly sampled data degraded by stratified atmospheric delays might lead to the aliasing of tropospheric delays into the estimated velocity [Jolivet et al., 2014]. We used 54 SAR images acquired on three descending tracks across the NAF: 19 on ERS track T307 between 1992 and 2000, 13 on Envisat track T078 between 2004 and 2008, and 23 on ERS track T350 between 1993 and 2000, from east to west, respectively (Figures 1 and 2). The number of images given for each track are only those which we used in ourfinal time series calculations. Orbits that do not provide satisfactory signal correlation with the master images due to large temporal and spatial baselines are not counted or shown on baseline time plots in Figure 2. Overlapping with each other, the three tracks together cover about 255 km long continuous section of the NAF between longitudes 36.4°E and 38.8°E (Figure 1). We processed the SAR data using the software package StaMPS [Hooper, 2008; Hooper et al., 2012] with Repeat Orbit Interferometry Package [Rosen et al., 2004] for focusing the raw SAR images, Delft object-oriented radar interferometric software (DORIS) [Kampes and Usai, 1999] for calculating the interferograms, and Shuttle Radar Topography Mission (SRTM) 90 m data for the removal of the topographic phase contribution. The details of the processing procedure can be found in Hooper et al. [2012].
To account for any residual error due to imprecise orbit information in each track, a bestfitting plane to the southernmost part of the velocityfield that covers a presumably undeforming part of the Anatolian Plate is subtracted from the entire velocityfield, producing mean LOS velocities with respect to stable Anatolia. However, some residuals (2–3 mm/yr) may remain in the velocity field due to plate rotation across the region ~100 km south of the North Anatolian Fault. During the time span of SAR data (1992–2010), there were no earthquakes in the region with magnitude>5.5 that could perturb the interseismic velocity field. Assuming that the LOS signal is due to surface motion and that the motion is predominantly horizontal and parallel to the local strike of the NAF (N72°W), we converted the mean LOS velocities to fault-parallel (FP) InSAR
Track 078 ENVISAT Track 307 ERS Track 350 ERS -0.4 0.0 0.4 0.8 930511 930615 930720 930824 930928 950608 950713 950714 950817 950921 950922 970822 980703 981016 990618 990723 991001 991105 000602 000707 000811 000915 001020 -0.8 -0.4 0.0 0.4 0.8 921114 930612 930821 950501 950605 950710 950814 950815 950918 950919 951023 951024 960102 960312 980106 990126990406 990511 001017 Date Perpendicular baselines (km) −0.4 −0.2 0 0.2 0.4 Jan 04 Jan 06
Jan 93 Jan 95 Jan 97 Jan 99 Jan 01
Jan 08 Jan 10 Jan 93 Jan 95 Jan 97 Jan 99 Jan 01
040523 040627 040801 050227 050612 061015 071104 080427 080706 080914 081019 081228 070722
Figure 2. Baseline plot of SAR images used to calculate the PS-InSAR velocityfield and time series. Plotted points are labeled with the date of image acquisition (YYMMDD). Stars indicate master orbits chosen for Persistent Scatterer InSAR analyses.
velocities taking into account the viewing geometry including the local radar look angle [Lyons and Sandwell, 2003]. As shown in Figure 3, the resulting mean FP InSAR velocityfield obtained from persistent scatterers with standard deviation less than 3.8 mm/yr reveals a clear picture of the interseismic deformation along the NAF. The deformationfield shows a gradual change in velocity across the fault and is consistent with the right-lateral sense of motion between the Eurasian and Anatolian Plates as warm colors indicate movement away from the satellite (i.e., westerly) and cool colors toward (i.e., easterly) the satellites which areflying in descending (i.e., heading southward) orbits. The InSAR velocityfields on all the tracks are in close agreement with GPS velocities obtained from the reprocessing of raw data from Reilinger et al. [2006], Yavaşoğlu et al. [2011], and Tatar et al. [2012] with the GAMIT/GLOBK GPS software [Herring et al., 2010] (Figure 3). Profiles of fault-parallel velocities plotted in Figure 4 together with surface velocities predicted by elastic screw dislocation models better illustrate the excellent agreement between the InSAR and GPS measurements. As can be seen in profiles P3 and P5 extracted from the overlapping sections of neighboring tracks (Figure 4), a broad consistency is also present between InSAR velocities from independent tracks, suggesting that tropospheric effects in the estimated velocityfield should be insignificant. Fault-perpendicular components of GPS velocities and joint analysis of ascending and descending InSAR data [Walters et al., 2011] confirm that this section of the NAF is purely strike slip with no notable extensional or compressional strain [McClusky et al., 2000]. Therefore, the potential error in LOS-to-FP velocity transformation with an assumption of a predominantly horizontal and fault-parallel motion should be negligible.
3. Modeling of Interseismic Strain Accumulation
The low-level noise in the velocityfields allows us to explore potential variation in the locking depth and slip rate along the fault. The inversion of the velocityfield and the related inferred fault slip at depth document the crustal deformation along the NAF. We therefore model many fault-parallel InSAR velocity profiles instead of modeling just one profile representing an entire track or a large section of it. The profiles are spaced ~10 km apart with a sampling swath width of 10 km (i.e., no overlaps between them). An average velocity with standard deviation is calculated every 100 m in 200 m bins along the profiles to smooth and reduce the number of data points to be modeled. We model these profiles using screw dislocations on an infinitely long and vertical fault in an elastic half-space following Savage and Burford [1973]. Four parameters are estimated from fault-normal InSAR profiles; slip rate at depth (mm/yr), locking depth (km), location of the fault (km) (i.e., horizontal shift), and a shift in the reference point for velocity (i.e., vertical shift). To estimate these parameters, we use a modified bootstrap procedure including a least squares optimization algorithm Figure 3. Color-coded InSAR fault-parallel velocityfield relative to Anatolia
deduced from mean line-of-sight (LOS) measurements assuming that the radar LOS displacements are due to purely horizontal motion on the N72°W striking, vertical North Anatolian Fault (white lines). Movements away (i.e., westerly) from the satellite are shown with warm colors, and toward (i.e., easterly) the satellite are with cool colors. Numbered thick dashed lines show the location of the velocity profiles in Figure 4 with white circles on top indicating the origin of the horizontal axes of the plots (i.e., location of predicted faults). GPS velocities are in an Anatolia-fixed reference frame. The blue and red brackets show the sampling width for the GPS (50 km) and PS-InSAR (10 km) data, respectively. White arrows are GPS velocities (with four-letter site names) with 95% confidence ellipses relative to Anatolia. Green circles show the location of earthquakes Mw>5.0 that took place between 1992 and 2010.
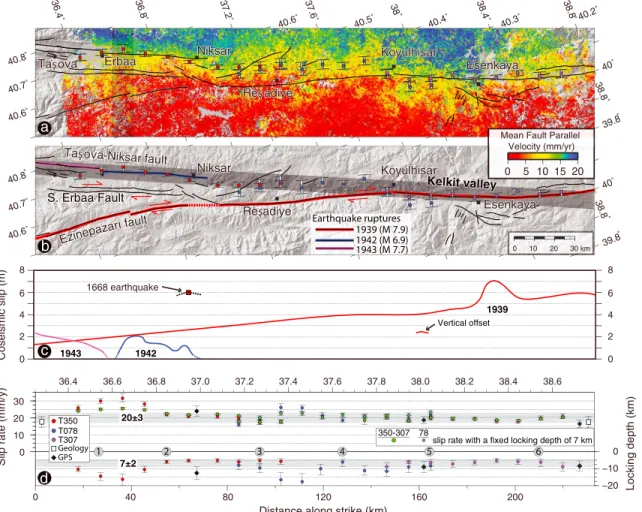
with no constraints [Segall, 2002; Tatar et al., 2012]. Bootstrap standard errors and 95% confidence limits are estimated from 500 models (Figure 5). Estimated parameters are plotted in Figure 6d where the well-known trade-off between slip rate and locking depth can be seen [Smith-Konter et al., 2011]. Except at two short sections of the fault (longitudes 36.55°E–36.75°E and 37.35°E–37.47°E) (Figure 6d), the overall slip
rate is around 20 ± 3 mm/yr, which is consistent with previous estimates based on InSAR [Wright et al., 2001; Walters et al., 2011, 2014; Cavalie and Jónsson, 2014], GPS [Tatar et al., 2012], and geological studies nearby (18 ± 3.5–19.5 ± 3 mm/yr) [Hubert-Ferrari et al., 2002; Kozaci et al., 2009; Zabcı et al., 2011].
4. Discussion and Conclusions
High slip rates above ~25 mm/yr to the west and central section of the fault are inconsistent with GPS and most likely due to unmodeled atmospheric noise as visual checking of interferograms does not show clear unwrapping errors. Relatively shorter length of profiles to the west may also lead to the higher slip rates. If a 20 ± 3 mm/yr slip rate is assumed, the locking depth is constrained to be 7 ± 2 km, which is surprisingly shallow compared to previous estimates (>14 km) based on InSAR models in the region and the globally estimated depth of 14 ± 7 km by Wright et al. [2013]. It should be noted that locking depths were weakly constrained by previous InSAR and GPS studies due to lack of near-field data. The absence of well-located seismicity along this section of the NAF makes it difficult to validate the inference of shallow locking depths. Shallow locking depths that we estimate can be due to measuring the NAF during Figure 4. Observed and modeled fault-parallel and fault-normal horizontal GPS (circles with error bars showing 95% confidence interval) and InSAR (white lines enveloped by 1 sigma error bounds) velocities along profiles shown in Figure 3. Consistency between the independent InSAR velocity profiles in the overlapping zones of neighboring tracks is notable (P3 and P5). Thick curves with different colors are the bestfitting model of elastic screw dislocations to each InSAR data set with line thickness showing 95% prediction bounds estimated with a bootstrap sampling method (model parameters are shown in Figure 6c). Interseismic strains predicted by screw dislocation models are shown with yellow Gaussian curves to better visualize the width of the shear zone. Black and red arrows show the location of the fault segments and historical surface ruptures (1942 and 1369), respectively. Topographic elevation along the profiles (thin black lines) is shown in order to reveal any potential correlation between the topography and InSAR measurements.
4 5 6 7 8 −24 −23 −22 −21 Locking depth (km) Locking depth (km) Velocity (mm/yr) 7 0 40 80 120 Frequency 0 40 80 120 Frequency −23 5 6 −22 −21 Velocity (mm/yr) mean = 6.2 km mean = 22.3 mm/y
Figure 5. (a–c) Bootstrap modeling of profile P2 (Figure 4). Scatterplot showing the trade-off between velocity and locking depth (Figure 5a). Each point is the result of a bootstrap resampling of the InSAR data for 500 times. Probability distribution for the locking depth (Figure 5b) and plate velocity (Figure 5c) from bootstrap results with vertical dashed lines showing 95% confidence bounds.
the early-middle interseismic stage of the earthquake cycle as the locking depth increases throughout the seismic cycle [e.g., Savage and Lisowski, 1998; Hetland and Hager, 2006]. Another possible explanation for the shallow fault locking can be the simplified model that assumes a uniform degree of locking with depth on the fault. As shown by Lindsey et al. [2013], the tapered slip rate at depth may give rise to shallow apparent locking depths. Although locking depths may vary significantly along the faults [Smith-Konter et al., 2011; Wright et al., 2013], the variation observed in the studied section of the fault should be interpreted with caution as it is clearly correlated with slip rate. The overall lower locking depths may, however, result from the relatively higher heatflow in the region [Bektaş et al., 2007]. Assuming that locking depth is shallow and uniform along the fault, we model the profiles with a fixed locking depth of 7 km. The results show an overall westward increase in slip rate from 20 mm/yr to 25 mm/yr in good agreement with GPS-based estimates [Tatar et al., 2012] (Figure 6d).
While surface projections of the modeled fault segments coincide well with the mapped fault traces at both ends, those in the central sections between longitudes 37.05°E and 37.85°E step over to the north with respect to the 1939 surface ruptures (Figure 6). From east to west, the modeled fault follows the 1939 rupture for about 70 km. However, west of Koyulhisar, the modeled fault deviates from the fault trace and joins with the 1942 rupture at Niksar after running fairly straight for about another 70 km (Figure 6b). Therefore, the along-strike complexity of the NAF that apparently controlled the 1939 and 1942 ruptures disappears at b
a
d c
Figure 6. Modeling results. (a) Mean fault-parallel InSAR velocity with black lines showing the active faults. Circles with error bars indicate fault locations at depth as predicted by the screw dislocation modeling of velocity profiles extracted at about every 10 km along strike. Different colors depict estimates from different tracks. Dark transparent box illustrates sampling width of data used to construct InSAR velocity profiles in Figure 4. (b) Earthquake ruptures along the North Anatolian Fault plotted on a shaded elevation image. Straight dark gray band envelopes the locations of modeled faults. (c) Coseismic slip distribution of the recent earthquakes on the NAF [from Barka, 1996]. Red square shows a channel offset of 6 m caused by the 1668 earthquake, unveiled in a paleoseismological trench by Kondo et al. [2009]. (d) Along-strike variation of slip rate and locking depth of the North Anatolian Fault. Geologic slip rates are based on offset measurements on stream networks by Hubert-Ferrari et al. [2002]. GPS rates are from Tatar et al. [2012]. Numerals in circles indicate profile numbers in Figure 4.
depth, an inference being supported by two independent InSAR data sets on two different overlapping tracks (i.e., T350 and T78). The shear zone is highly localized and aligns tofirst order with the NAF, which suggests most of the deformation concentrates on the block boundary [Cavalie and Jónsson, 2014]. Therefore, these observations support the thick lithosphere model in which major continental strike-slip faults are thought to extend through the entire crusts, and possibly the entire lithosphere, as discrete narrow damage zones [e.g., Stern and McBride, 1998; Lekic et al., 2011; Miller et al., 2014] on the contrary to the thin lithosphere model with a weak lower crust (i.e., the crème brûlée model) [Wright et al., 2013; Yamasaki et al., 2014]. This is also because interseismic deformation along strike-slip faults embedded in a weak lower crust is expected to be controlled by fault segmentation and thus be discontinuous along fault strike. However, these two models should be considered as the extreme end-member models [see Thatcher, 2007, 2009]. As can be seen from the strain curve in yellow along profile P1 of Figure 4, the shear zone widens across the Niksar-Erbaa pull-apart. Although this may potentially result from deep locking depths, it is likely a result of distributed deformation on other subparallel subsidiary faults mapped in thefield. Although recent GPS measurements suggest a slip rate of up to 2 mm/yr for the Ezinepazarı Fault [Yavaşoğlu et al., 2011], the PS-InSAR velocityfield does not show a clear sign of interseismic strain accumulation on the Ezinepazarı (1939 rupture) or South Erbaa Faults (Figures 1 and 6). The symmetry in the velocityfield about the 1942 earthquake rupture suggests that interseismic strain accumulates mostly on this segment. As can be seen in profile 3 of Figure 4, there is an offset of up to 9 km between the modeled fault and the 1939 surface rupture in the central section, which introduces an asymmetry in the velocityfield with respect to geologically mapped faults. Such an asymmetry in the velocity gradient may result from a nonvertical fault geometry, differences in rigidity [Lisowski et al., 1991; Le Pichon et al., 2005; Fialko, 2006], lower crustal/mantle viscosity [Malservisi et al., 2001; Huang and Johnson, 2012], or crustal thickness [Chery, 2008; Fulton et al., 2010] across the fault or from postseismic deformation [Kenner and Segall, 2003]. The fact that the asymmetry along the NAF is present only locally between Koyulhisar and Niksar suggests that it must be due to a change in fault dip at shallow depths since the modeled vertical fault is fairly straight and coincides with the mapped faults on both sides (Figure 6b). The fault dip probably steepens at depth and becomes vertical merging with a narrow shear zone at shallow crustal depths. The shallow fault dip implied (40°–60°) by the offset between the mapped and predicted faults is probable considering that the NAF follows an old suture zone here [Sengor et al., 1985] and hence may follow an old reverse fault with shallow dip. According to Barka [1996], this section of the fault experienced 2–2.5 m vertical offset, although it is not known if it was reverse or normal faulting (Figure 6c).
Despite the geometric complexities at the ground surface, the inferred simplicity of the fault zone at depth predicted by the models along the studied section of the NAF implies that fault segmentation at surface is most likely inherited from preexisting heterogeneities in the seismogenic zone during the localization of faults by repeated earthquakes [Sieh, 1996; Wesnousky, 2006; Aksoy et al., 2010]. Observations of natural fault systems and analogue laboratory experiments show that with increasing deformation (i.e., increasing cumulative offset), strike-slip faults evolve toward geometrically simple structures (i.e., planar and curvilinear geometry) since strain weakening in the seismogenic zone gives rise to zones of localized deformation and strength reduction [Sibson, 1989; Ben-Zion and Sammis, 2003]. However, heterogeneities along natural faults and dynamic processes may prevent complete localization and regularization, resulting in geometrical fault complexities such as the Niksar releasing step over that appear to endure over a long period of time surviving thousands of earthquake cycles [Chester et al., 1993; Finzi et al., 2009]. Although the Niksar pull-apart appears to be a resilient complexity along the NAF and has behaved as a barrier to rupture propagation during the 1939 earthquake, Kondo et al. [2009] suggest that it did not stop the 1668 rupture. Their inference is based on a 6 m offset associated with the 1668 event that they discovered in a paleoseismological trench across the 1942 fault rupture at Niksar. According to Kondo et al. [2009], such a large coseismic offset at the tip of a fault segment implies that rupture must have continued on the adjacent fault segment to the east, that is, on the 1939 fault segment during the 1668 event (Figure 6c). A recent paleoseismological study by Zabcı et al. [2011] suggests that the 1668 rupture likely continued eastward as far as Koyulhisar, supporting the inference of Kondo et al. [2009] (Figure 6b). Pull-apart basins showing a similar behavior to the Niksar pull-apart have also been observed elsewhere [Klinger, 2010]. For example, the Jingtai pull-apart basin along the Haiyuan Fault (Tibet) is thought to have acted as a barrier to the propagation of most earthquakes (the most recent being the 1920 event), but let the 1092 rupture go through [Liu-Zeng et al., 2007; Jolivet et al., 2013].
Diversion of the rupture from the main fault trace or branching at fault junctions is likely controlled by the regional stress distribution (the orientation of regional maximum compressive stress relative to the main fault), slip history, fault geometry, structure, and connectivity [Poliakov et al., 2002; Schwartz et al., 2012]. Unlike the case during the 2002 Denali event [Schwartz et al., 2012], deviation of the 1939 earthquake rupture from the main fault trace on to the Ezinepazari Fault cannot be due to the differences in the accumulated strain since the most recent earthquakes on the Ezinepazarı and Taşova-Niksar Faults because the latter also ruptured coseismically just 3 years later (Figures 1b and 6b). The deviation was most likely related to the stress level of the Ezinepazarı Fault and the rupture dynamics and dynamic stresses. Once the rupture jumped on to the Ezinepazarı Fault, the South Erbaa and the Taşova-Niksar Faults likely remained in a stress shadow, inhibiting and possibly delaying the failure on the Taşova-Niksar Fault for 3 years (Figure 1). Fault geometry and structure, connectivity, and heterogeneous fault mechanical properties might have also played some role in the rupture propagation [Kaneko et al., 2010; Noda et al., 2014]. Due to its much lower slip rate (2 mm/yr), the Ezinepazarı Fault, presumably, will not rupture together with the 1939 segment of the NAF during the next earthquake. This may allow a very large earthquake, like the 1668 event to occur rupturing at once all the segments that broke separately during the 1939, 1942, 1943, and 1944 events as depicted on the inset map in Figure 1 [Kondo et al., 2009; Fraser et al., 2009; Zabcı et al., 2011]. The Ezinepazarı Fault and its slip history may thus play a critical role in determining the size of earthquakes on the NAF.
References
Aki, K. (1984), Asperities, barriers, characteristic earthquakes and strong motion prediction, J. Geophys. Res., 89, 5867–5872, doi:10.1029/ JB089iB07p05867.
Aksoy, M. E., M. Meghraoui, M. Vallée, and Z. Cakir (2010), Rupture characteristics of the 1912 Mürefte (Ganos) earthquake segment of the North Anatolian Fault (western Turkey), Geology, 38(11), 991–994, doi:10.1130/G31447.1.
Allen, C. R. (1968), The tectonic environments of seismically active and inactive areas along the San Andreas Fault system, in Proceedings of the Conference on Geological Problems of the San Andreas System, vol. 11, edited by W. R. Dickinson, and A. Granz, pp. 70–82, Stanford Univ. Publ. in the Geol. Sci., Stanford, Calif.
Barka, A. A. (1996), Slip distribution along the North Anatolian Fault associated with the large earthquakes of the period 1939 to 1967, Bull. Seismol. Soc. Am., 86, 1238–1254.
Barka, A. A., and K. Kadinsky-Cade (1988), Strike-slip fault geometry in Turkey and its influence on earthquake activity, Tectonics, 7, 663–684, doi:10.1029/TC007i003p00663.
Becker, J. J., et al. (2009), Global bathymetry and elevation data at 30 arc seconds resolution: SRTM30_PLUS, Mar. Geod., 32(4), 355–371. Bektaş, Ö., D. Ravat, A. Büyüksaraç, F. Bilim, and A. Ateş (2007), Regional geothermal characterization of East Anatolia from aeromagnetic,
heatflow and gravity data, Pure Appl. Geophys., 164(5), 965–998.
Ben-Zion, Y., and C. G. Sammis (2003), Characterization of fault zones, Pure Appl. Geophys., 160, 677–715.
Cavalie, O., and S. Jónsson (2014), Block-like plate movements in eastern Anatolia observed by InSAR, Geophys. Res. Lett., 41, 26–31, doi:10.1002/2013GL058170.
Chery, J. (2008), Geodetic strain across the San Andreas Fault reflects elastic plate thickness variations (rather than fault slip rate), Earth Planet. Sci. Lett., 269, 351–364.
Chester, F. M., J. P. Evans, and R. L. Biegel (1993), Internal structure and weakening mechanisms of the San Andreas Fault, J. Geophys. Res., 98, 771–786, doi:10.1029/92JB01866.
Das, S., and K. Aki (1977), Fault plane with barriers: A versatile earthquake model, J. Geophys. Res., 82, 5658–5670, doi:10.1029/JB082i036p05658. Dewey, J. W. (1976), Seismicity of northern Anatolia, Bull. Seismol. Soc. Am., 66, 843–868.
Erturaç, K. M., and O. Tüysüz (2012), Kinematics and basin formation along the Ezinepazar-Sungurlu fault zone, NE Anatolia, Turkey, Turk. J. Earth Sci., 21, 497–520, doi:10.3906/yer-0910-27.
Ferretti, A., C. Prati, and F. Rocca (2001), Permanent scatters in SAR interferometry, IEEE Trans. Geosci. Remote Sens., 39(1), 8–20. Fialko, Y. (2006), Interseismic strain accumulation and the earthquake potential on the southern San Andreas fault system, Nature, 441,
968–971, doi:10.1038/nature04797.
Finzi, Y., E. H. Hearn, Y. Ben-Zion, and V. Lyakhovsky (2009), Structural properties and deformation patterns of evolving strike-slip faults: Numerical simulations incorporating damage rheology, Pure Appl. Geophys., 166(10), 1537–1573.
Fraser, J., J. S. Pigati, A. Hubert-Ferrari, K. Vanneste, U. Avsar, and S. Altinok (2009), A 3000-year record of ground-rupturing earthquakes along the central North Anatolian Fault near Lake Ladik, Turkey, Bull. Seismol. Soc. Am., 99(5), 2681–2703, doi:10.1785/0120080024. Fulton, M. P., G. Schmalzle, N. R. Harris, and T. Dixon (2010), Reconciling patterns of interseismic strain accumulation with thermal
observations across the Carrizo segment of the San Andreas Fault, Earth Planet. Sci. Lett., 300(3–4), 402–406, doi:10.1016/j. epsl.2010.10.024.
Herring, T. A., R. W. King, and S. McClusky (2010), Introduction to GAMIT/GLOBK, Release 10.4, 48 pp., Mass. Inst. of Technol., Cambridge. Hetland, E. A., and B. H. Hager (2006), Interseismic strain accumulation: Spin-up, cycle invariance, and irregular rupture sequences, Geochem.
Geophys. Geosyst., 7, Q05004, doi:10.1029/2005GC001087.
Hooper, A. (2008), A multi-temporal InSAR method incorporating both persistent scatterer and small baseline approaches, Geophys. Res. Lett., 35, L16302, doi:10.1029/2008GL034654.
Hooper, A., D. Bekaert, K. Spaans, and M. Arıkan (2012), Recent advances in SAR interferometry time series analysis for measuring crustal deformation, Tectonophysics, 514-517, 1–13, doi:10.1016/j.tecto.2011.10.013.
Huang, W. J., and K. M. Johnson (2012), Strain accumulation across strike-slip faults: Investigation of the influence of laterally varying lithospheric properties, J. Geophys. Res., 117, B09407, doi:10.1029/2012JB009424.
Hubert-Ferrari, A., R. Armijo, G. King, B. Meyer, and A. Barka (2002), Morphology, displacement, and slip rates along the North Anatolian Fault, Turkey, J. Geophys. Res., 107(B10), 2235, doi:10.1029/2001JB000393.
Acknowledgments
We thank Romain Jolivet and an anon-ymous reviewer for their constructive comments that helped us to greatly improve the manuscript. We have also benefitted from discussions with Rob Reilinger and Michel Bouchon. Part of the SAR data was initially provided by European Space Agency under Category-1 project AOTR-2436. All of the SAR images used in this work can be obtained free of charge from the GEO portal (http://supersites.earthobserva-tions.org). Data processing was done at the TÜBİTAK ULAKBİM High Performance and Grid Computing Centre (Turkey). PS-InSAR velocityfield data obtained and used in this study can be found in the supporting infor-mation. Financial support is from DPT project 2006-120220 K and TÜBİTAK project 107Y281. The maps in this paper were generated using the public domain Generic Mapping Tools (GMT) software [Wessel and Smith, 1998].
Jolivet, R., C. Lasserre, M.-P. Doin, G. Peltzer, J.-P. Avouac, R. Dailu, and J. Sun (2013), Spatio-temporal evolution of aseismic slip along the Haiyuan Fault, China: Implications for fault frictional properties, Earth Planet. Sci. Lett., 377-378, 23–33, doi:10.1016/j.epsl.2013.07.020. Jolivet, R., P. Agram, Y.-N. Lin, M. Simons, M.-P. Doin, G. Peltzer, and Z. Li (2014), Improving InSAR geodesy using global atmospheric models,
J. Geophys. Res. Solid Earth, 119, 2324–2341, doi:10.1002/2013JB010588.
Kampes, B., and S. Usai (1999), Doris: The Delft object-oriented radar interferometric software, paper presented an International Symposium on Operationalization of Remote Sensing, Enschede, Netherlands.
Kaneko, Y., J.-P. Avouac, and N. Lapusta (2010), Towards inferring earthquake patterns from geodetic observations of interseismic coupling, Nat. Geosci., 3(5), 363–369, doi:10.1038/NGEO843.
Kenner, S., and P. Segall (2003), Lower crustal structure in Northern California implications from strain rate variations following the 1906 San Francisco earthquake, J. Geophys. Res., 108(B11), 2011, doi:10.1029/2001JB000189.
King, G. C. P., and G. Yielding (1984), The evolution of a thrust fault system: Processes of rupture initiation, propagation and termination in the 1980 El Asnam (Algeria) earthquake, Geophys. J. R. Astron. Soc., 77, 915–933.
Klinger, Y. (2010), Relation between continental strike-slip earthquake segmentation and thickness of the crust, J. Geophys. Res., 115, B07306, doi:10.1029/2009JB006550.
Klinger, Y., R. Michel, and G. C. P. King (2006), Evidence for an earthquake barrier model from Mw 7.8 Kokoxili (Tibet) earthquake slip-distribution, Earth Planet. Sci. Lett., 242(3–4), 354–364, doi:10.1016/j.epsl.2005.12.003.
Konca, A. O., et al. (2008), Partial rupture of a locked patch of the Sumatra megathrust during the 2007 earthquake sequence, Nature, 456, 631–635.
Kondo, H., A. Kürçer, S. Özalp, and Ö. Emre (2009), Non-characteristic recurrence behavior on the 1942 Niksar-Erbaa earthquake rupture along the North Anatolian fault system, Turkey, EGU General Assembly–Geophysical Research Abstracts Vienna, 11, EGU2009-7712-2. Kozaci, Ö., J. F. Dolan, and R. C. Finkel (2009), A late Holocene slip rate for the central North Anatolian Fault, at Tahtaköy, Turkey, from
cosmogenic 10Be geochronology: Implications for fault loading and strain release rates, J. Geophys. Res., 114, B01405, doi:10.1029/ 2008JB005760.
Kozaci, Ö., J. F. Dolan, Ö. Yönlü, and R. D. Hartleb (2011), Paleoseismologic evidence for the relatively regular recurrence of infrequent, large-magnitude earthquakes on the eastern North Anatolian Fault at Yaylabeli, Lithosphere, 3, 37–54, doi:10.1130/L118.1. Lekic, V., S. W. French, and K. M. Fischer (2011), Lithospheric thinning beneath rifted regions of Southern California, Science, 334, 783–787,
doi:10.1126/science.1208898.
Le Pichon, X., C. Kreemer, and N. Chamot-Rooke (2005), Asymmetry in elastic properties and the evolution of large continental strike-slip faults, J. Geophys. Res., 110, B03405, doi:10.1029/2004JB003343.
Lindsey, E., V. Sahakian, Y. Fialko, Y. Bock, S. Barbot, and T. Rockwell (2013), Interseismic strain localization in the San Jacinto fault zone, Pure Appl. Geophys., doi:10.1007/s00024-013-0753-z.
Lisowski, M., J. Savage, and W. H. Prescott (1991), The velocityfield along the San Andreas Fault in central and Southern California, J. Geophys. Res., 96, 8369–8389, doi:10.1029/91JB00199.
Liu-Zeng, J., Y. Klinger, X. Xu, C. Lasserre, G. Chen, W. Chen, P. Tapponnier, and B. Zhang (2007), Millennial recurrence of large earthquakes on the Haiyuan Fault near Songshan, Gansu Province, China, Bull. Seismol. Soc. Am., 97(1B), 14–34.
Lyons, S. N., and D. T. Sandwell (2003), Fault-creep along the southern San Andreas from InSAR, permanent scatterers, and stacking, J. Geophys. Res., 108(B1), 2047, doi:10.1029/2002JB001831.
Malservisi, R., K. P. Furlong, and T. H. Dixon (2001), Influence of the earthquake cycle and lithospheric rheology on the dynamics of the eastern California shear zone, Geophys. Res. Lett., 28, 2731–2734, doi:10.1029/2001GL013311.
McClusky, S., et al. (2000), Global Positioning System constraints on plate kinematics and dynamics in the eastern Mediterranean and Caucasus, J. Geophys. Res., 105(B3), 5695–5719.
Miller, M. S., P. Zhang, and J. F. Dolan (2014), Moho structure across the San Jacinto fault zone: Insights into strain localization at depth, Lithosphere, 6(1), 43–47, doi:10.1130/L295.1.
Noda, H., M. Nakatani, and T. Hori (2014), Coseismic visibility of a small fragile patch involved in the rupture of a large patch—Implications from fully dynamic rate-state earthquake sequence simulations producing variable manners of earthquake initiation, Prog. Earth Planet. Sci., 1, 8, doi:10.1186/2197-4284-1-8.
Ozener, H., E. Arpat, S. Ergintav, A. Dogru, R. Cakmak, B. Turgut, and U. Dogan (2010), Kinematics of the eastern part of the North Anatolian fault zone, J. Geodyn., 49, 141–150, doi:10.1016/j.jog.2010.01.003.
Poliakov, A. N. B., R. Dmowska, and J. R. Rice (2002), Dynamic shear rupture interactions with fault bends and off-axis secondary faulting, J. Geophys. Res., 107(B11), 2295, doi:10.1029/2001JB000572.
Reilinger, R., et al. (2006), GPS constraints on continental deformation in the Africa-Arabia-Eurasia continental collision zone and implications for the dynamics of plate interactions, J. Geophys. Res., 111, B05411, doi:10.1029/2005JB004051.
Rosen, P., S. Hensley, G. Peltzer, and M. Simons (2004), Updated repeat orbit interferometry package released, Eos Trans. AGU, 85(5), 47, doi:10.1029/2004EO050004.
Saroglu, F., O. Emre, and I. Kuscu (1992), Active Fault Map of Turkey, General Directorate of Mineral Research and Exploration (MTA), Eskisehir Yolu, Ankara, Turkey.
Savage, J. C., and R. Burford (1973), Geodetic determination of relative plate motion in central California, J. Geophys. Res., 78, 832–845, doi:10.1029/JB078i005p00832.
Savage, J. C., and M. Lisowski (1998), Viscoelastic coupling model of the San Andreas Fault along the big bend, Southern California, J. Geophys. Res., 103, 7281–7292, doi:10.1029/98JB00148.
Schwartz, D. P., P. J. Haeussler, G. G. Seitz, and T. E. Dawson (2012), Why the 2002 Denali fault rupture propagated onto the Totschunda Fault: Implications for fault branching and seismic hazards, J. Geophys. Res., 117, B11304, doi:10.1029/2011JB008918.
Segall, P. (2002), Integration of geologic and geodetic estimates of fault slip rates on the San Andreas system, Int. Geol. Rev., 44, 62–82. Sengor, A. M. C., N. Gorur, and F. Saroglu (1985), Strike-slip faulting and related basin formation in zones of tectonic escape: Turkey as a
case study, in Strike-Slip Faulting and Basin Formation, edited by K. T. Biddle and N. Christie-Blick, Soc. Econ. Paleontol. Mineral., Spec. Publ., 37, 227–264.
Sibson, R. H. (1989), Earthquake faulting as a structural process, J. Struct. Geol., 11, 1–14, doi:10.1016/0191-8141(89)90032-1. Sieh, K. (1996), The repetition of large earthquake ruptures, Proc. Natl. Acad. Sci. U.S.A., 93(9), 3764–3771.
Smith-Konter, B., D. Sandwell, and P. Shearer (2011), Locking depths estimated from geodesy and seismology along the San Andreas fault system: Implications for seismic moment release, J. Geophys. Res., 116, B06401, doi:10.1029/2010JB008117.
Stern, T. A., and J. H. McBride (1998), Seismic exploration of continental strike-slip zones, Tectonophysics, 286, 63–78, doi:10.1016/ S0040-1951(97)00255-2.
Tatar, O., et al. (2012), Crustal deformation and kinematics of the eastern part of the North Anatolian fault zone (Turkey) from GPS measurements, Tectonophysics, 518–521, 55–62, doi:10.1016/j.tecto.2011.11.010.
Thatcher, W. (2007), Microplate model for the present-day deformation of Tibet, J. Geophys. Res., 112, B01401, doi:10.1029/2005JB004244. Thatcher, W. (2009), How the continents deform: The evidence from tectonic geodesy, Annu. Rev. Earth Planet. Sci., 37-1, 237–262,
doi:10.1146/annurev.earth.031208.100035.
Toksöz, M. N., A. F. Shakal, and A. J. Michael (1979), Space-time migration of earthquakes along the North Anatolian fault zone and seismic gaps, Pageoph, 117, 1258–1270.
Walters, R. J., R. J. Holley, B. Parsons, and T. J. Wright (2011), Interseismic strain accumulation across the North Anatolian Fault from Envisat InSAR measurements, Geophys. Res. Lett., 38, L05303, doi:10.1029/2010GL046443.
Walters, R. J., B. Parsons, and T. J. Wright (2014), Constraining crustal velocityfields with InSAR for eastern Turkey: Limits to the block-like behavior of eastern Anatolia, J. Geophys. Res. Solid Earth, 119, 5215–5234, doi:10.1002/2013JB010909.
Wesnousky, S. (2006), Predicting the end points of earthquake ruptures, Nature, 444(7117), 358–360, doi:10.1038/nature05275.
Wessel, P., and W. H. F. Smith (1998), New, improved version of generic mapping tools released, Eos Trans. AGU, 79(47), 579, doi:10.1029/ 98EO00426.
Wright, T. J., B. Parsons, and E. Fielding (2001), Measurement of interseismic strain accumulation across the North Anatolian Fault by satellite radar interferometry, Geophys. Res. Lett., 28, 2117–2120, doi:10.1029/2000GL012850.
Wright, T. J., J. R. Elliott, H. Wang, and I. Ryder (2013), Earthquake cycle deformation and the Moho: Implications for the rheology of continental lithosphere, Tectonophysics, 609, 504–523, doi:10.1016/j.tecto.2013.07.029.
Yamasaki, T., T. J. Wright, and G. A. Houseman (2014), Weak ductile shear zone beneath a major strike-slip fault: Inferences from earthquake cycle model constrained by geodetic observations of the western North Anatolian Fault Zone, J. Geophys. Res. Solid Earth, 119, 3678–3699, doi:10.1002/2013JB010347.
Yavaşoğlu, H., E. Tarı, O. Tüysüz, Z. Çakır, and S. Ergintav (2011), Determining and modeling tectonic movements along the central part of the North Anatolian Fault (Turkey) using geodetic measurements, J. Geodyn., 51, 339–343, doi:10.1016/j.jog.2010.07.003.
Zabcı, C., H. S. Akyüz, V. Karabacak, T. Sançar, E. Altunel, H. Gürsoy, and O. Tatar (2011), Palaeoearthquakes on the Kelkit Valley segment of the North Anatolian Fault, Turkey: Implications for the surface rupture of the historical 17 August 1668 Anatolian earthquake, Turk. J. Earth Sci., 20(4), 411–427, doi:10.3906/yer-0910-48.
![Figure 1. (a) Shaded relief image map (SRTM30-Plus) of NE Turkey [Becker et al., 2009] showing active faults (black lines) and the twentieth century earthquake ruptures (colored lines) along the North Anatolian Fault (NAF) and East Anatolian Fault (EAF) [S](https://thumb-eu.123doks.com/thumbv2/123doknet/14784845.598271/3.918.270.610.137.473/figure-shaded-turkey-twentieth-earthquake-ruptures-anatolian-anatolian.webp)