HAL Id: hal-00301599
https://hal.archives-ouvertes.fr/hal-00301599
Submitted on 1 Jul 2005HAL is a multi-disciplinary open access
archive for the deposit and dissemination of sci-entific research documents, whether they are pub-lished or not. The documents may come from teaching and research institutions in France or abroad, or from public or private research centers.
L’archive ouverte pluridisciplinaire HAL, est destinée au dépôt et à la diffusion de documents scientifiques de niveau recherche, publiés ou non, émanant des établissements d’enseignement et de recherche français ou étrangers, des laboratoires publics ou privés.
Chemical ozone loss in the Arctic winter 2002/2003
determined with Match
M. Streibel, M. Rex, P. von der Gathen, R. Lehmann, N. R. P. Harris, G. O.
Braathen, E. Reimer, H. Deckelmann, M. Chipperfield, G. Millard, et al.
To cite this version:
M. Streibel, M. Rex, P. von der Gathen, R. Lehmann, N. R. P. Harris, et al.. Chemical ozone loss in the Arctic winter 2002/2003 determined with Match. Atmospheric Chemistry and Physics Discussions, European Geosciences Union, 2005, 5 (4), pp.4311-4333. �hal-00301599�
ACPD
5, 4311–4333, 2005Match in Arctic winter 2002/2003 M. Streibel et al. Title Page Abstract Introduction Conclusions References Tables Figures J I J I Back Close
Full Screen / Esc
Print Version
Interactive Discussion
EGU
Atmos. Chem. Phys. Discuss., 5, 4311–4333, 2005 www.atmos-chem-phys.org/acpd/5/4311/
SRef-ID: 1680-7375/acpd/2005-5-4311 European Geosciences Union
Atmospheric Chemistry and Physics Discussions
Chemical ozone loss in the Arctic winter
2002/2003 determined with Match
M. Streibel1,2, M. Rex1, P. von der Gathen1, R. Lehmann1, N. R. P. Harris2, G. O. Braathen3, E. Reimer4, H. Deckelmann1, M. Chipperfield5, G. Millard6, M. Allaart7, S. B. Andersen8, H. Claude9, J. Davies10, H. De Backer11, H. Dier12, V. Dorokov13, H. Fast10, M. Gerding14, E. Kyr ¨o15, Z. Litynska16, D. Moore17, E. Moran18, T. Nagai19, H. Nakane20, C. Parrondo21, P. Skrivankova22, R. St ¨ubi23, G. Vaughan24, P. Viatte25, and V. Yushkov13
1
Alfred Wegener Institute for Polar and Marine Research, P.O. Box 600149, 14401 Potsdam, Germany
2
European Ozone Research Coordinating Unit, University of Cambridge, 14 Union Road, Cambridge, UK
3
NILU, P.O. Box 100, Kjeller, Norway
4
Met. Institute, FU Berlin, C.-H.-Becker Weg 6-10, D-12165 Berlin, Germany
5
University of Leeds, Leeds, LS2 9JT, UK
6
Centre for Atmospheric Science, University of Cambridge, Lensfield Road, Cambridge, UK
7
KNMI, P.O. Box 201, 3730 AE De Bilt, The Netherlands
8
Danish Meteorological Institute, Lyngbyvej 100, DK-2100 Copenhagen, Denmark
9
DWD, Observatory Hohenpeißenberg, Albin-Schwaiger-Weg 10, 82383 Hohenpeißenberg, Germany
ACPD
5, 4311–4333, 2005Match in Arctic winter 2002/2003 M. Streibel et al. Title Page Abstract Introduction Conclusions References Tables Figures J I J I Back Close
Full Screen / Esc
Print Version
Interactive Discussion
EGU
10
Meteorological Service of Canada, 4905 Dufferin Street, Downsview, ON, M3H 5T4, Canada
11
RMI, Ringlaan 3, Brussels, Belgium
12
MOL, 15864 Lindenberg, Germany
13
CAO, Pervomajskaya Street 3, Dolgoprudny, Moscow Region, 141700, Russia
14
IAP, Schlossstrasse 6, 18225 K ¨uhlungsborn, Germany
15
SMO,T ¨ahtel ¨antie 71, Sodankyl ¨a, Finland
16
MWM, Centre of Aerology, Zegrzynska Str.38, 05-119 Legionowo, Poland
17Met. Office, Fitzroy Road, Exeter, Berknell, Devon, EX1 3PB, UK 18
IMS, Valentia Observatory, Cahirciveen, Co. Kerry, Ireland
19
Meteorological Research Institute, 1-1, Nagamine, Tsukuba, Ibaraki 305-0052, Japan
20
National Institute for Environmental Studies, 16-2 Onogawa, Tsukuba, Ibaraki 305-8506, Japan
21
INTA, Torrejon de Argoz, Madrid, Spain
22
Czech Hydrometical Institute, Na Sabatce 17, 14306 Prague, Czech Republik
23
Swiss Meteorological Aerological Station CH-1530 Payerne, Switzerland
24
University of Wales, Department of Physics, Aberystwyth, SY23 3BZ, Wales, UK
25
SMI, Les Invuardes, 1530 Payerne, Switzerland
Received: 27 April 2005 – Accepted: 3 May 2005 – Published: 1 July 2005 Correspondence to: M. Streibel ([email protected])
ACPD
5, 4311–4333, 2005Match in Arctic winter 2002/2003 M. Streibel et al. Title Page Abstract Introduction Conclusions References Tables Figures J I J I Back Close
Full Screen / Esc
Print Version
Interactive Discussion
EGU
Abstract
The Match technique was used to determine chemically induced ozone loss inside the stratospheric vortex during the Arctic winter 2002/2003. From end of November 2002, which is the earliest start of a Match campaign ever, until end of March 2003 approximately 800 ozonesondes were launched from 30 stations in the Arctic and mid
5
latitudes. Ozone loss rates were quantified from the beginning of December until mid of March in the vertical region of 400–550 K potential temperature. In December ozone destruction rates varied between 10–15 ppbv/day depending on height. Maximum loss rates around 35 ppbv/day were reached during late January. Afterwards ozone loss rates decreased until mid-March when the final warming of the vortex began and
mea-10
surements for the campaign were no longer possible. In the period of 2 December 2002 to 16 March 2003 the accumulated ozone loss reduced the partial ozone column of 400–500 K potential temperature by 56±4 DU. The sensitivity of the results on recent improvements of the approach has been tested.
1. Introduction
15
Over the past two decades substantial progress has been made in the qualitative un-derstanding of chemical and dynamical processes in the northern winter stratosphere that lead to ozone loss (WMO, 2003). Nevertheless a full quantitative understanding of the ozone loss processes is essential for a reliable prediction of the future evolution of the polar ozone layer. Several comparisons of observed ozone losses measured
20
by a variety of approaches with model calculations indicate that observed ozone loss rates are often faster than can be explained, particularly during cold Arctic Januaries (e.g. Rex et al., 2003). To provide a broader observational basis for detailed studies addressing this issue, an ozonesonde campaign using the Match technique (von der Gathen et al., 1995; Rex et al., 1997, 1999) was performed within the EC project
“Quan-25
ACPD
5, 4311–4333, 2005Match in Arctic winter 2002/2003 M. Streibel et al. Title Page Abstract Introduction Conclusions References Tables Figures J I J I Back Close
Full Screen / Esc
Print Version
Interactive Discussion
EGU
is part of the European experiment ”Validation of INTERnational satellites and Study of Ozone Loss” (VINTERSOL). It was carried out together with the second NASA SAGE III Ozone Loss and Validation Experiment (SOLVE II) as a collaborative field campaign in the winter 2002/2003. In this paper we report results from the Match campaign 2002/2003 and summarize improvements which have been implemented in the Match
5
analysis since it was last described in Rex et al. (2002).
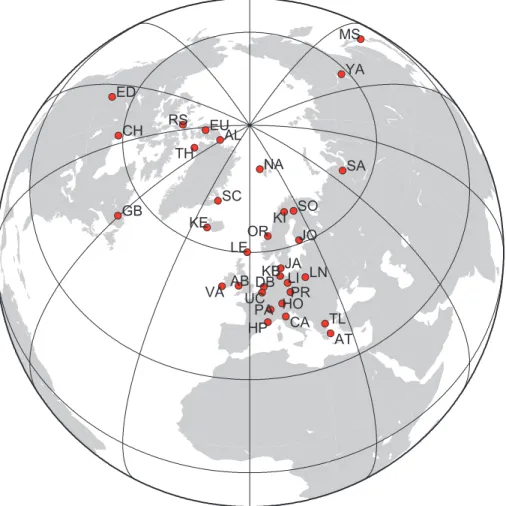
During winter 2002/2003 more than 800 ozonesondes were launched from approx-imately 30 stations in the Arctic and northern mid latitudes (Fig. 1). More than 450 of these were launched in response to Match alerts, which directed them into air masses that had been probed by an ozonesonde launched at another station between two and
10
ten days earlier. This was achieved by using trajectory calculations based on analysis and forecast data from the European Centre for Medium-Range Weather Forecasts (ECMWF). For two measurements which can be connected by a calculated trajectory the dynamical impact on the ozone mixing ratio is largely eliminated. After the active coordination phase the trajectories are recalculated based on analysis data. By
com-15
paring the ozone concentration of two air parcels which are connected by a trajectory the chemical ozone destruction can be calculated. One particular focus of the Match campaign 2002/2003 was the study of ozone loss in December, which had not been investigated by Match. Hence, the campaign was started in late November, about six weeks earlier than previous Match campaigns. To cover also the full extent of the ozone
20
loss period, the campaign was run until mid-March, when the increased dynamical ac-tivity made the continuation of the campaign impossible. The ozone loss rates had dropped to near zero values by then and temperatures stayed well above the threshold for chlorine activation afterwards. So it can be assumed that the results presented here cover the overall ozone loss during winter 2002/2003.
25
The campaign and the following data analysis were carried out along the lines de-scribed in Rex et al. (2002). However, the following modifications were made to further improve the approach:
ACPD
5, 4311–4333, 2005Match in Arctic winter 2002/2003 M. Streibel et al. Title Page Abstract Introduction Conclusions References Tables Figures J I J I Back Close
Full Screen / Esc
Print Version
Interactive Discussion
EGU
the final analysis step was increased to 1.25◦×1.25◦(2.5◦×2.5◦before).
– The sensitivity of ozone loss rates to an additional match radius has been tested.
For that reason backward trajectories have been calculated starting at the loca-tion of the second ozonesonde measurement. This addiloca-tional match radius is calculated as the distance between the respective point of the backward
trajec-5
tory to the location of the first measurement. In the following this match radius is called “backward match radius”. This addresses the effect of a modification of the original Match approach that has first been used by Terao et al. (2002). So far only the difference between the location of the forward trajectory to the second ozonesonde measurement was calculated and checked. This match radius will
10
be called “forward match radius”.
– The approach to estimate statistical uncertainties of the results has been updated
to fully account for the effect that not all individual match events are strictly inde-pendent. A detailed description of the statistical method applied is given in the paper Lehmann et al. (2004).
15
The impact of these changes on the results are discussed in Sect. 4.
2. Meteorology of the winter 2002/2003
The stratospheric temperature in the beginning of the winter 2002/2003 was sufficiently low for the widespread formation of PSCs. In November/December the area covered by temperatures low enough for PSCs to exist (AP SC) even exceeded those of the cold
20
winter 1999/2000. At 475–550 K potential temperature they reached the largest val-ues present in the ERA-15 dataset, which goes back to 1979. AP SCis calculated using temperatures from the ECMWF, assuming nitric acid trihydrate (NAT) in thermodynamic equilibrium (Hansen and Mauersberger, 1988). In the middle and lower stratosphere the conditions remained cold until mid January, when a major warming occurred.
Dur-25
ACPD
5, 4311–4333, 2005Match in Arctic winter 2002/2003 M. Streibel et al. Title Page Abstract Introduction Conclusions References Tables Figures J I J I Back Close
Full Screen / Esc
Print Version
Interactive Discussion
EGU
the cold winters during the 1990s. In February a minor warming took place leading to a split of the vortex for several days. Another minor warming took place in March. During February and March the temperatures dropped only occasionally below temperatures low enough for the formation of polar stratospheric clouds. The final warming began at the end of March (Naujokat and Grunow, 2003).
5
3. Results
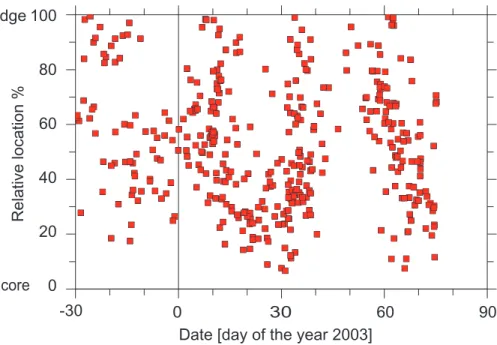
In this section we report the seasonal evolution and vertical distribution of ozone loss rates in winter 2002/2003. The ozone loss rates are presented as averages over all match events inside the polar vortex and are expressed in terms of ozone loss per sun-lit hour as well as loss per day. Figure 2 shows the spatial and temporal coverage of the
10
vortex by match events throughout the winter. Each red dot gives the relative location of a match event inside the vortex. 100% relative location is defined as the vortex edge, 0% as the vortex core. Figure 2 shows that the vortex was relatively homogeneously sampled by Match. Hence, the loss rates reported here represent vortex average con-ditions. In previous Match analyses the vortex edge was defined by a constant value of
15
normalized PV (see Rex et al., 1999, for definition of normalized PV), which was cho-sen such that it corresponds to the strongest meridional gradient in PV. This approach was justified, since during the individual periods studied in those analyses, the PV val-ues at the maximum PV gradient have not changed much. In contrast to recent years, in 2002/2003 the vortex was probed already during its formation phase, when the PV
20
value closest to the maximum PV gradient was still increasing. Hence, the definition of the vortex edge was adapted to the strengthening of the vortex during December and the value of normalized PV chosen to define the vortex edge was increased from 28 s−1in early December to 36 s−1 on 9 January. From that day on the value was hold on a constant level of 36 s−1(Table 1).
25
The lower part of the panels of Fig. 3 shows the seasonal evolution of ozone loss rates on four potential temperature levels (Θ=425, 450, 475, and 500 K). The individual
ACPD
5, 4311–4333, 2005Match in Arctic winter 2002/2003 M. Streibel et al. Title Page Abstract Introduction Conclusions References Tables Figures J I J I Back Close
Full Screen / Esc
Print Version
Interactive Discussion
EGU
data points shown in Figure 3 represent results of linear regressions based on match events from a ±10 K vertical bin and a ±7 day time bin, starting with a point corre-sponding to data centred around 5 December. In the upper part of each panel AP SC is shown. In December ozone loss rates increased towards the end of the month and ranged between 0 and about 4 ppbv per sunlit hour, which corresponds to 0–20 ppbv
5
per day. AtΘ=450–500 K ozone loss rates reached maximum values of up to 6.0 ppbv per sunlit hour (35 ppbv per day) during January and generally decreased during Febru-ary, reaching insignificant values by the end of the month. At 425 K ozone loss rates were generally smaller and reached a maximum value of 3.1±0.9 ppbv per sunlit hour (27±7.4 ppbv per day) during mid-February.
10
The numbers given in the lower part of the panels (a), (c), (e), (g) in Fig. 3 indicate the numbers of individual match events that were used for the various data points. For days 44 to 51 these numbers are considerably smaller than for most of the other data points. The reason is the strong minor warming that occurred during this period of the winter. Due to the unstable meteorological conditions the quality criteria for Match
15
events (i.e. little divergence of the individual trajectory clusters, PV conservation along the trajectories, absence of laminae structures in the ozone profiles) were often not met.
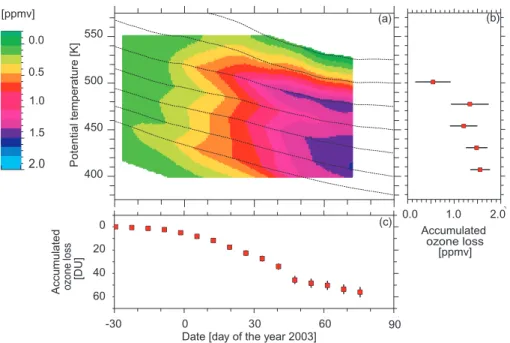
Figure 4 shows the overall accumulated ozone loss that occurred during the Arctic winter 2002/2003. Following the approach described in Rex et al. (2002) ozone loss
20
rates were accumulated in five subsiding levels inside the polar vortex, corresponding to the spring equivalent potential temperatures 400, 425, 450, 475, and 500 K at 31 March. Spring equivalent potential temperature denotes the potential temperature a given air mass reaches on day 90 (Rex et al., 2002). Figure 4a shows the evolution and vertical distribution of the accumulated ozone loss during December to March.
25
By the end of the winter (day 75) accumulated ozone loss reached 1.6±0.2 ppmv at Θ=407 K and slightly smaller values above, up to 475 K spring equivalent potential temperature (Fig. 4b).
ACPD
5, 4311–4333, 2005Match in Arctic winter 2002/2003 M. Streibel et al. Title Page Abstract Introduction Conclusions References Tables Figures J I J I Back Close
Full Screen / Esc
Print Version
Interactive Discussion
EGU
analysis is shown in Fig. 4c. For December the accumulated ozone loss is 5±1 DU in the vertical column of Θ=454–550 K. By day 75 the column loss between Θ=407 and 501 K (corresponding to Θ=400–500 K at the end of March, about 16–21 km) reached 56±4 DU. This quantity is the difference between the actually observed ozone abundance and the total ozone column that would have been present in the absence
5
of chemical loss for identical dynamics (i.e. the quantity column [O3*-O3] as defined in Rex et al., 2002). This loss estimate can be directly compared to ozone loss es-timates based on the difference between passive ozone from a transport model and ozone values that are actually observed or that are the results from a 3D chemical transport model. Note that the column [O3*-O3] is different from the overall number
10
of molecules destroyed in a vertical column of air during the winter (i.e. the quantity column [-dO3/dtchem] as defined by Rex et al., 2002), because air masses may leave or enter the vertical column due to average poleward or equatorward motion, even if no mixing across the edge of the polar vortex occurs. The loss in the partial column covered here is a lower limit for the ozone loss in the total column. The loss in the
15
region above the covered vertical range is probably very small, because accumulated losses at the upper edge of the covered region are already small (cf. Fig. 4a). We may have missed ozone loss in the region below 400 K, which could contribute to the total column loss. Christensen et al. (2005) suggest that around 15 DU additional loss may have occurred betweenΘ=350–400 K.
20
To check whether the major warming during January cancelled the quality criteria which sort out air parcels that had been exposed to mixing processes, a bivariate regression was calculated for the time period of 5 January 2004–31 January 2004, allowing for ozone change during sunlit and dark periods along the trajectories (Rex et al., 1999):
25
∆O3=LS× tS + LD× tD
where LS and LD are the loss rate during sunlit time and darkness and tS and
tD the time the trajectories spent in sunlight and darkness, respectively. In Jan-uary at Θ=475±10 K, i.e. the period of the highest ozone loss rates we find
ACPD
5, 4311–4333, 2005Match in Arctic winter 2002/2003 M. Streibel et al. Title Page Abstract Introduction Conclusions References Tables Figures J I J I Back Close
Full Screen / Esc
Print Version
Interactive Discussion
EGU LS=−5.8±2.2 ppbv/sunlit hour and LD=0.6±0.6 ppbv/dark hour. Hence, during dark
periods ozone was conserved along the trajectories, suggesting that our approach was not significantly influenced by dynamical effects during that time.
4. Uncertainty
The uncertainties stated above are 1σ uncertainties not including potential systematic
5
effects. A discussion of systematic uncertainties of the Match approach is given in Rex et al. (1998).
4.1. Impact of the grid resolution of the meteorological input data
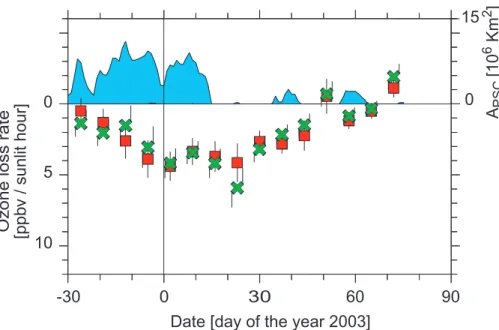
Until this winter the grid resolution of the meteorological input data used for the trajec-tory calculation of the Match analysis was 2.5◦×2.5◦. This files have become available
10
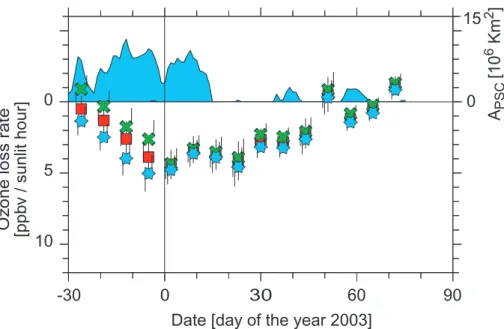
in the higher grid resolution of 1.25◦×1.25◦. In order to make sure that a change in the grid resolution does not affect the continuity of the Match time series a comparison be-tween two analyses using the files with lower and higher grid resolution was performed. In Fig. 5 the result is shown which indicates that higher grid resolution does not change the derived ozone loss rates significantly.
15
4.2. Sensitivity on diabatic cooling rates
The sensitivity on systematic errors in the diabatic cooling rates, which have been cal-culated by the SLIMCAT radiation scheme MIDRAD, depends on the average vertical gradient in the ozone mixing ratio profile, which varies from year to year and during the season. The sensitivity was generally small for most of the winters during the past
20
decade but contributed significantly to the overall uncertainty for the winter 1991/1992 (Rex et al., 1998). The strong dynamic activity in winter 2002/2003 caused a greater variability in the cooling rates compared to previous winters. The sensitivity of derived ozone losses on the diabatic cooling rates for the winter 2002/2003 are shown in Fig. 6.
ACPD
5, 4311–4333, 2005Match in Arctic winter 2002/2003 M. Streibel et al. Title Page Abstract Introduction Conclusions References Tables Figures J I J I Back Close
Full Screen / Esc
Print Version
Interactive Discussion
EGU
While for most of the period the sensitivity of calculated ozone losses on the cooling rates is small, the cooling rate variation has a large impact on derived ozone losses in December. During this month the loss rates calculated with cooling rates reduced to 50% are smaller but stay within the 1σ uncertainty of the original rates. When the cooling rates are increased by the factor 1.5, the derived ozone loss rates are also lying
5
within 1σ statistical uncertainty.
4.3. Trajectory quality criteria symmetric in time
Terao et al. (2002) modified the original Match approach to use it with data from the Improved Limb Atmospheric Spectrometer (ILAS) for the Arctic winter 1996/97. They introduced an additional match radius, the backward match radius as explained in
10
Sect. 1. In our sensitivity study all quality criteria which belong to the forward trajectory are applied additionally to a corresponding cluster of backward trajectories, such that the Match approach becomes symmetric in time.
The central trajectory of each cluster started at the coordinates of the second sonde measurement of the respective match event. The cluster was set up in the same way
15
as the standard forward trajectory cluster. However, the backward trajectories were triggered on a vertical grid with 5 K vertical resolution. Hence, the potential tempera-ture of the start point of the backward trajectory may differ by up 2.5 K potential tem-perature from the level of the ozonesonde measurement. With this procedure two different match radii are calculated for one match: (a) the forward match radius (see
20
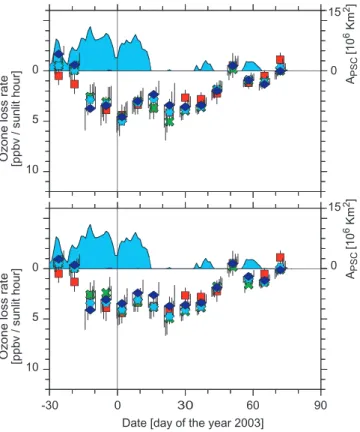
Sect. 1), and (b) the backward match radius. We have used the information from (a) and (b) in two different ways. First, a threshold value is introduced for the backward match radius, similar to the standard threshold of 500 km for the forward match radius. Figure 7a shows the results for different choices of this new threshold value: 600 km (green crosses, 251 matches), 500 km (blue stars, 230 matches) and 400 km (blue
di-25
amonds, 191 matches). The original loss rates from the standard analysis are shown by red squares (405 matches). Second, the radii (a) and (b) were added up to give a combined match radius, for which a new threshold value is defined, which replaces
ACPD
5, 4311–4333, 2005Match in Arctic winter 2002/2003 M. Streibel et al. Title Page Abstract Introduction Conclusions References Tables Figures J I J I Back Close
Full Screen / Esc
Print Version
Interactive Discussion
EGU
the individual threshold for both match radii. Results for various choices of the thresh-old for the combined match radius are shown in Fig. 7b: 1000 km (green crosses, 273 matches), 800 km (light blue stars, 227 matches), 700 km (dark blue diamonds, 188 matches). Again the reference data is given as red squares.
Although the use of the backward trajectories has a large impact on the number of
5
used match events, both, the loss rates and their uncertainties are quite robust and do not change significantly.
4.4. Correction for matches which are not statistically independent
The Match analysis is based on linear regression analyses of ozone change versus sunlit time from a number of individual match events. The slope of the linear regression
10
gives the ozone loss rate, while the calculated statistical uncertainty of the slope is stated as statistical uncertainty of the loss rate. The standard regression analysis and uncertainty estimations assume that the errors of the individual match events are statistically independent and normally distributed and that their variances are equal.
However, the assumption of statistical independence is not fulfilled because an
indi-15
vidual ozonesonde measurement can contribute to more than one match event within a linear regression analysis. Lehmann et al. (2004) developed an approach to estimate the uncertainty of the ozone loss rates derived from a sample of matches with statis-tically dependent errors. Whether the estimated uncertainty increases or decreases compared to the former approach (which ignores the dependencies), depends on the
20
precise distribution of sondes in the sample of match events. But in most cases the derived uncertainty increases. All error bars stated in this paper are based on that new approach. For loss rates at theΘ=475 K level we found an average increase of about 14% of the calculated uncertainty compared to the former approach which is shown in Table 2. This is in good agreement with the numbers presented in Lehmann
25
ACPD
5, 4311–4333, 2005Match in Arctic winter 2002/2003 M. Streibel et al. Title Page Abstract Introduction Conclusions References Tables Figures J I J I Back Close
Full Screen / Esc
Print Version
Interactive Discussion
EGU
5. Summary and discussion
Significant ozone loss took place in the stratospheric vortex over the Arctic in win-ter 2002/2003. This winwin-ter is characwin-terised by a cold beginning which led to ozone loss of ∼5 DU in December and 56 DU at the end of the campaign in mid-March for the partial column ofΘ=453–550 K and 400–500 K, respectively. Accumulated loss of
5
1.2–1.6 ppmv was found in the layers of air descending toΘ=400–475 K spring equiv-alent temperatures. This loss is moderate compared to 1.0–2.8 ppmv loss found in winter 1999/2000 with the Match approach for the upper mentioned levels. The sensi-tivity study of different grid resolution of the used meteorological data for the trajectory calculation showed that the change to a higher horizontal grid resolution does not
af-10
fect the results significantly. Therefore the continuity of the Match time series, which includes 12 winters, is conserved. Moreover it was shown that the implementation of a backward trajectory check into the ozonesonde Match approach as an additional quality criterion result in similar loss rates and error bars.
Goutail et al. (2005) derived ozone loss from the comparison of measurements of
15
the SAOZ Network, a network of UV-visible spectrometers, to calculations of passive ozone by the chemical transport model (CTM) REPROBUS. A column loss of 6–8% was found until end of December, which corresponds to approximately 28–38 DU. This value is high compared to the value derived from Match. One reason for the difference is the slightly different definition of the vortex edge. Moreover, UV-visible spectrometers
20
depend on light. Hence, mainly the vortex edge was probed during December in the Goutail et al. (2005) study. It is reasonable to assume that ozone loss during December was more pronounced in the more sunlit vortex edge region, but it is unlikely that this effect can fully explain the differences for the December period. For January to March the accumulated ozone loss is ∼12–14% or 56–66 DU which is in agreement with our
25
partial column result of about 51 DU for the same period.
Singleton et al. (2005) used the passive ozone of the SLIMCAT CTM and measure-ments of the satellite based instrument POAM III to derive chemical ozone loss. By
mid-ACPD
5, 4311–4333, 2005Match in Arctic winter 2002/2003 M. Streibel et al. Title Page Abstract Introduction Conclusions References Tables Figures J I J I Back Close
Full Screen / Esc
Print Version
Interactive Discussion
EGU
March the maximum accumulated ozone loss obtained by this method is 1.2 ppmv for the air masses descending toΘ=425 K. Match found an ozone loss of 1.5±0.2 ppmv at that level. At most levels betweenΘ=400–500 K the results from Singleton et al. (2005) suggest slightly smaller ozone losses than Match. However, the results agree within their respective uncertainties.
5
Acknowledgements. We are grateful to the staff at the ozonesonde stations who participated
in the Arctic Match campaign 2002/03 for numerous timely started ozonesondes. We thank the European Centre for Medium-Range Weather Forecast (ECMWF) and the German Weather Of-fice (DWD) for providing the meteorological data and the EC for funding the project “Quantitative Understanding of Ozone losses by Bipolar Investigations” (QUOBI) (EVK2-CT-2001-00129).
10
References
Christensen, T., Knudsen, B., Streibel, M., et al.: Vortex-averaged Arctic ozone depletion in the winter 2002/2003, Atmos. Chem. Phys., 5, 131–138, 2005,
SRef-ID: 1680-7324/acp/2005-5-131.
Goutail, F., Pommereau, J.-P., Lef `evre, F., et al.: Early unusual ozone loss during the Arctic
15
winter 2002/2003 compared to other winters, Atmos. Chem. Phys., 5, 665–677, 2005,
SRef-ID: 1680-7324/acp/2005-5-665.
Hansen, D. R. and Mauersberger, K.: Laboratory studies of nitric acid trihydrate: Implications for the south polar stratosphere, Geophys. Res. Lett., 15, 855–858, 1988.
Lehmann, R., von der Gathen, P., Rex, M., and Streibel, M.: Statistical analysis of the precision
20
of the Match method, Atmos. Chem. Phys. Discuss., 5, 3225–3268, 2005,
SRef-ID: 1680-7375/acpd/2005-5-3225.
Naujokat, B. and Grunow, K.: The stratospheric Arctic winter 2002/03: Balloon flight planning by trajectory calculations, Proceedings of the 16th ESA Symposium on European Rocket and Balloon Programmes and Related Research, St. Gallen 2003 (ESA SP-530), 421–425,
25
2003.
Rex, M., Harris, N. R. P., von der Gathen, P., et al.: Prolonged stratospheric ozone loss in the 1995/96 Arctic winter, Nature, 389, 835–838, 1997.
ACPD
5, 4311–4333, 2005Match in Arctic winter 2002/2003 M. Streibel et al. Title Page Abstract Introduction Conclusions References Tables Figures J I J I Back Close
Full Screen / Esc
Print Version
Interactive Discussion
EGU
Rex, M., von der Gathen, P., Harris, N. R. P., et al.: In-situ measurements of stratospheric ozone depletion rates in the Arctic winter 1991/1992: A Lagrangian approach, J. Geophys. Res., 103(D5), 5843–5853, 1998.
Rex, M., von der Gathen, P., Braathen G. O., et al.: Chemical ozone loss in the Arctic winter 1994/95 as determined by the Match technique, J. Atmos. Chem., 32(1), 35–59, 1999.
5
Rex, M., Salawitch, R. J., Harris, N. R. P., et al.: Chemical loss of Arctic ozone in winter 1999/2000, J. Geophys. Res., 107(D20), 8276, doi:10.1029/2001JD000533, 2002.
Rex, M., Salawitch, R. J., Santee, M. L., et al.: On the unexplained stratospheric ozone losses during cold Arctic Januaries, Geophys. Res. Lett., 30(1), 1008, doi:10.1029/2002GL016008, 2003.
10
Singleton, C. S., Randall, C. E., Chipperfield, M. P., et al.: 2002–2003 Arctic ozone loss de-duced from POAM III satellite observations and the SLIMCAT chemical transport model, Atmos. Chem. Phys., 5, 597–609, 2005,
SRef-ID: 1680-7324/acp/2005-5-597.
Terao, Y., Sasano, Y., Nakajima, H., et al.: Stratospheric ozone loss in the 1996/1997 Arctic
15
winter: Evaluation based on multiple trajectory analysis for double-sounded air parcels by ILAS, J. Geophys. Res., 107(D24), 8210, doi:10.1029/2001JD000615, 2002.
von der Gathen, P., Rex, M., Harris, N. R. P., et al.: Observational evidence for chemical ozone depletion over the Arctic in winter 1991–92, Nature, 375, 131–134, 1995.
WMO: Scientific Assessment of Ozone Depletion: 2002, ISBN 92-807-2261-1, 2003.
ACPD
5, 4311–4333, 2005Match in Arctic winter 2002/2003 M. Streibel et al. Title Page Abstract Introduction Conclusions References Tables Figures J I J I Back Close
Full Screen / Esc
Print Version
Interactive Discussion
EGU Table 1. Values used to define the vortex edge during December and early January. Between
the given days the PV values are linearly interpolated.
Date normalized PV
[day of the year 2003] [s−1]
−33 28 −26 30 −19 31 −12 32 −5 33 2 34 9 36 75 36
ACPD
5, 4311–4333, 2005Match in Arctic winter 2002/2003 M. Streibel et al. Title Page Abstract Introduction Conclusions References Tables Figures J I J I Back Close
Full Screen / Esc
Print Version
Interactive Discussion
EGU Table 2. Change of the statistical uncertainty of the loss rates by taking the dependence of
match events into account atΘ=475 K. Column 1: day of the year 2003. Column 2: ozone loss rate. Column 3: estimation of the statistical uncertainty of the ozone loss rate neglecting dependencies between match events. Column 4: estimation of the statistical uncertainty of the ozone loss rate taking dependencies between match events into account. Column 5: ratio of column 4/column 3.
date loss rate statistical uncertainty statistical uncertainty column 4/ [day of the year 2003] [ppbv/sunlit hour] (old) (new) column 3
[ppbv/sunlit hour] [ppbv/sunlit hour]
−26 −0.49 0.88 0.88 1.00 −19 −1.32 0.89 0.95 1.07 −12 −2.6 1.11 1.22 1.10 −5 −3.89 1.30 1.31 1.01 2 −4.39 0.95 1.01 1.06 9 −3.36 0.83 0.92 1.11 16 −3.70 0.88 1.06 1.20 23 −4.15 1.07 1.35 1.26 30 −2.65 0.63 0.75 1.19 37 −2.82 0.54 0.67 1.24 44 −2.24 0.91 1.04 1.14 51 0.53 1.08 1.21 1.12 58 −1.18 0.54 0.57 1.06 65 −0.51 0.46 0.53 1.15 72 1.12 0.49 0.66 1.35
ACPD
5, 4311–4333, 2005Match in Arctic winter 2002/2003 M. Streibel et al. Title Page Abstract Introduction Conclusions References Tables Figures J I J I Back Close
Full Screen / Esc
Print Version Interactive Discussion EGU AB AL AT CA CH DB ED EU GB HP HO JA JO KB KE KI LN LE LI MS NA OR PA PR RS SA SC SO TL TH UC VA YA
ACPD
5, 4311–4333, 2005Match in Arctic winter 2002/2003 M. Streibel et al. Title Page Abstract Introduction Conclusions References Tables Figures J I J I Back Close
Full Screen / Esc
Print Version Interactive Discussion EGU 0 0 0 0 0 0 Relative location % edge core 0 20 60 80 100 40 -30 0 30 60 90
Date [day of the year 2003]
Fig. 2. Distribution of match events within the polar vortex (Θ=475±10 K). Relative location is
normalized PV scaled such that equal intervals of this quantity correspond to equal areas of the vortex. Hence, the homogeneity of the sampling of the PV-space can be assessed. Relative location of 100% is the vortex edge, 0% is the vortex core.
ACPD
5, 4311–4333, 2005Match in Arctic winter 2002/2003 M. Streibel et al. Title Page Abstract Introduction Conclusions References Tables Figures J I J I Back Close
Full Screen / Esc
Print Version Interactive Discussion EGU (c) 475 K 253834 24 41 85 83 48 84 90 31 19 59 76 48 (e) 450 K 28 47 38 26 38 63 73 487677 30 23 57 84 61 (g) 425 K 43 57 39 62 55 21 27 52 75 56 (a) 500 K 11 21 24 20 41 89 81 42 57 64 27 15 53 68 47 (d) 475 K (f) 450 K (h) 425 K (b) 500 K APSC [10 6 km 2] 0 80 60 40 20 Oz one loss r a te [ppb v / da y] -30 0 30 60 90
Date [day of the year]
-30 0 30 60 90
Date [day of the year] 15 10 0 5 Oz one loss sunlit hour ] rate [ ppbv / 0 80 60 40 20 0 80 60 40 20 0 80 60 40 20 Oz one loss r a te [ppb v / da y] Oz one loss r a te [ppb v / da y] Oz one loss r a te [ppb v / da y] 15 10 0 5 15 10 0 5 15 10 0 5 Oz one loss sunlit hour ] rate [ ppbv / Oz one loss sunlit hour ] rate [ ppbv / Oz one loss sunlit hour ] rate [ ppbv / APSC [10 6 km 2] APSC [10 6 km 2] APSC [10 6 km 2]
Fig. 3. Ozone loss rates at the indicated levels in ppbv per sunlit time (left hand panels), and
ppbv per day (right hand panels). The loss rates represent the results of linear regressions through sets of individual match events in ±7 day and ±10 K potential temperature bins. Error bars are 1σ statistical uncertainties of the regression coefficients. The numbers in the lower part of the left-hand panels give the number of individual match events that were used in the respective linear regression. The area of possible PSC existence (AP SC) is also indicated for
ACPD
5, 4311–4333, 2005Match in Arctic winter 2002/2003 M. Streibel et al. Title Page Abstract Introduction Conclusions References Tables Figures J I J I Back Close
Full Screen / Esc
Print Version Interactive Discussion EGU (a) 0 0 5 1 0 1 5 2 0 (b) 30 0 30 60 90 0 0 0 0 (c) 0.0 1.0 2.0 550 400 450 500 Potential temperature [K] 0 90 -30 0 60
Date [day of the year 2003] 0
20 40 60 Accumulated ozone loss
[DU] [ppmv] 0.0 2.0 0.5 1.0 1.5 Accumulated ozone loss [ppmv] 3
Fig. 4. Panel (a): temporal evolution of the accumulated ozone loss in subsiding air masses
derived from Match, panel(b): profile of the accumulated ozone loss on 16 March (day 75),
panel(c): ozone loss in DU obtained by vertical integration of the accumulated ozone loss
shown in panel (a) for each given day for the subsiding air masses with spring equivalent potential temperature of 400–500 K at the end of March.
ACPD
5, 4311–4333, 2005Match in Arctic winter 2002/2003 M. Streibel et al. Title Page Abstract Introduction Conclusions References Tables Figures J I J I Back Close
Full Screen / Esc
Print Version Interactive Discussion EGU 10 0 5 [ppb v / sunlit hour] Oz
one loss rate
-30 0 30 60 90
Date [day of the year 2003]
15 0 APSC [10 6 Km 2 ]
Fig. 5. Comparison of ozone loss rates atΘ=475±10 K based on different resolutions of the
meteorological data used for the trajectory calculations. Red squares show the results for 1.25◦×1.25◦horizontal resolution, green crosses for 2.5◦×2.5◦ resolution.
ACPD
5, 4311–4333, 2005Match in Arctic winter 2002/2003 M. Streibel et al. Title Page Abstract Introduction Conclusions References Tables Figures J I J I Back Close
Full Screen / Esc
Print Version
Interactive Discussion
EGU
-30 0 30 60 90
Date [day of the year 2003] 10 0 5 [ppb v / sunlit hour] Oz
one loss rate
15 0 APSC [10 6 Km 2 ]
Fig. 6. Sensitivity of the Match results to diabatic cooling rates used in the Match analysis.
Loss rates per sunlit hour atΘ=475±10 K are shown. Red squares: reference (same data as shown in Fig. 3c), green crosses: cooling rates are multiplied by a constant factor of 0.5, light blue stars: cooling rates are multiplied by a constant factor of 1.5.
ACPD
5, 4311–4333, 2005Match in Arctic winter 2002/2003 M. Streibel et al. Title Page Abstract Introduction Conclusions References Tables Figures J I J I Back Close
Full Screen / Esc
Print Version Interactive Discussion EGU 10 0 5 [ppb v / sunlit hour] Oz
one loss rate
10 0 5 [ppb v / sunlit hour] Oz
one loss rate
10 0 5 [ppb v / sunlit hour] Oz
one loss rate
-30 0 30 60 90
Date [day of the year 2003]
15 0 APSC [10 6 Km 2] 15 0 APSC [10 6 Km 2]
Fig. 7. Effect of the introduction of a backward match radius in addition to the forward match
ra-dius atΘ=475±10 K. Panel (a): analyses using two thresholds for the two match radii. The for-ward match radius is kept constant at 500 km whereas the backfor-ward match radius is changed. Red squares: reference (same data as shown in Fig. 3c), green crosses: maximum allowed backward match radius= 600 km, light blue stars: 500 km, dark blue diamonds: 400 km. Panel
(b): analyses using a threshold for the sum of forward and backward match radius. Red squares
reference (same data as shown in Fig. 3c), green crosses: combined match radius= 1000 km, light blue stars: 800 km, dark blue diamonds: 700 km.