HAL Id: hal-00295661
https://hal.archives-ouvertes.fr/hal-00295661
Submitted on 1 Jun 2005
HAL is a multi-disciplinary open access
archive for the deposit and dissemination of
sci-entific research documents, whether they are
pub-lished or not. The documents may come from
teaching and research institutions in France or
abroad, or from public or private research centers.
L’archive ouverte pluridisciplinaire HAL, est
destinée au dépôt et à la diffusion de documents
scientifiques de niveau recherche, publiés ou non,
émanant des établissements d’enseignement et de
recherche français ou étrangers, des laboratoires
publics ou privés.
Rapid meridional transport of tropical airmasses to the
Arctic during the major stratospheric warming in
January 2003
A. Kleinböhl, J. Kuttippurath, M. Sinnhuber, B.-M. Sinnhuber, H. Küllmann,
K. Künzi, J. Notholt
To cite this version:
A. Kleinböhl, J. Kuttippurath, M. Sinnhuber, B.-M. Sinnhuber, H. Küllmann, et al.. Rapid meridional
transport of tropical airmasses to the Arctic during the major stratospheric warming in January 2003.
Atmospheric Chemistry and Physics, European Geosciences Union, 2005, 5 (5), pp.1291-1299.
�hal-00295661�
SRef-ID: 1680-7324/acp/2005-5-1291 European Geosciences Union
Chemistry
and Physics
Rapid meridional transport of tropical airmasses to the Arctic
during the major stratospheric warming in January 2003
A. Kleinb¨ohl1,*, J. Kuttippurath1, M. Sinnhuber1, B.-M. Sinnhuber1, H. K ¨ullmann1, K. K ¨unzi1, and J. Notholt1
1Institute of Environmental Physics, University of Bremen, Bremen, Germany *now at: Jet Propulsion Laboratory, Pasadena, CA, USA
Received: 2 April 2004 – Published in Atmos. Chem. Phys. Discuss.: 3 November 2004 Revised: 3 March 2005 – Accepted: 9 April 2005 – Published: 1 June 2005
Abstract. We present observations of unusually high val-ues of ozone and N2O in the middle stratosphere that were
observed by the airborne submillimeter radiometer ASUR in the Arctic. The observations took place in the meteorologi-cal situation of a major stratospheric warming that occurred in mid-January 2003 and was dominated by a wave 2 event. On 23 January 2003 the observed N2O and O3mixing ratios
around 69◦N in the middle stratosphere reached maximum values of ∼190 ppb and ∼10 ppm, respectively. The similari-ties of these N2O profiles in a potential temperature range
be-tween 800 and 1200 K with N2O observations around 20◦N
on 1 March 2003 by the same instrument suggest that the observed Arctic airmasses were transported from the tropics quasi-isentropically. This is confirmed by 5-day back trajec-tory calculations which indicate that the airmasses between about 800 and 1000 K had been located around 20◦N 3–5
days prior to the measurement in the Arctic. Calculations with a linearized ozone chemistry model along calculated as well as idealized trajectories, initialized with the low-latitude ASUR ozone measurements, give reasonable agreement with the Arctic ozone measurement by ASUR. PV distributions suggest that these airmasses did not stay confined in the Arc-tic region which makes it unlikely that this dynamical situa-tion lead to the formasitua-tion of dynamically caused pockets of low ozone.
1 Introduction
Stratospheric warmings are a common feature in the Arctic stratosphere (e.g. Andrews et al., 1987), and have also been found in the Antarctic stratosphere, recently in connection with a split of the Antarctic ozone hole in Southern hemi-sphere winter 2002 (e.g. Sinnhuber et al., 2003). Manney
Correspondence to: A. Kleinb¨ohl
(armin.kleinboehl@jpl.nasa.gov)
et al. (1994) described the evolution of the Arctic vortex dur-ing two stratospheric warmdur-ings in 1993 in which wave 1 was dominant, leading to a displacement of the vortex from the pole. It was shown that low-latitude air was drawn to high lat-itudes into the developing anticyclone. Further work showed that these events could lead to the formation of low ozone pockets in the middle stratosphere at pressure levels between 5 and 15 hPa (Manney et al., 1995). These low ozone pock-ets were located inside the anticyclone and revealed ozone mixing ratios comparable to inner vortex values. Morris et al. (1998) showed that the underlying mechanism of these low ozone pockets was the confinement of the airmasses at high latitudes long enough (in the order of weeks), such that ozone loss towards the photochemical equilibrium could oc-cur. Variability of mid-stratospheric ozone related to plane-tary wave activity was also studied using ground-based ob-servations in the Arctic (Sinnhuber et al., 1999) and at mid-latitudes (Calisesi et al., 2001).
In the following we report measurements of unusually high mixing ratios of N2O and ozone in the Arctic middle
stratosphere by the airborne submillimeter radiometer ASUR during a major stratospheric warming in January 2003 that was dominated by wave 2 and lead to a split of the polar vortex. The measurements are compared with measurements in the tropics by the same instrument, to determine the ori-gin of these airmasses, and trajectory calculation will be per-formed to estimate a timescale for this transport to the Arctic. The estimated timescale will be checked for consistency us-ing calculations with a simple ozone chemistry model along trajectories. Eventually the development of the meteorologi-cal situation is studied with a focus on the formation of low ozone pockets.
1292 A. Kleinb¨ohl et al.: Rapid meridional transport -135 -90 -45 0 45 90 135 180 80 70
Jan. 19, 2003
-135 -90 -45 0 45 90 135 180 80 70 60 -135 -90 -45 0 45 90 135 180 80 70 60Jan. 22, 2003
-135 -90 -45 0 45 90 135 180 80 70 60 -135 -90 -45 0 45 90 135 180 80 70 60Jan. 23, 2003
-135 -90 -45 0 45 90 135 180 80 70 60 -135 -90 -45 0 45 90 135 180 80 70 60Jan. 26, 2003
475K
-135 -90 -45 0 45 90 135 180 80 70 60950K
5 10 15 20 25 30 35 40 45 50MPV [PVU]
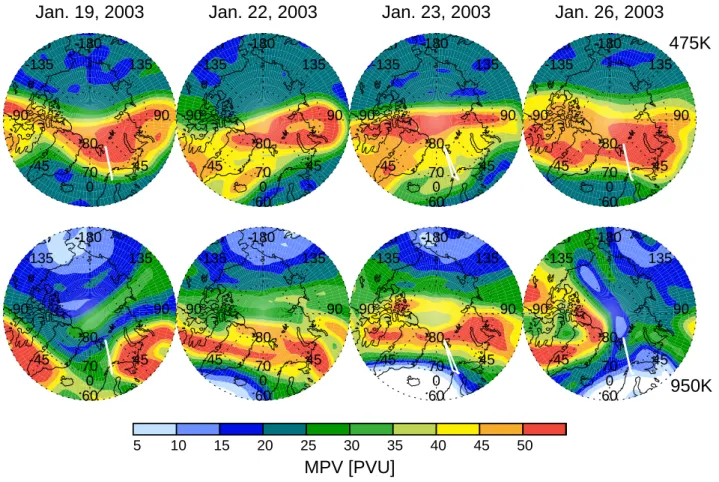
Fig. 1. Maps of modified potential vorticity at a potential temperature of 475 K (∼19 km, top) and 950 K (∼33 km, bottom) on 19 January,
22 January, 23 January, and 26 January 2003 derived from analyses by the European Centre for Medium range Weather Forecast (ECMWF). The reference level for the modified PV is 475 K. The thick white lines indicate the flight paths of the Falcon aircraft on the days where flights were performed.
2 The ASUR instrument
Measurements of N2O and ozone were performed by the
Air-borne SUbmillimeter Radiometer ASUR (von K¨onig et al., 2000). ASUR is a passive heterodyne radiometer. It uses a liquid helium cooled SIS (superconductor-insulator-superconductor) detector (Mees et al., 1995) and operates in single sideband mode, covering a frequency range from 604.3 to 662.3 GHz in which continuous tuning is possible. For spectral analysis of the signals, an acousto-optical spec-trometer (AOS) with a band width of 1.5 GHz and a resolu-tion of 1.5 MHz is used (Rosolen et al., 1994). The ASUR instrument is designed to operate on board an aircraft flying near the tropopause to avoid signal absorption due to tropo-spheric water vapor.
The pressure broadening of the detected emission lines al-lows the retrieval of vertical profiles of volume mixing ra-tio (VMR) of the measured species in an altitude range of about 15 to 50 km, with a typical vertical resolution of 6– 8 km in the lower stratosphere, increasing to about 12–15 km in the middle and upper stratosphere (Bremer et al., 2002).
To achieve a sufficient signal-to-noise ratio, the individually measured spectra are integrated over a time span of about 100 s in the case of ozone, and about 150 s in the case of N2O.
These time spans include calibration measurements and cor-respond to horizontal distances of about 20 and 30 km at typ-ical aircraft speeds. The retrieval is based on the optimal es-timation method (Rodgers, 1976, 1990) and was described in more detail in Bremer et al. (2002).
During winter and spring 2003 the ASUR instrument was deployed on board of the German research aircraft FAL-CON. In the framework of the European polar stratospheric cloud and lee wave experiment (EUPLEX) nine research flights were undertaken in the Arctic between 14 January and 12 February 2003. During the Sciamachy validation and utilization experiment (SCIA-VALUE) measurements in the tropics were performed between 19 February and 3 March 2003, followed again by measurements in the Arctic between 10 and 19 March 2003. ASUR was looking to the starboard side of the aircraft with a constant elevation angle of 12◦.
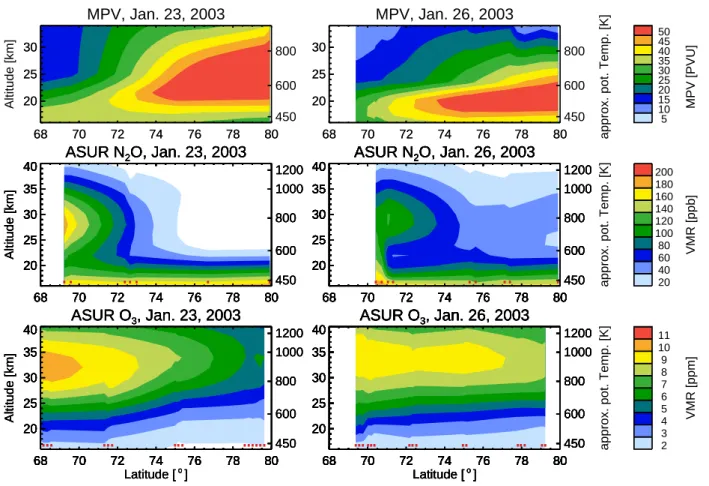
MPV, Jan. 23, 2003 68 70 72 74 76 78 80 20 25 30 Altitude [km] 68 70 72 74 76 78 80 20 25 30 450 600 800 ASUR N2O, Jan. 23, 2003 68 70 72 74 76 78 80 20 25 30 35 40 Altitude [km] 68 70 72 74 76 78 80 20 25 30 35 40 450 600 800 1000 1200 ASUR N2O, Jan. 23, 2003 68 70 72 74 76 78 80 20 25 30 35 40 Altitude [km] 68 70 72 74 76 78 80 20 25 30 35 40 450 600 800 1000 1200 ASUR N2O, Jan. 23, 2003 68 70 72 74 76 78 80 20 25 30 35 40 Altitude [km] 68 70 72 74 76 78 80 20 25 30 35 40 450 600 800 1000 1200 ASUR N2O, Jan. 23, 2003 68 70 72 74 76 78 80 20 25 30 35 40 Altitude [km] 68 70 72 74 76 78 80 20 25 30 35 40 450 600 800 1000 1200 ASUR O3, Jan. 23, 2003 68 70 72 74 76 78 80 Latitude [ o ] 20 25 30 35 40 Altitude [km] 68 70 72 74 76 78 80 20 25 30 35 40 450 600 800 1000 1200 ASUR O3, Jan. 23, 2003 68 70 72 74 76 78 80 Latitude [ o ] 20 25 30 35 40 Altitude [km] 68 70 72 74 76 78 80 20 25 30 35 40 450 600 800 1000 1200 ASUR O3, Jan. 23, 2003 68 70 72 74 76 78 80 Latitude [ o ] 20 25 30 35 40 Altitude [km] 68 70 72 74 76 78 80 20 25 30 35 40 450 600 800 1000 1200 ASUR O3, Jan. 23, 2003 68 70 72 74 76 78 80 Latitude [ o ] 20 25 30 35 40 Altitude [km] 68 70 72 74 76 78 80 20 25 30 35 40 450 600 800 1000 1200 MPV, Jan. 26, 2003 68 70 72 74 76 78 80 20 25 30 68 70 72 74 76 78 80 20 25 30 450 600 800
approx. pot. Temp. [K]
MPV [PVU] 5 10 15 20 25 30 35 40 45 50 ASUR N2O, Jan. 26, 2003 68 70 72 74 76 78 80 20 25 30 35 40 68 70 72 74 76 78 80 20 25 30 35 40 450 600 800 1000 1200 ASUR N2O, Jan. 26, 2003 68 70 72 74 76 78 80 20 25 30 35 40 68 70 72 74 76 78 80 20 25 30 35 40 450 600 800 1000 1200 ASUR N2O, Jan. 26, 2003 68 70 72 74 76 78 80 20 25 30 35 40 68 70 72 74 76 78 80 20 25 30 35 40 450 600 800 1000 1200 ASUR N2O, Jan. 26, 2003 68 70 72 74 76 78 80 20 25 30 35 40 68 70 72 74 76 78 80 20 25 30 35 40 450 600 800 1000 1200 ASUR N2O, Jan. 26, 2003 68 70 72 74 76 78 80 20 25 30 35 40 68 70 72 74 76 78 80 20 25 30 35 40 450 600 800 1000 1200
approx. pot. Temp. [K]
VMR [ppb] 20 40 60 80 100 120 140 160 180 200 ASUR O3, Jan. 26, 2003 68 70 72 74 76 78 80 Latitude [ o ] 20 25 30 35 40 68 70 72 74 76 78 80 20 25 30 35 40 450 600 800 1000 1200 ASUR O3, Jan. 26, 2003 68 70 72 74 76 78 80 Latitude [ o ] 20 25 30 35 40 68 70 72 74 76 78 80 20 25 30 35 40 450 600 800 1000 1200 ASUR O3, Jan. 26, 2003 68 70 72 74 76 78 80 Latitude [ o ] 20 25 30 35 40 68 70 72 74 76 78 80 20 25 30 35 40 450 600 800 1000 1200 ASUR O3, Jan. 26, 2003 68 70 72 74 76 78 80 Latitude [ o ] 20 25 30 35 40 68 70 72 74 76 78 80 20 25 30 35 40 450 600 800 1000 1200 ASUR O3, Jan. 26, 2003 68 70 72 74 76 78 80 Latitude [ o ] 20 25 30 35 40 68 70 72 74 76 78 80 20 25 30 35 40 450 600 800 1000 1200
approx. pot. Temp. [K]
VMR [ppm] 2 3 4 5 6 7 8 9 10 11
Fig. 2. Left: Modified PV from ECMWF analyses along the line of sight of the ASUR instrument (top), ASUR measurements of N2O
(middle), and ASUR ozone measurements (bottom) during the flight on 23 January 2003 on the flight leg from Spitsbergen to Kiruna. Right: ECMWF MPV, ASUR N2O, and ASUR ozone during the flight on 26 January 2003. The small red tick marks on the bottom of the
measurement contour plots indicate the position of the individual measurements.
3 Observations
3.1 Meteorological situation
The vortex situation in the Arctic winter 2002/2003 was char-acterized by very low temperatures and a very strong vortex already in late November 2002. The low temperatures per-sisted until the end of December when a minor warming in the upper stratosphere occurred. In the lower stratosphere, however, the temperature distribution was hardly disturbed and the vortex remained strong and stable (EORCU, 2003).
This situation changed around mid-January 2003 when a major stratospheric warming took place in the Arctic. The criteria for a major warming, a positive temperature gradi-ent between 60◦N and the pole together with a reversal of the mean zonal winds at 60◦N at a pressure level of 10 hPa (∼825 K potential temperature) from westerly to easterly were fulfilled on 18 January 2003 (EORCU, 2003). Figure 1 shows maps of the modified potential vorticity (MPV) at the potential temperature levels of 475 K (∼19 km) and 950 K (∼33 km) for four days between 19 and 26 January 2003.
MPV is a concept of potential vorticity in which the expo-nential variation with altitude, as found in the formulation of Ertel’s potential vorticity, is removed (Lait, 1994). It can be clearly seen that the warming was accompanied by strong planetary wave 2 activity that led to a split of the vortex on 19 January 2003. The vortex was strongly sheared with al-titude. At 950 K the airmasses above Kiruna had higher PV than the airmasses close to Spitsbergen. On 22 January 2003 the two vortex parts had re-merged on both potential temper-ature levels. At 950 K airmasses with high PV had moved northwards and air with very low MPV values (<5 PVU) had moved to the North Atlantic region, reaching 70◦N on 23 January 2003. On 26 January 2003 the vortex had split again on the 950 K level and airmasses with an MPV around 10–15 PVU had moved further northwards over Spitsbergen and across the pole.
3.2 Arctic observations
The FALCON with the ASUR instrument undertook flights from Kiruna to Spitsbergen and back to Kiruna on 19, 23, and
1294 A. Kleinb¨ohl et al.: Rapid meridional transport
50
100
150
200
250
N
2O VMR [ppb]
600
800
1000
1200
Potential temperature [K]
0
2
4
6
8
10
12
O
3VMR [ppm]
600
800
1000
1200
Fig. 3. Black dash-dotted lines: ASUR N2O profile (left) and O3profile (right) of averaged ASUR measurements on 19 January 2003 inside
the vortex using a vortex edge at 475 K. The dashed lines represent the standard deviation. Black solid lines: ASUR N2O measurement at
69.2◦N, 20.2◦E (left) and ASUR O3measurement at 68.6◦N, 20.3◦E (right) on 23 January 2003. The dotted lines represent the statistical
error derived from the measurement noise. Gray lines: ASUR N2O measurement at 17.5◦N, 8.1◦E (left) and ASUR O3measurement at 20◦N, 8.8◦E (right) on 1 March 2003. The dotted lines represent the statistical error derived from the measurement noise.
26 January 2003. The flight tracks are shown in the maps in Fig. 1.
Figure 2 shows a latitudinal cross section of the ASUR N2O measurements on 23 January 2003 during the flight leg
from Spitsbergen to Kiruna. The latitudinal variation up to about 20 km altitude is small, the N2O mixing ratios are
typ-ical for Arctic vortex profiles after significant descent of the airmasses. Between 76◦N and 73◦N a strong increase of N2O with decreasing latitude starts to occur, and N2O values
of almost 200 ppb are reached at altitudes between 25 and 30 km around 69◦N. This behavior is qualitatively correlated
with a decrease in the MPV of the airmasses at these alti-tudes, which decreases from about 50 PVU to about 15 PVU during this flight leg.
Figure 2 also shows the latitudinal cross section of the ASUR O3 measurements during the same flight leg. Peak
mixing ratios between 5 and 6 ppm at around 80◦N increase with decreasing latitude to values above 10 ppm around 68◦N.
A similar information is shown in Fig. 2 for the flight on 26 January 2003. Again high N2O mixing ratios in the
mid-dle stratosphere are qualitatively correlated with low values of MPV, though the N2O mixing ratios reach only ∼140 ppb
in the maximum. Airmasses with N2O mixing ratios around
80 ppb had moved to the region around 80◦N. The ozone observed in the middle stratosphere is more homogeneous compared to the flight from 23 January 2003, with maximum mixing ratios around 8–9 ppm.
The profile with the maximum peak value in N2O on the
flight from 23 January 2003 is shown in detail in the left part
of Fig. 3 on a potential temperature scale. The lowermost part of the profile is determined by a decrease in N2O, as it
can be expected in the Arctic stratosphere at these altitudes. For comparison an averaged profile of measurements inside the vortex at a potential temperature of 475 K from the flight on 19 January 2003 is also shown. Up to a potential tempera-ture level of about 500 K (∼20 km) the profiles are basically identical. Above this level the N2O mixing ratio in the profile
from 23 January 2003 starts to rise, peaking at about 750 K (∼28 km) with a mixing ratio of 193 ppb. Above this peak the mixing ratio decreases again.
The ozone measurement closest to the N2O profile from
23 January 2003 was located at 68.6◦N. It is shown in the
right part of Fig. 3, together with an average of measure-ments inside the vortex at a potential temperature of 475 K on 19 January 2003. Around 450 K the ozone profile from 23 January 2003 is identical with the average from 19 Jan-uary 2003. Above this altitude the profile from 23 JanJan-uary 2003 exceeds the profile from 19 January 2003 and reaches its maximum of about 10.5 ppm around 900 K.
3.3 Comparison with tropical measurements
To study the origin of these unusual N2O mixing ratios in
the Arctic, the profile has been compared with measurements obtained during flights of the second phase of the SCIA-VALUE campaign, which took place between mid-February and mid-March 2003 (Fix et al., 2005). During this cam-paign latitudinal cross sections ranging from about 80◦N in the Arctic to about 5◦S in the tropics were flown. A profile
which is very similar to the upper part of the Arctic profile from 23 January 2003 was found on a flight on 1 March 2003 from Douala, Cameroon to Tozeur, Tunisia, at 17.5◦N.
Fig-ure 3 shows this profile in comparison with the Arctic pro-file. The agreement between 800 K (∼29 km) and 1200 K (∼39 km) is striking, considering that these two measure-ments were separated by more than 50◦in latitude.
The very good agreement between the N2O measurement
in the tropics and the Arctic measurement on 23 January 2003 above 800 K suggests that the origin of these airmasses was in the tropics, and that they were transported to the Arc-tic by meridional transport. Due to the very good agree-ment between the Arctic N2O profile measured on 23
Jan-uary 2003 and the tropical N2O profile we conclude that this
transport did not deviate strongly from isentropic transport. This is plausible as the timescales for the transport are only in the order of days and the net cooling rate in the middle stratosphere at mid-latitudes is in the order of 1 K/d in winter (Andrews et al., 1987). It is noted that due to the altitude res-olution of the ASUR measurement tropical airmasses down to an altitude around 25 km (∼650 K) would be required to result in a peak structure as observed, assuming that the re-trieved ASUR profile in the tropics reflects the shape of the true tropical profile sufficiently well. However, it is possible that the shape of the profile below about 800 K could also be caused by contributions of airmasses transported from re-gions in mid-latitudes.
To study the variation in ozone the profile next to the trop-ical measurement of N2O was considered. It was located at
20◦N and is shown in Fig. 3. Above 550 K the profile from 23 January 2003 is very similar to the tropical ozone profile measured on 1 March 2003. Above about 900 K the two pro-files start to deviate from each other, and at 1200 K the tropi-cal profile exceeds the Arctic profile by about 1 ppm. As the lifetime of ozone is in the order of days around 40 km and in the order of weeks around 30 km altitude (e.g. Brasseur and Solomon, 1986), the similarity of the Arctic and tropical O3profiles leads to the conclusion, that the quasi-isentropic
transport must have occurred rather rapidly to preserve most of the ozone between 30 and 40 km.
4 Model calculations
4.1 Trajectory calculations
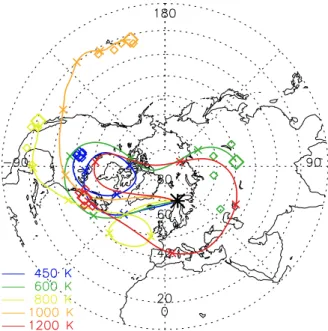
To study the origin of the airmasses observed in the Arctic on 23 January 2003 calculations of back trajectories were per-formed using the model described by Schoeberl and Spar-ling (1994). The trajectories were calculated on five differ-ent potdiffer-ential temperature levels and started along the field of view of the ASUR ozone measurement at 68.6◦N, 20.3◦E on 23 January 2003. For comparison trajectories were also calculated from locations 0.5◦north and south as well as 1.5◦ east and west of the field of view of the measurement. The
Fig. 4. Backward trajectories calculated from meteorological data
by the Goddard Data Assimilation Office. The trajectories were started on 23 January 2003 along the line of sight of the ASUR measurement at 68.6◦N, 20.3◦E at potential temperatures of 450 K (blue), 600 K (green), 800 K (yellow), 1000 K (orange), 1200 K (red). The crosses mark the air parcel positions in intervals of one day. The large diamonds show the air parcel positions after five days while the small diamonds indicate the 5-day positions of air parcels initialized 0.5◦north or south, or 1.5◦east or west of the measurement.
trajectories were calculated using meteorological data by the Goddard Data Assimilation Office.
Figure 4 shows the calculated back trajectories over five days. It can be seen that the airmasses at 450 K potential temperature originate in the vortex region, as expected from the observed N2O volume mixing ratios. This is supported
by a comparison to the potential vorticity maps in Fig. 1 which show an elongated vortex stretching over Greenland to North-eastern Canada. It is further shown that the different initialized airparcels stay in close proximity to each other. At 600 K the trajectory shows that the airmasses had been mov-ing around the Arctic in proximity of the vortex and were located over Asia around 50–60◦ latitude five days before the measurement. It has to be noted that the trajectories of the different airparcels initialized close to the measurement at this potential temperature level had started to diverge after five days of backward calculation. Calculating further leads some trajectories back towards the pole again, others farther south to regions around 30–40◦latitude after two more days (not shown).
The trajectories at 800 and 1000 K show that the airmasses at these altitudes originated in the tropics at about 20◦ lati-tude. The 1000 K trajectory had reached this latitude after
1296 A. Kleinb¨ohl et al.: Rapid meridional transport 6 7 8 9 10 11 12 O3 VMR [ppm] 600 700 800 900 1000 1100 1200 Potential temperature [K] 6 7 8 9 10 11 12 O3 VMR [ppm] 600 700 800 900 1000 1100 1200 6 7 8 9 10 11 12 O3 VMR [ppm] 600 700 800 900 1000 1100 1200
Fig. 5. Model calculations of ozone mixing ratios after transport along trajectories assuming different initial profiles (dark gray lines, left: ozone profile measured at 20◦N; right: ozone profile measured at 15◦N; middle: ozone profile interpolated to 17.5◦N). Black dotted lines: resulting profile assuming a transport on idealized trajectories in 3 days. Black dashed lines: resulting profile assuming a transport on idealized trajectories in 5 days. Black dash-dotted lines: resulting profile for transport on calculated trajectories (comp. Fig. 4). Black solid lines: resulting profile for transport on calculated trajectories, assuming an initial profile measured at 46◦N below 700 and above 1100 K. The light gray shaded area indicates the expected ozone derived from the measurements on 23 January 2003.
calculating three days backward, for the 800 K trajectory it was 4–5 days. Divergence of the different airparcel initial-izations exists after 4–5 days but is small in latitudinal di-rection. In contrast, the trajectory at 1200 K suggests that the airmasses had circled once around the pole in the five day pe-riod considered in Fig. 4, and were located in close proximity to each other between 40 and 50◦latitude.
For comparison calculations were also performed using a different meteorological data set (UKMO). While agreeing in the latitudes of origin of the airmasses, differences between the actual trajectory paths and in the divergence were ob-served, revealing some uncertainty in the calculation of the actual airmass trajectory in this complicated meteorological situation.
4.2 Modeling of the ozone change
To further assess the consistency between the N2O and O3
measurements on 23 January 2003 and the suggested airmass origins by the trajectory calculations a simple model of lin-earized ozone chemistry (LINOZ) (McLinden et al., 2000) is used.
Some care has to be taken concerning the start and end profiles of ozone, as the ozone measurements shown in Fig. 3 were not exactly co-located with the N2O measurements, and
significant ozone gradients between different measurements exist. In the tropics ozone measurements are available at lati-tudes of 20◦N and 15◦N which will be considered as a lower and upper limit, respectively. Additionally a calculation was performed with an initial profile obtained from an interpola-tion between these two ozone measurements. In the Arctic the ozone measurement closest to the N2O measurement in
Fig. 3 is located 0.6◦to the south and will be considered as
an upper limit. The closest ozone measurement to the north is significantly farther away, so an interpolation to a location 0.6◦north of the N2O measurement seems to be a reasonable
estimate for a lower ozone limit.
Model calculations were performed along the trajectories shown in Fig. 4 in a way that the 600 K trajectory was con-sidered for potential temperatures below 700 K, the 800 K trajectory between 700 and 900 K, the 1000 K trajectory between 900 and 1100 K, and the the 1200 K trajectory above. The calculations were initialized with the measured profiles as described above. To account for mid-latitude ori-gins of the airmasses around 600 and 1200 K, another run was performed with an initial ozone profile measured by ASUR in late-February 2003 around 46◦N for potential tem-perature levels below 700 and above 1100 K. Due to some uncertainty of the trajectories in this complicated meteoro-logical situation, model calculations were also performed to simulate transport along idealized trajectories from 20◦N to 70◦N. Transport times of 3 and 5 days were assumed, respec-tively. The vertical spacing for the calculations corresponded to 2 km. Figure 5 shows the results of the model calcula-tions using the different initial profiles. The expected ozone mixing ratios around the N2O measurement from 23 January
2003 are displayed as shaded areas in light gray. The result-ing profiles were convolved to the altitude resolution of the ASUR ozone measurements by using the appropriate averag-ing kernel functions (Bremer et al., 2002).
Using the lowest initial profile (left plot in Fig. 5) best agreement with the Arctic profile is achieved with the ideal-ized trajectory that transports the airmasses from the tropics to the Arctic in only three days. The transport along the cal-culated trajectories with the full tropical initial profile as well as along the 5-day idealized trajectory yield ozone mixing
ratios that are nearly identical. However, with lowest ini-tial profile they are too low at potenini-tial temperatures above 850 K. Concerning the initialization with the mid-latitude profile at high and low altitudes, little difference to the ini-tialization with tropical profiles is evident between 1000 and 1200 K. This is caused by the fact that the ozone maximum of the mid-latitude profile, though lower in volume mixing ratio, is located at a higher altitude than the maximum of the tropical profile. This results in very similar ozone mix-ing ratios around 1100–1200 K for both profiles. We note that the significant difference between both profiles around 800 K is caused by the low ozone values of the mid-latitude initial profile around 700 K which remain nearly unchanged due to the long life time of ozone at these altitudes. The con-volution of the model profile with the averaging kernels of the ASUR measurement results in a decrease of ozone VMR also at higher altitudes.
With the intermediate start profile (center plot in Fig. 5) best agreement is achieved with the transport along the calcu-lated trajectory as well as with the 5-day idealized trajectory, which is nearly identical again. The modeled profile agrees well with the Arctic observation in the range from 750 K up to 1200 K.
The start profile in the upper limit (right plot in Fig. 5) yields too high ozone mixing ratios with three days of trans-port on an idealized trajectory. Also the modeled ozone along the calculated trajectories shows higher mixing ratios, in par-ticular below 900 K, as does the modeled ozone along the 5-day idealized trajectory, which is slightly higher. However, in this scenario the modeled profile with the mid-latitude initial-ization at low and high altitudes reveals very good agreement between about 700 and 1100 K.
4.3 Error discussion
As the initial profiles were derived from ASUR ozone mea-surements the true initial profiles might deviate from the measured profile shape due to the altitude resolution of the measurement. Sensitivity studies using the climatological ozone mixing ratios of the LINOZ model suggest that the de-viations due to altitude resolution should be less than 0.6 ppm below 40 km.
The runs shown in Fig. 5 were performed with climatolog-ical temperatures and ozone columns taken from the LINOZ model. To test the sensitivity on the ozone column, runs on idealized trajectories were performed where the ozone col-umn was calculated from the initial profile, and successively from the modeled profile after each time step. The modeled deviations were less than 0.1 ppm below 30 km and less than 0.25 ppm below 40 km, which do not change the results sig-nificantly.
To test the sensitivity on the temperature profiles runs on idealized trajectories with climatological temperatures from the LINOZ model increased by 5 K and decreased by 10 K were performed. These values were chosen as they reflect
the maximum deviations of the climatological profiles from synoptic temperature profiles from analyses by the Data As-similation Office (DAO) at the ASUR measurement locations in the tropics and in the Arctic, respectively. The run with in-creased temperature did not show significant deviations, only with the highest initial ozone profile the results showed a bet-ter fit to a transport time of five days on an idealized trajec-tory. In the run with decreased temperatures the profile shape was less well reproduced. Deviations up to 800 K poten-tial temperature were negligible, further above the calculated ozone values became higher than with the original tempera-tures, with a maximum deviation at 1200 K of ∼0.5 ppm in the case of the low initial ozone profile and ∼0.8 ppm in the case of the high initial ozone profile.
Another consideration in terms of sensitivity is the accu-racy of the ASUR measurements, which is estimated to be 15%. As most of the ozone comparisons with other measure-ments indicate that ASUR ozone measuremeasure-ments are rather on the high side (Bremer et al., 2002), a test run with ASUR ozone decreased by 15% was performed. Similar to the run with decreased temperatures the observed profile shape was less well reproduced by the model. Up to a potential temper-ature of ∼900 K the behavior did not change significantly, above ∼1000 K one would have to assume longer transport times (∼7–10 days) to fit the measurements.
Recent work that compared LINOZ simulations to calcula-tions with other linearized ozone schemes formulated doubts about the appropriateness of the LINOZ scheme for upper stratospheric studies (McCormack et al., 2004). While this seems the case for mid-stratospheric airmasses largely con-fined at high latitudes it is not obvious for the case in which mid-latitude airmasses were transported towards the pole, in particular at timescales of 4–5 days where LINOZ gives very reasonable results (comp. Fig. 11 in McCormack et al. (2004)). As the latter case is the most comparable to the sit-uation studied in this work it seems unlikely that uncertain-ties or inaccuracies in the LINOZ coefficients should have a larger impact than the other error sources discussed above. 4.4 Development of the meteorological situation
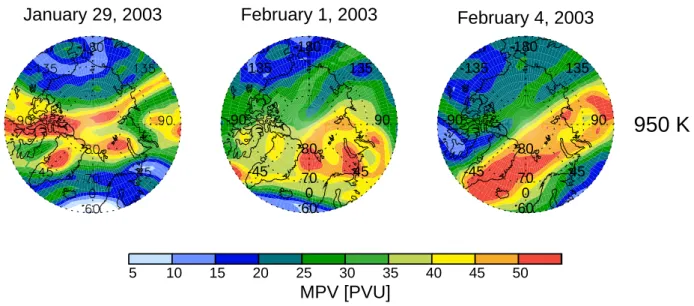
To study the development of the situation, maps of modi-fied PV up to 4 February 2003 are considered. The mor-phology of the situation is of particular interest concerning the formation of low ozone pockets, which can be caused by confinement of airmasses in anticyclones at high latitudes and subsequent ozone destruction towards the photochemical equilibrium.
Already in the map of MPV at 950 K from 26 January 2003 (Fig. 1) it can be seen that the feature of low PV air-masses moving into the North Atlantic was moving south-wards and only a filament was moving northsouth-wards over the pole. This leads to a rather homogeneous ozone distribution in the middle stratosphere along the flight track, as observed by ASUR in Fig. 2.
1298 A. Kleinb¨ohl et al.: Rapid meridional transport
January 29, 2003
-135 -90 -45 0 45 90 135 180 80 70 60February 1, 2003
-135 -90 -45 0 45 90 135 180 80 70 60February 4, 2003
950 K
5 10 15 20 25 30 35 40 45 50MPV [PVU]
Fig. 6. Maps of modified PV for 29 January, and 1, 4 February 2003 at a potential temperature level of 950 K from ECMWF analyses. The
reference level for the modified PV is 475 K.
Figure 6 shows that by 29 January the area with low PV has moved further south again and on 1 February no air-masses with PV lower than 15 PVU are found over Scandi-navia north of 60◦N. Similarly, the anticyclone over Alaska
and Eastern Siberia, well developed around 19 and 23 Jan-uary, gets disturbed by 26 January and moves eastwards and southwards around 1 February, such that only little air with PV lower than 15 PVU is found north of 60◦N by 4 February 2003.
It can be concluded that the confinement of airmasses at polar latitudes which is necessary for the formation of low ozone pockets was not realized after the stratospheric warm-ing in mid-January 2003, likely related to the planetary wave 2 activity present, and the resulting movement of airmasses between Arctic and mid-latitude regions.
5 Conclusions
During the wave 2 dominated major stratospheric warming in January 2003 in the Arctic unusually high mixing ratios of ozone and N2O were observed by ASUR in the middle
strato-sphere (∼25–40 km). The maximum N2O mixing ratios
ob-served during a flight between 68◦and 80◦N on 23 January
2003 in the Arctic were nearly identical to mixing ratios mea-sured around 20◦N on 1 March 2003 above about 800 K
po-tential temperature. The observed ozone values correspond-ing to these N2O measurements in the Arctic were very
simi-lar to their tropical counterparts between 600 and 900 K, and started to decrease slowly above. In the lower stratosphere (∼20 km) the values of N2O and ozone remained typical for
Arctic conditions.
From the very good agreement between the N2O mixing
ratios observed in the Arctic and in the tropics between 800
and 1200 K (∼29–39 km) it can be concluded that the air-masses must have been transported from the tropics to the Arctic by rapid quasi-isentropic transport. To reproduce the observed structure in N2O transport from lower latitudes had
to occur on isentropic levels down to about 650 K (∼25 km). Calculations of 5-day back trajectories from the Arctic measurements at 68.6◦N, 20.3◦E on 23 January 2003
in-dicate that in a potential temperature range between about 800 and 1000 K the airmasses indeed had been drawn from a latitude of about 20◦N into the Arctic on a timescale of 3–5 days. At levels of 600 and 1200 K the trajectories in-dicate that the airmasses had rather been located at latitudes between 40◦and 50◦N five days prior to the measurement in the Arctic.
Model studies using a linearized ozone chemistry along the calculated trajectories as well as on a set of idealized trajectories at different altitudes and initialized with ASUR ozone measurements around 20◦N reveal good agreement with the measured ozone in the Arctic with the suggested transport times of 3–5 days. When a mid-latitude origin for the airmasses below 700 K and above 1100 K is assumed, the calculations still give reasonable agreement if the highest of the available tropical ozone profiles is considered for initial-ization between 700 and 1100 K. It can be concluded that the modeled ozone changes confirm the plausibility of this trans-port considering the uncertainties of the input parameters to the model and the uncertainties of the trajectories.
PV maps do not suggest that this wave 2 process lead to the formation of low ozone pockets, in contrast to earlier work by Manney et al. (1995) which dealt with wave 1 dominated stratospheric warmings, as the airmasses were not confined long enough at polar latitudes to allow the development of low ozone pockets.
Acknowledgements. We would like to thank G. N¨aveke for his
assistance prior to the measurement campaigns and the crew of the FALCON aircraft for their support during the campaigns. We are grateful to F. Stroh and the EUPLEX team for the opportunity to participate on board the FALCON during EUPLEX. Thanks also to ECMWF, DAO and UKMO for providing meteorological analyses and in particular to the Goddard Space Flight Center for their trajectory tool. Parts of this work were supported by the German contribution to the ENVISAT validation under contract FKZ 50EE 0022 as part of the ESA proposal A. O. ID 349.
Edited by: U. Platt
References
Andrews, D. G., Holton, J. R., and Leovy, C. B.: Middle atmo-spheric dynamics, Academic press, San Diego, 1987.
Brasseur, G. P. and Solomon, S.: Aeronomy of the middle atmo-sphere, D. Reidel Publishing Company, Dordrecht, 1986. Bremer, H., von K¨onig, M., Kleinb¨ohl, A., K¨ullmann, H., K¨unzi,
K., Bramstedt, K., Burrows, J. P., Eichmann, K.-U., We-ber, M., and Goede, A. P. H.: Ozone depletion observed by the Airborne Submillimeter Radiometer (ASUR) during the Arctic winter 1999/2000, J. Geophys. Res., 107, 8277, doi:10.1029/2001JD000546, 2002.
Calisesi, Y., Wernli, H., and K¨ampfer, N.: Midstratospheric ozone variability over bern related to planetary wave activity during the winters 1994–1995 to 1998–1999, J. Geophys. Res., 106, 7903– 7916, 2001.
EORCU: The northern hemisphere stratosphere in the 2002/03 win-ter, Tech. rep., European Ozone Research Coordination Unit, available under http://www.ozone-sec.ch.cam.ac.uk/, 2003. Fix, A., Ehret, G., Flentje, H., Poberaj, G., Gottwald, M.,
Finken-zeller, H., Bremer, H., Bruns, M., Burrows, J. P., Kleinb¨ohl, A., K¨ullmann, H., Kuttippurath, J., Richter, A., Wang, P., Heue, K.-P., Platt, U., Pundt, I., and Wagner, T., SCIAMACHY validation by aircraft remote sensing: design, execution, and first measure-ment results of the SCIA-VALUE mission, Atmos. Chem. Phys., 5, 1273–1289, 2005,
SRef-ID: 1680-7324/acp/2005-5-1273.
Lait, L. R.: An alternative form for potential vorticity, J. Atmos. Sci., 15, 1754–1759, 1994.
Manney, G. L., Zurek, R. W., O’Neill, A., Swinbank, R., Kumer, J. B., Mergenthaler, J. L., and Roche, A. E.: Stratospheric warm-ings during february and march 1993, Geophys. Res. Lett., 21, 813–816, 1994.
Manney, G. L., Froidevaux, L., Waters, J. W., Zurek, R. W., Gille, J. C., Kumer, J. B., Mergenthaler, J. L., Roche, A. E., O’Neill, A., and Swinbank, R.: Formation of low-ozone pockets in the middle stratospheric anticyclone during winter, J. Geophys. Res., 100, 13 939–13 950, 1995.
McCormack, J. P., Eckermann, S. D., Coy, L., Allen, D. R., Kim, Y.-L., Hogan, T., Lawrence, B., Stephens, A., Browell, E. V., Burris, J., McGee, T., and Trepte, C. R.: NOGAPS-ALPHA model sim-ulations of stratospheric ozone during the SOLVE 2 campaign, Atmos. Chem. Phys., 4, 2401–2423, 2004,
SRef-ID: 1680-7324/acp/2004-4-2401.
McLinden, C. A., Olson, S. C., Hannegan, B., Wild, O., Prather, M. J., and Sundet, J.: Stratospheric ozone in 3-D models: A sim-ple chemistry and the cross-tropopause flux, J. Geophys. Res., 105, 14 653–14 665, 2000.
Mees, J., Crewell, S., Nett, H., de Lange, G., van den Stadt, H., Kuipers, J. J., and Panhuyzen, R. A.: ASUR – an airborne SIS receiver for atmospheric measurements of trace gases at 625 to 760 GHz, IEEE Trans. Microwave Theory Tech., 43, 2543–2548, 1995.
Morris, G. A., Kawa, S. R., Douglas, R. A., Schoeberl, M. R., Froidevaux, L., and Waters, J.: Low-ozone pockets explained, J. Geophys. Res., 103, 3599–3610, 1998.
Rodgers, C. D.: Retrieval of atmospheric temperature and composi-tion from remote measurements of thermal radiacomposi-tion, Rev. Geo-phys. Space Phys., 14, 609–624, 1976.
Rodgers, C. D.: Characterization and error analysis of profile re-trieval from remote sounding measurements, J. Geophys. Res., 95, 5587–5595, 1990.
Rosolen, C., Dierich, P., Michet, D., Lecacheaux, A., Palacin, F., Robiliard, R., Rigeaud, F., and Vola, P.: Wideband acousto op-tical spectrometer, Final report on workpackage 2411, submil-limeter limb sounder breadboarding, ESA, 1994.
Schoeberl, M. R. and Sparling, L. C.: Trajectory modeling, in: Di-agnostic tools in atmospheric physics, Proc. S.I.F. Course CXVI, edited by: Fiocco, G. and Visconti, G., North-Holland, Amster-dam, 1994.
Sinnhuber, B.-M., M¨uller, R., Bovensmann, H., Eyring, V., Klein, U., Langer, J., Trentmann, J., Burrows, J. P., and K¨unzi, K.: In-terpretation of mid-stratospheric arctic ozone measurements us-ing a photochemical box-model, J. Atmos. Chem., 34, 281–290, 1999.
Sinnhuber, B.-M., Weber, M., Amankwah, A., and Burrows, J. P.: Total ozone during the unusual antarctic winter of 2002, Geo-phys. Res. Lett., 30, 1580, doi:10.1029/2002GL016798, 2003. von K¨onig, M., Bremer, H., Eyring, V., Goede, A., Hetzheim, H.,
Kleipool, Q., K¨ullmann, H., and K¨unzi, K.: An airborne submm radiometer for the observation of stratospheric trace gases, in: Microwave Radiometry and Remote Sensing of the Earth’s Sur-face and Atmosphere, edited by: Pampaloni, P. and Paloscia, S., VSP Utrecht, 409–415, 2000.