HAL Id: hal-00316255
https://hal.archives-ouvertes.fr/hal-00316255
Submitted on 1 Jan 1996
HAL is a multi-disciplinary open access
archive for the deposit and dissemination of sci-entific research documents, whether they are pub-lished or not. The documents may come from teaching and research institutions in France or abroad, or from public or private research centers.
L’archive ouverte pluridisciplinaire HAL, est destinée au dépôt et à la diffusion de documents scientifiques de niveau recherche, publiés ou non, émanant des établissements d’enseignement et de recherche français ou étrangers, des laboratoires publics ou privés.
Anomalous echoes observed with the EISCAT UHF
radar at 100-km altitude
E. Malnes, N. Bjørnå, T. L. Hansen
To cite this version:
E. Malnes, N. Bjørnå, T. L. Hansen. Anomalous echoes observed with the EISCAT UHF radar at 100-km altitude. Annales Geophysicae, European Geosciences Union, 1996, 14 (12), pp.1328-1342. �hal-00316255�
Correspondence to: E. Malnes
Ann. Geophysicae 14, 1328—1342 (1996) ( EGS — Springer-Verlag 1996
Anomalous echoes observed with the EISCAT UHF radar
at 100-km altitude
E. Malnes, N. Bjørnat , T. L. Hansen
Auroral Observatory, University of Tromsø, N-9037 Tromsø, Norway Received: 10 January 1996/Revised: 18 June 1996/Accepted: 20 June 1996
Abstract. We have observed a number of strong echoes with the European incoherent-scatter (EISCAT) UHF (930-MHz) radar at angles 83.5° and 78.6° with the geomagnetic field and at about 100-km altitude north in the auroral zone. The echoes are shortlived and occur in single 2- or 10-s data dumps. They are offset by 125—130 kHz with respect to the transmitted frequency. In most cases the offset compares well with the frequency of gyro lines in the incoherent-scatter spectrum, as given by the standard linear dispersion relation. But sometimes the measured offsets deviate significantly from the model cal-culations, and the interpretation in terms of gyro lines becomes questionable. The discrepancy could possibly be explained by local deviations in the magnetic field from the model (IGRF 1987), which are generated by incoming particle beams. A more serious problem with the gyro-line theory is how the line can be excited at altitudes where the collisional damping is substantial. The high intensity and short lifetime of the signal point to a fast-growing plasma instability as the likely excitation mechanism, if the gyro-line interpretation is correct. The cause of the instability could be the same particle beams as those causing the disturbances in the magnetic field. Alternatively, the ob-servations may be interpreted as meteor head echoes. The large Doppler shifts, the short lifetimes and the altitudes of the signals support this explanation. The main difficulty is that the distribution of measured offsets appears to be different in magnetically active conditions and in less active conditions. Also, the occurrence of echoes does not seem to follow the expected changes in meteor density. More observations in different conditions are needed to decide between the two interpretations. As it is, we are inclined to believe in the meteor head echo theory, the objections to the gyro-line theory being more funda-mental.
1 Introduction
In a series of experiments with the EISCAT UHF (930-MHz) radar we have observed a number of strong short-lived sporadic echoes coming from about 100-km altitude, when the radar is pointing at low elevation to the north or north-east. The pointing directions correspond to angles 78.6° and 83.5° between the scattering wave vector and the geomagnetic field at 100 km.
The echoes are Doppler shifted typically 125—350 kHz from the transmitted frequency which corresponds to scattering from a wave structure or an object moving with a velocity of 20—56 km s~1 along the radar beam. We feel convinced that the echoes are of atmospheric origin and believe there are only two possible candidates of physical phenomena that can explain the observations. Either the signals must be strongly enhanced gyro lines in the spec-trum of incoherent scatter, or they must be so-called meteor head echoes. However, there are problems with both interpretations. The Doppler shift of the echoes does not always correspond to the expected offset of gyro lines in the spectrum. Also, it is difficult to understand what could be the source behind such strongly enhanced short-lived gyro-line signals. One problem with the meteor interpretation is why signals are not more frequent when the meteor density is high. Also, it is difficult to explain that echoes from the same altitude sometimes occur simul-taneously in non-overlapping receiver channels.
The first observations were made in August 1989 dur-ing an intense polar-cap absorption (PCA) event. It was then believed that the phenomenon was enhanced gyro-line signals and that the enhancement mechanism was somehow related to the PCA. Also, it was believed that the strongly disturbed ionospheric conditions could ac-count for the discrepancy that sometimes existed between observed and calculated offsets. However, later experi-ments in moderately or little disturbed conditions show similar echoes which sometimes occur at unexpected off-sets.
A complicating factor in the interpretation of the 1989 data is that the observations fall within the pass of the
Perseids meteor shower, albeit near the end of the pass when the intensity is low. The geocentric velocity of the Perseids is about 60 km s~1, which corresponds to a max-imum Doppler shift of about 370 kHz. Thus, the Doppler shift is compatible with the observed frequency shifts, which makes meteor head echoes a possible interpreta-tion.
Since 1989 a series of experiments has been conducted in various conditions in order to gain more information about the nature of the signals and to be able to decide between the two interpretations. However, it is difficult to be conclusive even from the new material. One reason is that even at times when there are no meteor swarms, there will be background meteors present in the ionosphere. Such sporadic meteors occur randomly in time and direc-tion.
This paper describes the experiments, reports the ob-servations and finally discusses the experimental results in terms of the gyro-line and meteor theories. First we give an introduction to the theories.
1.1 Gyro lines
For scattering at an angle with the magnetic field, the spectrum of incoherent scatter from the ionosphere con-tains three distinct components: the ion lines at the ion acoustic frequency, the plasma lines at about the local plasma frequency and the gyro lines at an intermediate frequency of a few hundred kHz depending on the scatter-ing geometry. Ion lines and plasma lines are due to scat-tering by ion acoustic waves and electrostatic plasma waves (Langmuir waves), respectively. Gyro lines are asso-ciated with another electrostatic wave mode, the large
k limiting form of the whistler mode. The lines were first
predicted by Salpeter (1961), who used the general term ‘resonance lines’. Later Behnke and Hagen (1978) intro-duced the name ‘whistler lines’. The name ‘gyro lines’ was introduced by Bjørnat et al. (1990). Like the plasma-line resonance, the gyro-line resonance is predicted by cold plasma theory. Standard derivation for a magnetized elec-tron plasma shows that a plasma wave parallel to the magnetic field splits into two wave modes when deviation from the parallel direction is allowed, giving rise to two pairs of spectral lines, the plasma lines and the gyro lines. For a weakly magnetized plasma (X2e;u2pe) the fre-quency of the wave mode associated with the gyro lines is ug+Xecosa, where Xe and upe are the electron gyro and plasma frequencies, respectively, and a is the angle be-tween the magnetic field and the direction of propagation. A more accurate formula can be derived from kinetic theory (Trulsen and Bjørnat , 1978)
u2g"X2ecos2a
C
1#11 4k2v25)%
X2e !u2peX2e sin2 a
D
. (1) This formula is valid under the conditions of weak damp-ing and the assumptionsk2v25)%;X2e;u2pe, me
mi;cos2 a;1, (2)
where k is the wave number, v5)% is the electron thermal velocity and me and mi are the electron and ion masses, respectively. Trulsen and Bjørnat (1978) also derive the formula for the opposite case of a strong magnetic field (X2e<u2pe) and give the damping of the wave in both cases. The latter condition in Eq. 2 states that the direc-tion of propagadirec-tion must not be too close to parallel, in which case the damping becomes strong, or too close to perpendicular, in which case the ion motion must be taken into account. The former condition in Eq. 2 is not satisfied everywhere in the ionosphere. Assuming a magnetic field of 5 · 10~5 tesla we find that the condition on the electron density is ne<2.5 · 1010 m~3. For backscatter with the EISCAT UHF (930-MHz) radar, the condition on the electron temperature is ¹e;3.3 · 103 K. More details on the formation and the properties of the gyro lines can be found in the references above. In particular, Trulsen and Bjørnat (1978) calculated numerically the enhancement of the lines due to the interaction between the scattering wave and suprathermal electrons. Since then, a more detailed study of this wave-particle mechanism has been carried out by Malnes and Bjørnat (1993). The mechanism is similar to the more familiar excitation mechanism for plasma lines.
Observations of gyro lines have been reported by Be-hnke and Hagen (1978) for the Arecibo (430-MHz) radar and by Bjørnat et al. (1990) for the EISCAT VHF (224-MHz) radar. These observations were made under stable ionospheric conditions and the signal could be post-integ-rated over a long time; 1—2 h were necessary to see the line. However, in a later experiment by Malnes et al. (1993) with the EISCAT VHF radar, the gyro lines could be seen after integration times of only a few minutes, mainly due to a much shorter interpulse period than in earlier experi-ments. The experiment reports both gyro lines excited by photoelectrons and lines excited by secondary electrons during particle precipitation. Due to the stronger Landau damping at shorter wavelengths, photoelectron-enhanced gyro lines are only marginally observable by the EISCAT UHF (930-MHz) radar and would require very long inte-gration times and stable conditions.
1.2 Meteor head echoes
When entering the ionosphere, meteors collide with air molecules and produce ionization. Radio waves are total-ly reflected if the electron density in the vicinity of the meteor or in the trail behind is high enough, which corre-sponds to the plasma frequency being larger than the radar frequency. Meteors have been detected by HF radars since the 1940s, but only recently by incoherent-scatter radars. Pellinen-Wannberg and Wannberg (1994) studied a number of meteor echoes seen by the EISCAT radars. They found that echoes are quite frequent, typi-cally of order ten per hour. They also interpreted three-quarters of their observations as meteor head echoes.
The meteors are from time to time very frequent and can often be traced back to a point in the sky, the radiant, where their paths seem to originate. Such meteor streams, as for example the Perseids, move around the Sun in
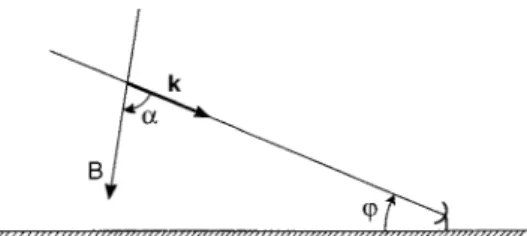
Fig. 1. Scattering geometry.u is the antenna elevation and a the angle between the magnetic field B and the backscatter wave vector
k. Antenna pointings and receiver filter settings are given in Table 1
elliptical orbits. They are produced when comets pass nearby the Sun and debris is ejected. There will be a strong peak in intensity of meteors when the Earth passes the orbit of comets. The velocities of the meteors are deter-mined by the elliptical orbits and will generally be be-tween the respective escape velocities of the Sun and the Earth.
The Perseids meteor shower has been extensively ob-served, both visually and by meteor radar. Activity curves based on 25 years of radar observations are given by Lindblad and S[ imek (1985). The shower maximum is on 11—12 August each year; the time is highly predictable and varies by less than a day. The Perseids is one of the strongest meteor showers with a peak value which is a factor 5—10 above the density of background meteors and a half width which is about one day. Meteor radar observations in general show a daily variation which depends on the zenith angle of the radiant. Since a large zenith angle implies a longer trajectory and hence a small-er local electron density, it will gensmall-erally be less probable to detect echoes when the radiant is near the horizon. The radiant of the Perseids is always well above the horizon at northern latitudes and varies little as a function of local time. It should, however, be noticed that meteor radar observations are not always compatible with the observa-tions with incoherent-scatter radars, since IS radars are sensitive to much smaller meteors. In Pellinen-Wannberg and Wannberg (1994) the difference in the meteor rates at the time of the peak of the Geminid shower and 5 days before and after is only 10—30%. It is believed that this incompatibility is due to the new class of meteors observ-able by IS radars. A study of the Perseids (Pellinen-Wannberg et al., 1996) also indicates a similar increase in the meteor rate near the peak.
There are two types of echoes that can be viewed by a radar. The trail echoes are reflections from the trail left behind the meteor, and are those most commonly referred to in the literature. They are usually fairly long lived and have Doppler shifts that correspond to the neutral-wind velocity in the ionosphere, since the trails are dragged by the neutral wind. The other type of echo, called meteor head echoes, is the reflection from a ball of ionization moving in front of the meteor. The radar will thus measure echoes that are Doppler shifted typically some hundred kHz, depending on the velocity of the meteor and the wavelength of the radar. The head echoes are usually seen at about 100-km altitude. Due to the high speed, the meteors cross the beam in fractions of a second.
It is difficult to address the origin of the head echoes, but the commonly accepted theory claims that they are formed by radar reflections from a ball of ionization moving with the velocity of the meteor. Hawkes and Jones (1975) suggested that the meteors have a composite struc-ture of grains glued together by a material with lower boiling point. As the meteors are heated when they en-counter the ionosphere, the glue will be ablated and the grain is released. The grains will start to rotate as they collide with air molecules, and this causes them to sepa-rate radially. This separation will go on until the radius is about 1 m, before the individual grains start to ablate. Each grain now produces a train of ionization, which
subsequently expands due to ambipolar diffusion. This model explains the typical size of the meteor head with a scattering cross-section corresponding to a radius of 1 m. This explanation is supported by visual and meteor radar observations by Jones and Webster (1991). A recent study by Wannberg et al. (1996) presents new and surpris-ing results from incoherent-scatter studies of meteor echoes. They are able to calculate scattering cross-sections which are of orders of magnitude less than that found in standard meteor studies. They also find that the cross-section increases with transmitter frequency. The authors suggest a new scattering mechanism, coma echoes, re-sponsible for the small cross-sections, and find a qualita-tive agreement with EISCAT UHF and VHF meteor data. Mathews et al. (1996) also find very small cross-sections in a study with the Arecibo (430-MHz) radar.
2 The experiment
All the experiments reported here are backscatter exper-iments with the EISCAT UHF radar. The scattering geometry is shown in Fig. 1 and the most important experimental parameters summarized in Table 1. The first experiment was run on 17 and 18 August 1989 with three different pointing directions for the antenna: northwards (Az"0°) with 30° and 20° elevation and towards north-east (Az"45°) with 10° elevation. We used 300-ls pulses with an interpulse period of 30 ms and peak power 1.5 MW. The integration time was 10 s. The range was 176 to 776 km in steps of 3 km. This covers the height interval 100—250 km for all three geometries. The 1989 experiment was set up to measure gyro lines and this is the interval where we had observed gyro lines in earlier experiments with the EISCAT VHF radar. We used a bank of Butter-worth filters centred 25 kHz apart with a $12.5-kHz bandpass. From the eight receiver channels available, one was used for the ion line, the others for gyro lines. For the geometries with 30° and 20° elevation, the filter bank was distributed between upshifted and downshifted gyro lines. For 10° elevation all the filters used for gyro lines were placed at downshifted frequency offsets. The selection of the offsets was based on model calculations of the gyro line frequencies. Figure 2 gives calculated frequencies be-tween 100- and 120-km altitude.
The experiment was repeated on 17 and 18 August 1993, but the antenna position of Az"0°, El"30° was now skipped, since the 1989 data showed no signals for
Table 1. Antenna azimuth, Az, and elevation, El, together with receiver-filter settings, for the experiments. The # and ! signs denote upshifts and downshifts, respectively, relative to the transmit-ted frequency. Asterisks denote filters with a$25-kHz bandpass. All
the other filters have a $12.5-kHz bandpass. On 26 March the system was not working properly all the time and actually only 3.5 h of data were recorded
Date Time, UT Az, El Filter settings, kHz
(1) 17 Aug. 1989 0952—1153 0, 30 !575, !550, !525, !500, #500, #525, #550
(2) 1205—1618 0, 20 !350, !325, !300, #300, #325, #350
(3) 18 Aug. 1989 0808—1158 45, 10 !275, !250, !225, !200, !175, !150, !125
(4) 17 Aug. 1993 1210—1600 0, 20 Same as (2) plus one filter at #275
(5) 18 Aug. 1993 0835—1200 45, 10 Same as (3)
(6) 11 Aug. 1993 1700—1757 45, 10 Same as (3)
(7) 1803—1900 45, 10 Same as (3) but upshifted
(8) 1909—2053 45, 30 !328, !269, !209, #209, #269, #328, #525 (9) 26 March 1995 0909—1200 45, 10 !225*, !175, !150, #150, #175, #225* (10) 1205—1500 0, 20 !350*, !325, !300, 300, 325, 375* (11) 27 March 1995 1005—1156 0, 20 Same as (10) (12) 1200—1356 45, 10 Same as (9) (13) 18 Aug. 1995 0800—1400 45, 10 !175, !150, !125*, #150, #175, #225*
Fig. 2. Calculated gyro-line resonance frequencies between 100- and 120-km altitude for three different pointings of the antenna. Calcu-lations are based on the IGRF 1987 model for the geomagnetic field together with linear profiles for the electron density ne and temper-ature ¹e; ne"6 ·1010 m~3, ¹e"200 K at 100 km; ne"1011 m~3, ¹e"400 K at 120-km altitude. Zero drift velocity is assumed
this geometry. A similar experiment was also run on 11 August 1993. The main object now was to investigate the possibility that the echoes might be meteor head echoes. In the 1995 experiments the integration time was re-duced to 2 s. The filter bank was distributed between upshifted and downshifted offsets. One receiving filter with a $100-kHz bandpass was set to an offset #4.5 MHz to detect possible plasma-line signals occur-ring simultaneously with the echoes. The runs in March were during a period with no meteor swarms.
3 Experimental results
3.1 Results from August 1989
For 30° elevation there were no clear signals in any of the seven receiver channels offset from the transmitted fre-quency, although we scanned every single 10-s data dump.
For 20° elevation and 0° azimuth we found 13 cases of strong sporadic echoes in single 10-s dumps in a 4-h period. The echoes occur in the neighbouring channels 2, 3 and 4, which are upshifted by 300, 325 and 350 kHz, respectively, with respect to the transmitted frequency. Channel 2 at 300 kHz is where the upshifted gyro line should appear under normal ionospheric conditions. The echoes come from altitudes between 90 and 110 km. The width of the height interval contributing to an echo is 22 km on average. In Fig. 3 we show examples of power profiles of the signals. The power has been plotted as raw data, that is, no noise subtraction or range correction has been made. The missing range correction should be kept in mind when considering variations along the ion-line power profile in channel 1. In Fig. 3 f is the frequency shift; f'0 means that the signal is upshifted relative to the transmitted frequency.
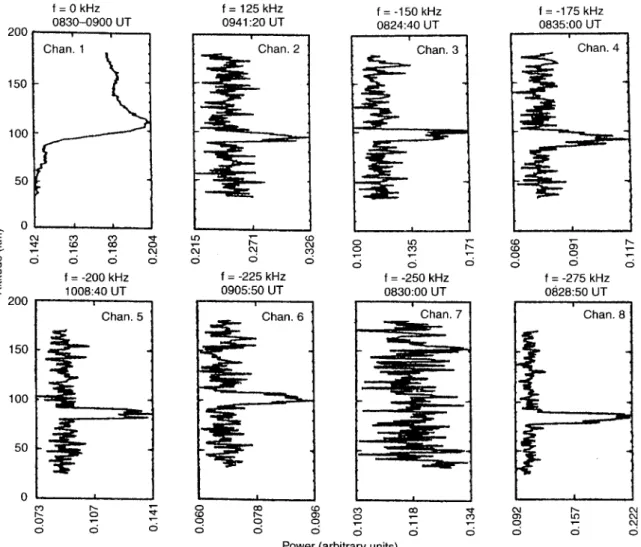
The data taken with 10° elevation and 45° azimuth show a number of strong returns, there are at least 27 distinct echoes in 4 h. The echoes occur in single 10-s data dumps and are similar to those observed for 20° elevation. Most of the echoes are in channels 2 and 3, which are downshifted by 125 and 150 kHz, respectively, relative to the transmitter frequency. These channels are located around the calculated offset of the downshifted gyro line. But now we find echoes also in all the other receiver channels except channel 7 at !250 kHz. That is, we have echoes that are shifted as much as 125 kHz away from the frequency where we would expect to find the gyro line. This fact strongly favours the meteor head echo inter-pretation.
In Fig. 4 we show examples of signals in all the chan-nels. The signals are downshifted with respect to the transmitter frequency ( f(0). The echoes come from a height interval between 90 and 110 km. The average width of this interval is about 14 km. The power varies by a factor of 10 from the weakest to the strongest echoes. There seems to be no correlation between offset frequency, power and altitude.
In a few cases echoes occur in successive 10-s data dumps in the same receiver channel. An example is given
Fig. 3. Power profiles on 17 August 1989 for Az"0° and El"20°. The figure shows an ion-line profile in channel 1 after 30-min integration together with 10-s data dumps from three upshifted
receiver channels centred at f"300, 325 and 350 kHz relative to the transmitted frequency. The power is in arbitrary units.a"78.6° at 100-km altitude
Fig. 4. Power profiles on 18 August 1989 for Az"45° and El"10°. The figure shows an ion-line profile in channel 1 after 30-min integration together with 10-s data dumps from the seven downshif-ted receiver channels centred at f"!125, !150, !175, !200,
!225, !250 and !275 kHz relative to the transmitter frequency. The power is in arbitrary units.a"83.5° at 100-km altitude. Chan-nel 7 contains only noise
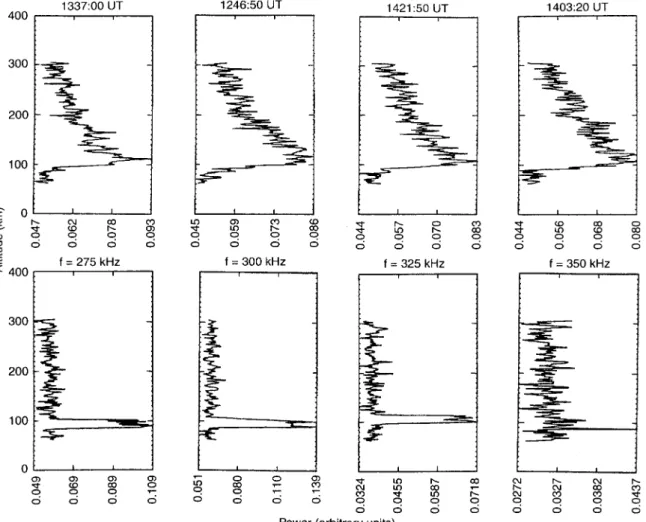
Fig. 6. Power profiles on 17 August 1993 for Az"0° and El"20°. ¸ower panels: upshifted signals at f"275, 300, 325 and 350 kHz.
ºpper panels: corresponding ion line profiles. Integration time is 10 s in all panels. Power is in arbitrary units
Fig. 5. Power profiles on 18 August 1989 for Az"45° and El"10°. The figure shows an example of downshifted echoes occurring in successive 10-s data intervals in the same receiver channel centred at
f"!125 kHz. The power is in arbitrary units
in Fig. 5. The signal in the right-hand panel is a little weaker than the signal to the left and comes from a some-what higher altitude, which may indicate scattering from a structure propagating outwards along the radar beam.
Note that the echoes in Fig. 5 are downshifted ( f"!125 kHz) as they should be if they are caused by a structure moving away from the radar. The change in height (15—20 km) is roughly consistent with the time difference and the Doppler velocity (+20 km s~1).
The ion-line power profiles in Figs. 3 and 4 are typical for the experiment period (remember the missing range correction). Characteristic features are a sharp gradient above 90 km and a weak E-layer maximum at 110—125 km. The echoes seem to come mainly from alti-tudes a little below the maximum.
3.2 Results from August 1993
The data taken on 17 August with 20° elevation and 0° azimuth show 13 cases of strong returns in single 10-s dumps over a period of 4 h. Typical examples of these returns are shown in Fig. 6 together with the corres-ponding ion-line power profiles. The echoes come from an interval about 20 km wide and centred at about 100-km altitude in the region slightly below the E-layer maximum. They all occur in upshifted receiving channels at 275, 300, 325 and 350 kHz. The signal at 350 kHz is very weak and may be only noise. The observed offsets agree fairly well with the calculated gyro-line offset which is 270—300 kHz
Fig. 7a–h. Power profiles between 1500 : 00 and 1500 : 10 UT on 17 August 1993 for Az"0° and El"20°. a ion-line profile; b–d downshifted receiver channels at f"!300, !325 and
!350 kHz; e–h upshifted channels at f"275, 300, 325 and 350 kHz. The power is in arbitrary units
between 100 and 110 km. Generally, the new data are in good agreement with the 1989 observations.
In one particular case echoes occur in four neighbour-ing receiver channels in the same 10-s interval. The data are presented in Fig. 7, where Fig. 7a shows the ion-line power profile, b—d represent downshifted channels with-out any echoes, and e—h represent upshifted channels with strong returns about 100-km altitude. Note the difference in structure between the signals in e—h. We return to this phenomenon in Sect. 4, where we conclude that the narrow spikes in Fig. 7e, f and h cannot be echoes from a real target. The signals observed on 18 August with antenna elev-ation 10° and azimuth 45° are similar in every sense to the 1989 observations. Altogether the 1993 data contain 17 echoes over a period of 3.5 h. Again, most echoes are received in channels located near the calculated gyro-line frequency which is 150 kHz at 100-km altitude. But we also have strong returns in channels 7 and 8 which are downshifted by 250 and 275 kHz, respectively, relative to the transmitted frequency, and which are not easily accept-ed as gyro lines. There are no echoes in channels 5 and 6, i.e. at 200- and 225-kHz downshifts. Examples of the
observed signals are presented in Fig. 8. All the echoes occur below 100-km altitude. Figure 8b and d shows echoes downshifted by 125 kHz. The corresponding ion-line profiles are given in Fig. 8a and c. The signal in b occurs for an ion-line profile with a sharp maximum at about the same height. The stronger echo in d occurs for a rather flat ion-line profile with a weak maximum above the echo. Figure 8g and h shows one particular case where echoes are received in two neighbouring channels in the same 10-s dump. The echoes are about equally strong and come from the same height interval. We return to the interpretation of this case in the next section.
The data taken on 11 August 1993 are from a day with higher meteor density than 17 and 18 August. Antenna pointings and filter settings are given in Table 1. For about one hour (1700—1757 UT) the experiment was run with downshifted filters and Az"45°, El"10°, with negative result. The experimental set-up in this hour was identical with the set-up on 18 August, which gave on average five echoes per hour. The only event observed on 11 August was an upshifted echo at 250 kHz and 100-km altitude, in the direction Az"45°, El"10°.
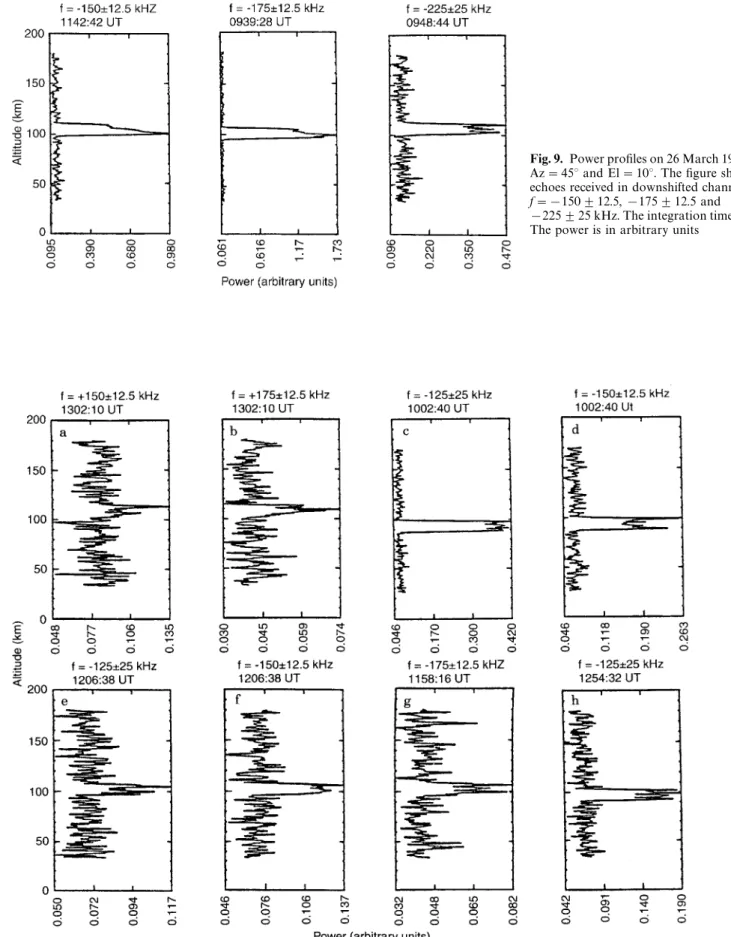
Fig. 8a–h. Power profiles on 18 August 1993 for Az"45° and El"10°. b and d downshifted receiver channels at f"!125 kHz; a and c corresponding ion-line profiles. e–h downshifted channels
at f"!150,!175,!250 and!275 kHz. Integration time is 10 s in all panels. The power is in arbitrary units
3.3 Results from March 1995
The experiment in March 1995 was run in a period when no major meteor showers should be present. However, background meteors can never be excluded. The iono-spheric conditions were magnetically less disturbed than in earlier experiments.
Three echoes were observed with Az"45° and El"10° and no echoes when Az"0°, El"20°. The receiving channels 2—7 were distributed symmetrically about zero offset but echoes were seen only in the down-shifted channels. The echoes were confined to 2-s data dumps. They came from a height interval of width 10—15 km centred a little above 100 km. Figure 9 shows the observations. No signal was seen in the channel set up to catch possible upshifted plasma lines at 4.5 MHz.
3.4 Results from August 1995
The August campaign started with an attempt to catch the peak of the Perseids meteor shower at 1130 UT on 12
August. The aim was to study the occurrence of echoes when the conditions for meteor head echoes were favourable. Unfortunately, the transmitting system failed at the very beginning of the experiment and could not be repaired for days. Hence, we have no results to report from this attempt. The day with the least disturbed conditions is 18 Au-gust 1995. From the experiment on this day with azimuth 45° and elevation 10° we can report 19 echoes of the same type as in earlier runs, over a period of 4.5 h. Examples of the observations are presented in Fig. 10. Only two up-shifted echoes were observed, one at 150 kHz (Fig. 10a) and one at 175 kHz (Fig. 10b). They were observed simul-taneously and are both rather weak. More than half of the downshifted echoes occur in the channel at !125 kHz. There are four cases where echoes were detected simulta-neously at !125 and!150 kHz, two of which are shown in Fig. 10c—f. The likely explanation of these cases is that the signal lies in the frequency interval !137.5 to !150 kHz where the two channels overlap. Figure 10g shows the only return at !175 kHz. One case with a strong signal at!125 kHz (but no signal at!150 kHz) is shown in Fig. 10h. This downshifted echo occurs less
Fig. 9. Power profiles on 26 March 1995 for Az"45° and El"10°. The figure shows echoes received in downshifted channels at
f"!150$12.5, !175$12.5 and
!225$25 kHz. The integration time is 2 s. The power is in arbitrary units
Fig. 10a–h. Power profiles on 18 August 1995 for Az"45° and El"10°. a and b simultaneous signals in upshifted channels at
f"150$12.5 and 175$12.5 kHz; c, d and e, f two cases of
simul-taneous signals in downshifted channels at f"!125$25 and
!150$12.5 kHz; g and h signals in downshifted channels at
f"!175$12.5 and !125$25 kHz. The integration time is 2 s in
than 8 min before the upshifted echoes in a and b. Figure 10 shows both signals from above 100 km (a and b) and from below 100-km altitude (c and d). No plasma-line signal was observed in the channel at #4.5 MHz.
The general impression is that on this day we have more cases with signals at small negative offsets than in earlier experiments with the same geometry. But note that the experiment gives no information about the occurrence at larger negative offsets than !175 kHz (see Table 1).
4 Discussion
The large Doppler shift of the signals excludes the possi-bility that they are coherent echoes from satellites or other space vehicles; also, that they are related to E-region irregularities caused by the electrojet. We can further exclude the possibilities of electronic feedback and system noise; there are no indications of such and also the struc-ture and dynamics of the signals indicate that they are of atmospheric origin and must be interpreted either as strongly enhanced gyro lines or meteor head echoes. An exception are the signals in Fig. 7e—h, which require some special comment. The echo in Fig. 7g at 325 kHz looks similar to the observations in other figures. The height interval (&20 km) corresponds to the length of the radar pulse (300ls&15.4 km in height at 20° elevation) in-creased somewhat due to the motion of the scatterer. Figure 7e, f and h, on the other hand, show narrow spikes in a height interval much shorter than the pulse length. These spikes cannot come from a real target. Probably, g represents the real echo and the spikes in the adjacent channels are ringing effects associated with the sharp edges of the strong echo. The weak signal between the spikes in f is probably some overlap with channel g. Note that the spikes in f and h appear to fall just at the top and bottom of the signal in g, that is, at the leading and trailing edges of the echo. The fact that there is only a spike at the top edge in e is not easily understood. One could guess that since the echo in g is not perfectly rectangular the ringing effects of the two edges are not identical and the spike associated with the lower edge could fall outside the receiving filter in e. Another question is why the spikes are so strong in Fig. 7 when there are no clear spikes in the other cases of strong echoes. One possibility is that the echo in g is extremely short lived, with the power concen-trated over a time much shorter than the other echoes and much shorter than the 10-s integration time. Although there are some questions to be raised about the explana-tion we have given, we believe it forms the basis for understanding the spikes in Fig. 7. They are not of atmo-spheric origin and we shall leave them out in the inter-pretation in the following.
We may now summarize the characteristic features of the observations. Some of them are easily explained with-in either of the two competwith-ing theories, others are not. We proceed to discuss the interpretation in terms of gyro lines in Sect. 4.1 and meteor head echoes in Sect. 4.2. The characteristic properties are:
(1) Typical offset frequencies of the echoes are 125— 350 kHz. This corresponds to Doppler shifts 20—56 km s~1.
(2) The lifetime of the echoes seems to be less than 2 s. (3) The echoes are strong and variable. In most cases the power is of the order of the power in the ion line.
(4) The signal comes from between 90- and 110-km altitude.
(5) The range interval contributing in each case is typically 60 km wide, which corresponds to a height inter-val of 10—20 km.
(6) Nearly all the echoes observed in the direction Az"45°, El"10° are downshifted. All the echoes in the direction Az"0°, El"20° are upshifted. No echoes were observed when Az"0°, El"30°.
(7) The distribution of measured frequency offsets in the August 1995 experiment is noticeably different from the distribution in earlier experiments with the same ge-ometry.
(8) Echoes are not more frequent when the meteor density is higher.
The observations contain examples of
(9) echoes occurring in successive 10-s time-intervals in the same receiver channel (Fig. 5),
(10) echoes from the same altitude occurring simulta-neously in non-overlapping receiver channels (Figs. 8 and 10),
(11) up- and down-shifted echoes that are close in time (Fig. 10),
(12) echoes occurring at a time when there should be no meteor swarms present.
4.1 Gyro-line interpretation
The most problematic features to explain by the gyro-line theory are the properties (1)—(4), that is, how we can have such strong short-lived signals from altitudes where the collisional damping is large, and why the measured fre-quency offsets do not always agree with model calcu-lations.
Note that the model frequencies with which we com-pare refer to the full numerical solution of the linear dispersion relation for a Maxwellian electron distribution under the condition of weak damping. The approximate solution given in Eq. 1 is valid only under the conditions in Eq. 2 which are not always satisfied.
4.1.1 Frequency offsets
Most of the echoes occur at frequencies which compare well with the gyro-line theory. In the following we shall focus on the most extreme cases where the deviation is not so easily explained.
Model calculations of the gyro-line frequency are shown in Fig. 2. The figure caption shows the choice of parameter values. The calculated frequency is about 270 kHz at 100-km altitude for Az"0° and El"20°. The largest observed deviation from this value is 80 kHz. For Az"45°, El"10° the model value is about 150 kHz, while we have observed echoes shifted as much as 275 kHz from the transmitted frequency (see Figs. 4 and 8), that is, there is a discrepancy of 125 kHz. These echoes are similar in strength and shape to the echoes at other frequencies
Fig. 11a–d. Ground-based magnetometer records of the horizontal component of the magnetic field (60-s means) from a Bear Island on 18 August 1989, b 18 August 1993, c 26 March 1995 and d 18
August 1995. Periods of observation are between the vertical lines. Note that the scale in c and d is different from that of a and b
and come from the same altitude. Hence, they are believed to be of the same origin.
A first attempt to explain the discrepancy between theory and experiment would be to consider the choice of parameter values in Fig. 2. The effect of changing the electron density ne and temperature ¹e within reasonable limits is only minor. The gyro-line frequency is only mar-ginally dependent on these parameters (cf. Eq. 1). The important parameters are the electron drift velocity and the magnetic field vector, in particular the direction of the field. But a velocity of about 20 km s~1 in the direction of scatter, or 175 km s~1 along the magnetic field, is needed to account for the extra shift of 125 kHz in the extreme cases in Figs. 4 and 8. Velocities of this order of magnitude are not realistic. Similarly, considering the magnitude of the magnetic field we find that a 75% increase would be needed to explain the extreme shifts, which is obviously out of the question.
Hence, we are left with the question of whether a change in the magnetic field direction relative to the IGRF value can be the explanation. A change in the field direction would change the anglea between the field and the radar beam, and the gyro-line frequency is sensitive to changes ina, in particular when a is large (cf. Eq. 1). For Az"0°, El"20° a change from the IGRF value
a"78.6° to a"75.2° is needed to increase the model value by 80 kHz and eliminate the largest discrepancy with observations. Similarly, the extra shift of 125 kHz observed in the case Az"45°, El"10° can be obtained if the model valuea"83.5° is reduced to 78.1°. The ques-tion then is if changes of this order in the field direcques-tion are realistic and what could possibly be the cause of these changes. We believe that if the gyro-line interpretation is correct the change in the field direction must be related to the excitation process which is discussed in Sect. 4.1.2.
If there are large changes in the magnetic field direction one would expect to see effects in magnetograms on the ground. The nearest magnetometer station is on Bear Island. Figure 11 shows recordings of the horizontal com-ponent of the magnetic field from this station. Panels a and b give the field component on 18 August 1989 and 1993, that is, the days when we have the 125-kHz extra offsets for Az"45°, El"10°. They are seen to be mag-netically active days. In Fig. 11c and d we show the same component on the days 26 March and 18 August 1995. The least disturbed conditions are on 18 August 1995. On this day measured and calculated offsets are in good agreement. If we estimate the change Da"DB/B in the anglea, caused by the magnetic field disturbance DB in Fig. 11a and b, we find it to be a few tenths of a degree.
Hence, it is not large enough to explain the extra shifts. However, the magnetograms show average values over 60-s periods and over a large region in the ionosphere, and give no details about rapid local variations. The distur-bance in the magnetic field within the scattering volume may well be at least one order of magnitude larger.
Local magnetic fields can be set up in connection with particle precipitation. We can estimate what the effects would be of a particle beam on the direction of the field and the aspect anglea. We choose the simple model of a monoenergetic beam with cylindrical symmetry along the geomagnetic field and a uniform current density
j throughout the cylindrical region. The current generates
a disturbanceDB"12k0rj in the magnetic field at a dis-tance r from the axis of the cylinder (k0 is the permeability of free space) which again generates a changeDa"DB/B in the anglea. This gives the relation j"2BDa/k0r be-tween the current density of the beam and the change in the aspect angle, from which we can estimate the density needed to change the angle enough to explain the discrep-ancy with the observations. Assuming a spatially localized beam and r"5—10 km, we find that the current density must be of the order of 1 mA m~2. This is quite a large density compared to values reported in the literature, but it would have to last only for a very short time. It is of the same order of magnitude as the current density introduc-ed by Rietveld et al. (1991) to explain the observations of strongly enhanced ion acoustic wave spectra with the EISCAT UHF radar.
4.1.2 Power, lifetime and excitation mechanism
One main problem with the gyro-line interpretation is how we can have powerful gyro lines at altitudes where the electron-neutral collisional damping is substantial. It is a difficult task to devise an excitation mechanism that can work in these conditions and excite the line to the level we observe.
Earlier papers on gyro lines (Trulsen and Bjørnat , 1978; Malnes and Bjørnat , 1993) show that the line can be excited by linear wave-particle interaction in a similar way as plasma lines. The excitation is by particles whose vel-ocity in the direction of scatter matches the phase velvel-ocity of the wave. But the mechanism is less effective than for plasma lines and least effective for short radar wavelengths (UHF). It cannot by any means enhance gyro lines to the level reported here, which is of orders of magnitude above the thermal level. Moderate enhance-ments at longer radar wavelengths (VHF) have been ob-served in earlier experiments (Bjørnat et al., 1990; Malnes
et al., 1993).
The high intensity and short lifetime ((2 s) of the signals point to a plasma instability as the excitation mechanism if we believe in the gyro-line interpretation. The ‘explosive’ nature of the process indicates a fast-grow-ing instability which saturates due to some intrinsic mech-anism in the plasma. After that the signal dies away due to the strong collisional damping.
Little seems to have been done on instabilities in this frequency range and in conditions relevant for the iono-spheric plasma. One candidate is the bump-in-tail insta-bility, which could be generated by the same incoming
particle beams as are responsible for the disturbance in the magnetic field discussed in Sect. 4.1.1. The beam particles themselves would have much too high an energy to inter-act effectively with the wave and cause the instability. However, when the energetic particles are stopped in the ionosphere the condition of current continuity forces slower electrons to move to carry away the current. We have estimated what the current density must be to gener-ate an instability at the gyro-line frequency. The calcu-lations represent the drifting electrons by a shifted Max-wellian whose drift velocity in the direction of the wave matches the phase velocity. The criterion for instability is that the total growth rate ui"uib#uith!len must be positive (uib is the growth rate of the drifting electrons,uith is the Landau damping of the ambient electrons (uith(0) and len is the electron-neutral collision frequency). The computer program then increases the density of the drift-ing electrons in steps within the linear domain until ui approaches zero. The threshold for instability depends on the parameters of the background plasma and on the temperature chosen for the shifted Maxwellian. For a rea-sonable choice of parameters we find that the current density must be of the order of 1 mA m~2, and that it is carried by about 10% of the electron population. This current is of the same order of magnitude as the current we have estimated for the incoming beam. The model we have used is somewhat oversimplified and not very realis-tic in the present conditions. It implicitly assumes a spa-tially homogeneous plasma and a pure velocity-space instability. Obviously plasma gradients also play a role. The problem of a combined gradient and velocity-space instability is much more difficult to attack (see e.g. Mik-hailovskii, 1974).
If the excitation of the gyro line is by an electric current as just discussed, the direction of the current must gener-ally be towards the radar in the scattering volume at Az"45°, El"10° and away from the radar in the volume at Az"0°, El"20°. This would explain why the signals are downshifted in the first case and upshifted in the second.
4.1.3 Other characteristics
Figure 5 shows echoes occurring in successive 10-s data dumps in the same receiver channel. This observation can be explained by different gyro lines at nearby frequencies and slightly different heights, or by one and the same gyro line generated near the limit between the two time-inter-vals. In Fig. 8g and h and Fig. 10a and b, we have echoes which come from the same altitude into different receiver channels in the same time-interval. These observations can simply be understood by assuming a gyro line appear-ing near the limit between the two channels and contribu-ting to both.
The thermal Landau damping of gyro lines increases with increasing aspect angle a (Bjørnat et al., 1990). This means that it is more difficult to overcome the Landau damping and excite the line in the direction of scatter when the radar is pointing at 30° elevation than at lower elevations (see Fig. 1). But this cannot be why echoes were not seen in the direction Az"0°, El"30°. Numerical calculations show that the difference in Landau damping
is small for elevations between 10° and 30°. Also, electron-neutral collisional damping is more important at 100-km altitude. Most likely the explanation why we see no signals at 30° elevation is that we are probing a different volume where the strong excitation mechanism is absent. We have post-integrated the 1989 and 1993 data over long time-periods looking for ordinary photoelectron en-hanced gyro lines similar to those detected earlier by the EISCAT VHF radar (Bjørnat et al., 1990; Malnes et al., 1993). This was done for the whole height region covered by the experiment, but no lines were seen. It could be argued that this lack of observations is a weakness of the gyro-line interpretation. However, numerical simulations show that photoelectron-enhanced gyro lines are only marginally detectable with the EISCAT UHF (930-MHz) radar due to the stronger Landau damping at shorter wavelengths. Stable ionospheric conditions are required in addition to long integration times. The fact that no gyro lines are found when we post-integrate the present data is not surprising, and is not considered a serious argument against the gyro-line interpretation of the short-lived echoes, which have a different excitation mechanism.
4.2 Meteor head echo interpretation
Most of the characteristic properties of the echoes are compatible with meteor head echoes, and it must be investigated whether the echoes are related to the Perseids meteor swarm. The Perseids shower passes the Earth orbit with a geocentric velocity of about 60 km s~1. The inten-sity is maximum on 11—12 August. Most of our data are taken on 17 and 18 August near the end of the pass when the intensity is low. Nevertheless, meteors have to be considered as the possible cause of the echoes. Also, the presence of sporadic background meteors in the iono-sphere has to be taken into account.
The properties (1)—(5) at the beginning of Sect. 4 are fairly simple to explain by the meteor theory. Thus the measured Doppler shifts of 20—56 km s~1 are compatible with the geocentric velocity of the Perseids. The lifetime of the echoes, the altitude and the variability in strength are easy to understand. In particular, meteor head echoes are known to occur at about 100-km altitude and have a life-time of the order of fractions of a second. During this life-time the meteor is able to move a distance of some tens of km, which explains the width of the range interval of the signals. Also, the fact that no echoes were observed in the direction Az"0°, El"30° has a simple explanation. The filter offsets used in this case were intended for gyro lines and not for meteor echoes; they correspond to too high velocities for meteors, well above the escape velocity of the Sun.
In the experiments with Az"0°, El"20°, the filter bank was symmetrically distributed between upshifted and downshifted offsets, but all the 26 echoes we observed were at upshifted frequencies. Similarly, we used both upshifted and downshifted filters in the 1995 experiments with Az"45°, El"10°, but now all but two of the 22 echoes were downshifted. Thus, the stream of meteors must be approaching the radar in one case and moving
away in the other. The explanation must be the different positions of the two scattering volumes and the fact that the two geometries were run at different times of the day, one mainly before and the other after noon, with little overlap. Note that the occurrence of downshifted echoes when Az"45°, El"10° does not contradict the meteor theory. At low elevations meteors can have velocities directed outwards along the radar beam.
Downshifted echoes occurring in successive data dumps in the same receiver channel, as in Fig. 5, can be interpreted as one echo generated near the end of the first time-interval, by a meteor moving outwards along the radar beam. The fact that the last signal comes from an altitude 15—20-km higher is consistent with a Doppler velocity +20 km s~1 equivalent to the 125-kHz offset. Nor does the occurrence of upshifted and downshifted echoes that are close in time (Fig. 10) contradict the the-ory. One or both of the echoes may come from sporadic background meteors, or the observations may be related to scattered fragments of an incoming meteor encounter-ing the ionosphere. Similarly, meteor debris may explain the occurrence of simultaneous echoes from the same altitude in non-overlapping channels (Figs. 8 and 10). Fragments of a meteor can have somewhat different velocities along the beam and give signals in different channels.
There are definitely more events at small negative fre-quency offsets in the observations of 18 August 1995 than in the 1989 and 1993 observations on the same day. The geometry is the same in all the experiments (Az"45°, El"10°) and they were run at the same time of the day. However, we have too few events to be able to conclude that the distribution of offsets is different; if it were, it would be difficult to explain on the basis of the meteor theory.
The main object of the runs on 11 August 1993 and in March 1995 was to reach a decision on the meteor theory. The March experiment was run at a time with no meteor showers. A few events were observed but this does not refute the theory since there are always sporadic back-ground meteors present in the ionosphere. The experi-ment on 11 August, on the other hand, was run at a time when the intensity of the Perseids shower is higher than on 17 and 18 August. The pointing directions of the antenna are given in Table 1. The direction Az"45°, El"30° is the most favourable. It was surprising that for a period of nearly 3 h we were able to detect only one echo (at Az"45°, El"10°, 100-km altitude and #250-kHz off-set). However, the experiment was run at another time of the day than the other experiments, and the results are not directly compatible. The difference in time imposes a dif-ference in geometry relative to the Perseids shower, which has an impact on the scattering cross-section and on the number of measurable events. In this connection we refer to a recent work by Pellinen-Wannberg et al. (1996), which presents Perseids data taken simultaneously with the EISCAT UHF and VHF radars later in the evening the same day. The UHF data show rates of about six echoes per hour at 21 UT on 11 August and a rate of about 30 echoes per hour at 4 UT on 12 August, indica-ting a time dependence of the rate of meteors observable
at the UHF frequency. In contrast, the VHF data show a constant meteor rate.
4.3 Other observations of unusual echoes
It is interesting to compare the results with earlier obser-vations of unusual echoes in the incoherent-scatter spec-trum. The present observations are unique in the sense that they are the first echoes observed at large offsets and at large angles with the magnetic field. Since the work of Foster et al. (1988) much attention has been focused on echoes at the ion acoustic frequency; the authors observed echoes from the topside ionosphere with the Millstone Hill radar and associated them with field-aligned currents and a current-driven growth of the ion acoustic mode. Schlegel and Moorcroft (1989) have carried out a statis-tical analysis of unusual F-region echoes in EISCAT Common Program data. They found that in almost all cases the strong echoes were present in only one single 10-s interval. This is similar to what we find in our data. The work of Rietveld et al. (1991) reports strongly en-hanced ion acoustic wave spectra in the auroral iono-sphere observed with the EISCAT UHF radar. The obser-vations were from 138 to 587 km and were mainly in the magetic field direction. It was concluded that the cause of the phenomenon was a flow of thermal electrons along the field. The current density was estimated to be of the order of 1 mA m~2, that is, of the same order of magnitude as in our experiment. The current was postulated to be carried initially by incoming field-aligned flows of soft electrons depositing their energy in the F region or upper E region.
5 Conclusion
We have observed a number of strong short-lived echoes with the EISCAT UHF radar at angles 83.5° and 78.6° with the geomagnetic field and at about 100-km altitude north in the auroral zone. The echoes are shifted by 125—350 kHz relative to the transmitted frequency. There are reasons to believe that this type of echo can be seen regularly with the radar at this altitude in these directions.
The first observations were made during a strong PCA event and strongly disturbed magnetic conditions in August 1989. It was then believed that the echoes were enhanced gyro lines and that the enhancement mechanism must somehow be related to the PCA or disturbed condi-tions. But it also happened that the experiment fell within the pass of the Perseids meteor shower, albeit near the end of the pass when the intensity is low. Hence, it was con-sidered that the signals could be meteor head echoes instead.
Subsequently the experiment has been repeated in vari-ous conditions. This includes moderately and little dis-turbed magnetic conditions which gave similar results as the strongly disturbed conditions in 1989. Also, the experi-ment has been run at a time when the meteor intensity should be high and in conditions where no meteors should be present except sporadic background meteors. The
events were few in both cases and about equally frequent. Altogether, the observations make it difficult to decide between the gyro-line and meteor head echo interpreta-tions. We have also considered the possibility that some echoes could be gyro lines and others meteor head echoes and that these two types of echoes could be separated. We have tried to separate the echoes into meteor head echoes from the lowest altitudes and gyro lines from the highest altitudes, but no separation was possible. The highest echoes come from only 110 km, which means that they cannot be readily excluded as meteor echoes. Meteor head echoes at this altitude have been observed earlier with the EISCAT UHF radar (Pellinen-Wannberg and Wannberg, 1994). Also, the highest echoes are very similar to the echoes from lower altitudes. In particular, they are short lived and disappear when post-integrated over a long time.
In Sect. 4.1, 2 we have discussed the difficulties in-volved in the two interpretations. The main problem with the gyro-line theory is how we can have strong short-lived echoes from altitudes where the collisional damping is substantial, and why the measured offsets sometimes devi-ate from the model calculations. The deviation seems to be largest in strongly disturbed conditions, and we have argued that it could be due to local perturbations in the magnetic field caused by incoming particle beams. The beams could also be the cause of an instability which may excite the gyro line to the level that we observe.
The main difficulty with the meteor head echo inter-pretation is that there appears to be a noticeable dif-ference between the distribution of frequency offsets in magnetically active conditions and in less disturbed con-ditions. But we do not have enough events to be sure about this. Also, the echoes seem to be about equally frequent when the meteor density is high and when it is low. However, it can be argued that the geometry relative to the Perseids shower is not the same in the experiments, which has an impact on the number of measurable events. In conclusion, more observations in different conditions are needed before we can decide definitely what the cor-rect interpretation is. As it is, we are inclined to believe in the meteor theory, the problems with the gyro-line theory being more fundamental.
In the 1995 experiments the integration time was re-duced from 10 to 2-s without any noticeable change in the observed signals. In future experiments the integration time should be further reduced to get a better idea about the lifetime of the events. Together with improved range resolution this would help to decide on the interpretation. The full ion-line autocorrelation function should be mea-sured in order that the electron density, temperature and drift velocity can be determined, which would give a better understanding of the geophysical conditions in which the phenomenon occurs. Most important would be to gather more observational material representing different condi-tions. It is believed that the new EISCAT Svalbard radar will give good opportunities for this kind of experiment, and we plan an experiment with this facility in the near future. The Svalbard Radar can give a definite answer to the question raised in this paper. The Doppler shifts of typical meteor echoes are 100 kHz, while gyro lines are
offset by 200—500 kHz. It is thus possible to separate the two types of echoes.
Acknowledgements. We thank As . Fredriksen, C. La Hoz, T. E.
Hill-estad, G. Wannberg and J.-P. St.-Maurice for helpful comments and valuable discussions, and Liv Larssen for skillful assistance in preparing the manuscript. One of the referees is thanked for his advice on the interpretation of Fig. 7 and the other referee for helpful comments on the meteor interpretation. This work was supported by the Norwegian Research Council under contract 101769/410. The EISCAT Scientific Association is supported by the Centre National Recherche Scientifique of France, Suomen Akatemia of Finland, Max-Planck Gesellschaft of Germany, Norges Forskningsrat d of Norway, Naturvetenskapliga Forskningsratdet of Sweden, and the Science and Engineering Research Council of the United Kingdom. We acknowledge with thanks the assistance of the Director and the staff of EISCAT.
Topical Editor D. Alcayde´ thanks A. Pellinen-Wannberg and M. Rietveld for their help in evaluating this paper.
References
Behnke, R. A., and J. B. Hagen, Incoherent scattering of radio waves by whistler-mode oscillations in the ionosphere, Radio Sci., 13, 215—218, 1978.
Bjørnat , N., B.-T. Esjeholm, and T. L. Hansen, Gyro line observations with the EISCAT VHF radar, J. Atmos. ¹err. Phys., 52, 473—482, 1990.
Foster, J. C., C. del Pozo, K. Groves, and J.-P. St. Maurice, Radar observations of the onset of current driven instabilities in the topside ionosphere, Geophys. Res. ¸ett., 15, 160—163, 1988. Hawkes, R. L., and J. Jones, A qualitative model for the ablation
of dustball meteors, Mon. Not. R. Astr. Soc., 173, 339—356, 1975.
Jones, J., and A. R. Webster, Visual and radar studies of meteor head echoes, Planet. Space Sci., 39, 873—878, 1991.
Lindblad, B. A., and M. S[ imek, The activity curve of the Perseid meteor stream from Onsala radar observations 1953—78, in
As-teroids, Comets, Meteors II, Eds. C.-I. Lagerkvist, B. A. Lindblad,
H. Lundstedt, and H. Rickman, Proceedings of a meeting in Uppsala, June 3—6, 1985.
Malnes, E., and N. Bjørnat , Enhancement of incoherent-scatter gyro lines by suprathermal electrons, J. Atmos. ¹err. Phys., 55, 667—674, 1993.
Malnes, E., N. Bjørnat , and T. L. Hansen, European Incoherent-Scatter VHF measurements of gyrolines, J. Geophys. Res., 98, 21,563—21,569, 1993.
Mathews, J. D., K. P. Hunter, D. D. Meise, V. S. Getman, and Q. Zhou, Very high resolution studies of micrometeors using the Arecibo 430-MHz radar, accepted for publication in Icarus, 1996. Mikhailovskii, A. B., ¹heory of Plasma Instabilities, »ol. 2:
Instabili-ties of an Inhomogeneous Plasma, Consultants, New York, 1974.
Pellinen-Wannberg, A., and G. Wannberg, Meteor observations with the European incoherent-scatter UHF radar, J. Geophys. Res., 99, 11379—11390, 1994.
Pellinen-Wannberg, A., A. Westman, and G. Wannberg, Incoherent-scatter radars as meteor diagnostics instruments, Proc. R»K-96, Luleat , Sweden, June 1996.
Rietveld, M. T., P. N. Collis, and J.-P. St.-Maurice, Naturally en-hanced ion acoustic waves in the auroral ionosphere observed with the EISCAT 933-MHz radar, J. Geophys. Res., 96, 19,291—19,305, 1991.
Salpeter, E. E., Plasma density fluctuations in a magnetic field, Phys.
Rev., 122, 1663—1674, 1961.
Schlegel, K., and D. R. Moorcroft, Unusual F-region echoes ob-served with EISCAT, Rep. MPAE-¼-05-89-13, Max-Planck-In-stitut fu¨r Aeronomie, Katlenburg-Lindau, Germany, 1989. Trulsen, J., and N. Bjørnat , Influence of electrostatic electron waves
on the incoherent-scattering cross-section, Phys. Scr., 17, 11—14, 1978.
Wannberg, G., A. Pellinen-Wannberg, and A. Westman, An ambi-guity-function-based method for analysis of Doppler decom-pressed radar signals applied to EISCAT measurements of oblique UHF-VHF meteor echoes, Radio Sci., 31, 497—518, 1996.