HAL Id: insu-01777678
https://hal-insu.archives-ouvertes.fr/insu-01777678
Submitted on 18 Jul 2019HAL is a multi-disciplinary open access archive for the deposit and dissemination of sci-entific research documents, whether they are pub-lished or not. The documents may come from teaching and research institutions in France or abroad, or from public or private research centers.
L’archive ouverte pluridisciplinaire HAL, est destinée au dépôt et à la diffusion de documents scientifiques de niveau recherche, publiés ou non, émanant des établissements d’enseignement et de recherche français ou étrangers, des laboratoires publics ou privés.
Early Toarcian: A link between anoxia, carbon-cycle
perturbation, mass extinction and volcanism
Fatima-Zahra Ait-Itto, Mathieu Martinez, Gregory Price, Abdellah Ait Addi
To cite this version:
Fatima-Zahra Ait-Itto, Mathieu Martinez, Gregory Price, Abdellah Ait Addi. Synchronization of the astronomical time scales in the Early Toarcian: A link between anoxia, carbon-cycle perturbation, mass extinction and volcanism. Earth and Planetary Science Letters, Elsevier, 2018, 493, pp.1-11. �10.1016/j.epsl.2018.04.007�. �insu-01777678�
1
Synchronization of the astronomical time scales in the Early Toarcian: a link between
1
anoxia, carbon-cycle perturbation, mass extinction and volcanism
2 3
Fatima-Zahra Ait-Itto a,*, Mathieu Martinez b,c, Gregory D. Price d, Abdellah Ait Addi a
4 5
a Cadi Ayyad University, Faculty of Sciences and Techniques, Geosciences and
6
Environmental research's Laboratory, P.O. Box 549, Marrakech, Morocco
7
b MARUM: Center for Marine Environmental Sciences, Universität Bremen, Leobenerstr.,
8
28359 Bremen, Germany.
9
c Univ Rennes, CNRS, Géosciences Rennes - UMR 6118, 35000 Rennes, France
10
d School of Geography, Earth and Environmental Sciences Plymouth University, Plymouth,
11 Devon PL4 8AA, UK 12 13 Abstract 14
The Late Pliensbachian-Early Toarcian is a pivotal time in the Mesozoic era, marked by
15
pronounced carbon-isotope excursions, biotic crises and major climatic and oceanographic
16
changes. Here we present new high-resolution carbon-isotope and magnetic-susceptibility
17
measurements from an expanded hemipelagic Late Pliensbachian-Early Toarcian section from
18
the Middle Atlas Basin (Morocco). Our new astronomical calibration allows the construction
19
of an orbital time scale based on the 100-kyr eccentricity cycle. The Early Toarcian
20
Polymorphum Zone contains 10 to 10.5 repetitions of the 100-kyr eccentricity both in the
21
carbon-isotope and the magnetic-susceptibility data, leading to an average duration of 1.00 ±
22
0.08 myr. We also show that the Late Pliensbachian-Early Toarcian global carbon-cycle
23
perturbation has an average duration of 0.24 ± 0.02 myr. These durations are comparable to
24
previous astrochronological time scales provided for this time interval in the most complete
2
sections of the Tethyan area, and longer than what has been provided in condensed sections.
26
Anchoring this framework on published radiometric ages and astrochronological time scales,
27
we estimate that the carbon-cycle perturbation of the Late Pliensbachian-Early Toarcian
28
corresponds with the early phase of the Karoo and Chonke Aike large igneous provinces.
29
Likewise, our new age constraints confirm that the Toarcian oceanic anoxic event is
30
synchronous to the main phase of the Ferrar volcanic activity. Thus, these successive and short
31
phases of the volcanic activity may have been at the origin of the successive phases of the mass
32
extinctions observed in marine biotas in the Pliensbachian and Toarcian times.
33
Keywords:
34
Astrochronology; Toarcian; carbon cycle; Middle Atlas; oceanic anoxic events
35 36
1. Introduction
37
The Early Toarcian (184.15 – 174.1 Ma) was a time of global warming events (Dera et al.,
38
2011), mass extinctions (Little and Benton, 1995), and pronounced negative carbon-isotope
39
excursions recorded in marine carbonates and organic matter, brachiopods, biomarkers and
40
fossil wood (Hesselbo et al., 2007; Suan et al., 2008a; Ait-Itto et al., 2017). These events
41
coincide with carbonate production demises (Bassoullet and Baudin, 1994; Wilmsen and
42
Neuweiler, 2008) and widespread oceanic anoxia (Jenkyns, 1988; Hesselbo et al., 2007).
43
Although large amounts of data have been produced, the timing and rhythms of the
44
environmental perturbations are still debated, leading to controversies on the mechanisms at the
45
onset of the climatic changes in the Early Toarcian (e.g. Kemp et al., 2005; Suan et al., 2008b).
46
For instance, Martinez et al (2017) assess the duration of Pliensbachian-Toarcian event (P-To
47
event) at 0.18 to 0.27 myr, while in the Peniche section (Lusitanian Basin, Portugal) the duration
48
of this event is evaluated as 0.05 myr (Suan et al., 2008b). Similarly, the estimates of duration
49
of the Polymorphum Zone vary from 90 kyr to 1.15 myr (Matiolli and Pittet, 2004; Suan et al.,
3
2008b, Boulila et al., 2014; Huang and Hesselbo, 2014; Ruebsam et al., 2014; Martinez et al.,
51
2017). The main reason of these differences is the occurrence of four discontinuity events
52
identified by correlations ofδ13C and sedimentological features throughout the Tethyan
53
margins, which are due to changes in the sea level observed in the earliest Toarcian (Pittet et
54
al., 2014). The section studied here in Issouka, Morocco, is expanded compared to the
55
sedimentary series from the northern Tethyan margin. It provides the opportunity to fill the gap
56
in the time scale of the Toarcian Stage and to establish a detailed chronology of the succession
57
of the environmental disturbances occurring in the Early Toarcian.
58 59
2. Geological setting
60
The geological history of Morocco was influenced by two important events, starting in the early
61
Mesozoic with the opening of the north Atlantic and western Tethys and the collision of Africa
62
and Europe during the middle Cenozoic (Michard, 1976). These events led to the formation of
63
fault-bounded basins, which are made up of several smaller depocenters, separated by
64
synsedimentary highs (Studer and Du Dresnay, 1980). The Middle Atlas is one of these small
65
fault-bounded basins (Fig. 1). It constitutes a part of a Meso-Cenozoic intracontinental chain,
66
namely the Moroccan Atlas (Michard, 1976). The Middle Atlas of Morocco is structurally
67
dominated by four NE–SW trending anticlines and is mainly constituted of Lower and Middle
68
Jurassic formations (Du Dresnay, 1971). The basin is bounded by the Saïs Plain and the front
69
of the Rifian Nappes in the North, by the Guercif Basin in the northeast, by the Moulouya Plain
70
to the southeast, and by the Hercynian Central Massif in the West.
71
The Middle Atlas Basin is deep in the center and shallows towards the northern and
72
southern basin margins (Du Dresnay, 1971). The study area during the Early Toarcian was
73
located at a palaeolatitude of ~20°N (Bassoulet et al., 1993) (Fig. 1A). The sedimentary
74
evolution and palaeogeographic differentiation is controlled by tectonic activity, combined with
4
the rate of sedimentation and global eustatic variations (Wilmsen and Neuweiler, 2008). The
76
rapid transition from shallow marine carbonates to hemipelagic marls has been taken to reflect
77
a major deepening phase across the entire Middle and High Atlas area (Wilmsen and Neuweiler,
78
2008). The Pliensbachian–Toarcian transition coincides with a dislocation of the Lower
79
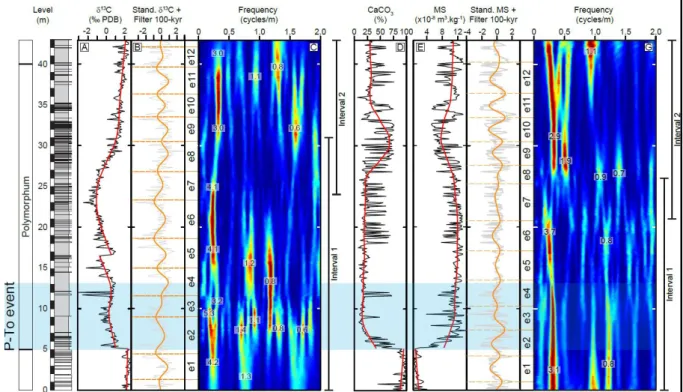
Jurassic carbonate platform (Lachkar et al., 2009; Ait Addi and Chafiki, 2013) with Toarcian
80
deposits dominated by marls lying upon Upper Pliensbachian shallow marine limestones and
81
calcareous marls. This drowning episode is linked to the eustatic sea-level rise of the Early
82
Toarcian described in Europe and Africa (e.g. Hallam, 1997).
83
The biostratigraphy in the Middle Atlas has been established with ammonites (El
84
Hammichi et al., 2008) with further biostratigraphic data provided by benthic foraminifera
85
(Bejjaji et al., 2010). The ammonite zonation in the Issouka section is based on the
86
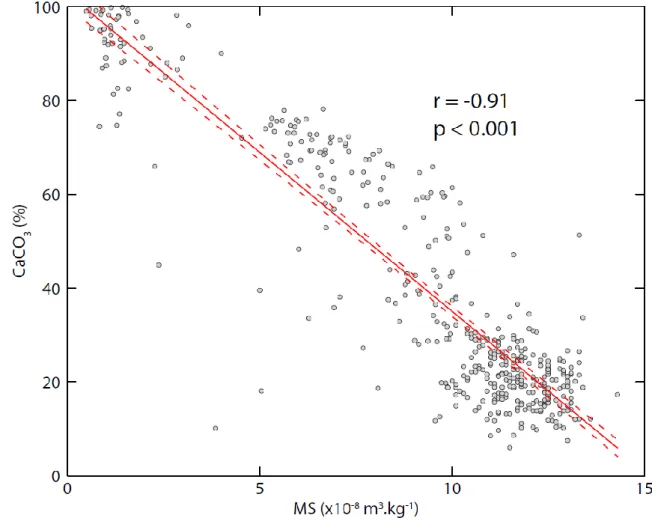
Mediterranean zonation. Notably, the ammonites Emaciaticeras emaciatum of the Emaciatum
87
Zone, Dactylioceras polymorphum of the Toarcian Polymorphum Zone and Hildaites in the
88
Semicelatum Zone have been identified (e.g. El Hammichi et al., 2008). Furthermore, the
89
occurrence of the benthic foraminifera Lenticulina sublaevis in the Issouka section is correlated
90
by Bejjaji et al. (2010) to the Emaciatum ammonite zone of the Pliensbachian, whilst
91
Lenticulina bochardi and Lenticulina toarcense are correlated with the Toarcian Polymorphum
92
Zone and Lenticulina obonensis with the Serpentinus Zone.
93
The Issouka section is situated near the village of Issouka, ~25 km southwest of
94
Immouzer Marmoucha, in the Middle Atlas (N33° 26’ 55.56”; W4° 20’ 33.83”; Fig. 1). The
95
section begins with centimeter thick limestone–marl alternations (Fig. 2). The limestone beds
96
contain a rich ammonite fauna, with also belemnites, echinoids and brachiopods. Foraminifera
97
suggested a Late Pliensbachian age (Bejjaji et al., 2010; Fig. 2A). The early Toarcian succession
98
starts with green marls and marl–limestone alternations, rich in foraminifera, belemnites,
5
echinoids and gastropods. The Toarcian deposits are generally hemipelagic and correspond to
100
deep marine environments (Bejjaji et al., 2010; Fig. 2B).
101 102
3. Material and methods
103
A total of 430 bulk-rock samples were collected with an even sample distance of 10 cm in the
104
Issouka section. The samples were recovered from up to 15 cm below the surface, to minimize
105
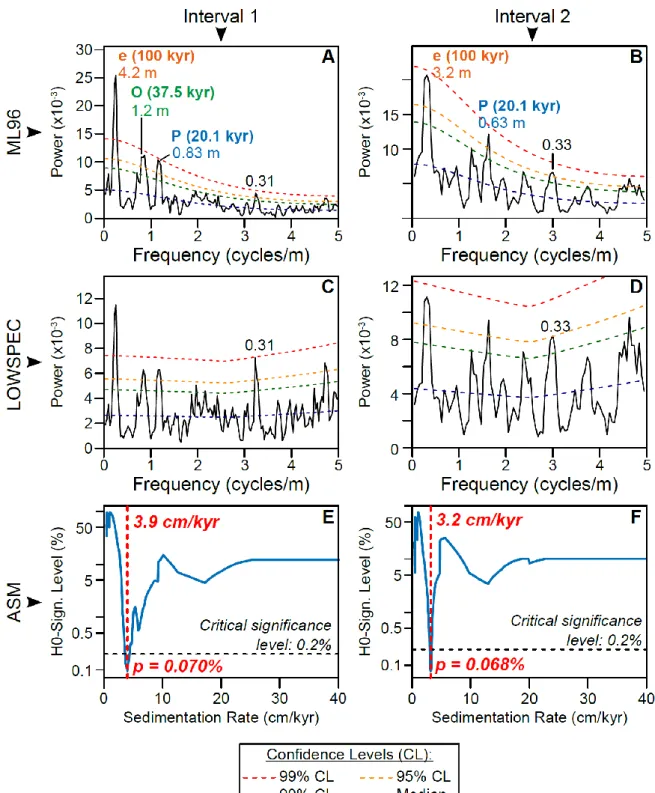
the effects of surface weathering. The sampled interval encompasses the end of the
106
Pliensbachian Stage to the lowermost part of the Levisoni ammonite Zone. Such a range allows
107
the Polymorphum Zone to be entirely sampled. The bulk-rock samples were then powdered
108
using a metal ring grinder and analyzed for stables isotopes, magnetic susceptibility and calcium
109 carbonate contents. 110 111 3.1. Carbon isotopes 112
A total of 430 samples were analyzed for stable isotopes at the University of Plymouth. Using
113
200 to 300 micrograms of carbonate, stable isotope data were generated on a VG Optima mass
114
spectrometer with a Gilson autosampler. Isotope ratios were calibrated using NBS19 standards
115
and are given in δ notation relative to the Vienna Pee Dee Belemnite (VPDB). Reproducibility
116
was generally better than 0.1 ‰ for samples and standard material.
117 118
3.2. Magnetic susceptibility
119
The magnetic susceptibility (MS) of the 430 powdered samples was measured with a
120
Kappabridge KLY-3. The samples are placed in small plastic cubes of 10 cm3 and then
121
introduced inside the instrument using the “pick-up” unit. We measured the cube empty and
122
then with samples for blank correction. The blank-corrected MS values are normalized to their
123
mass and volume. The resulting values are reported as mass-specific MS (m3.kg-1).
6 125
3.3. Calcium carbonate content
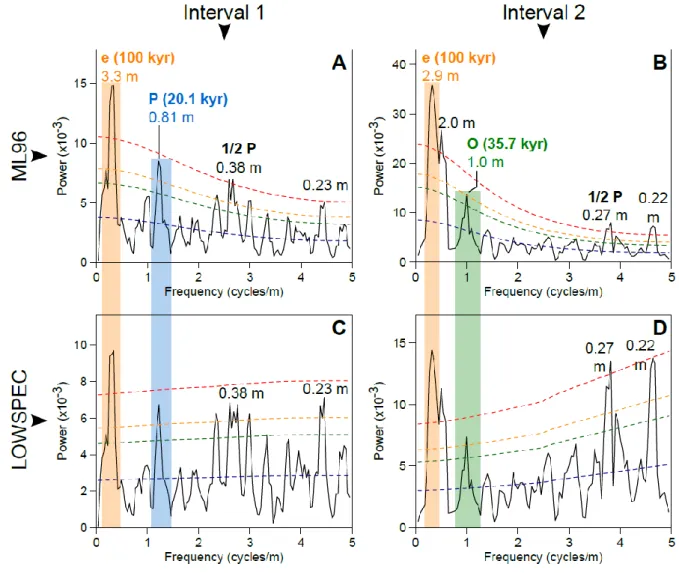
126
The samples were analyzed for their calcium carbonate content using a Bernard calcimeter at
127
the Geosciences and Environment Laboratory, Cadi Ayyad University. The values are given
128
with a precision between 1 and 5% (Lamas et al., 2005).
129 130
3.4. Spectral analysis
131
Prior to spectral analysis, the long-term trend of both series was measured and subtracted from
132
the series to ensure stationarity. The detrend procedures removed the high powers in the
133
frequencies close to 0, while not creating new spectral peaks in the low frequencies (see
134
Vaughan et al., 2015). Best-fit linear trend and LOWESS smoothing curves (Cleveland et al.,
135
1979) were applied. The exact coefficients depend on each of the series and are detailed in the
136
results. Following the removal of this long-term trend, the multi-taper spectral analyses, using
137
three 2π prolate tapers (2π-MTM) with robust red-noise modelling (Mann and Lees, 1996)
138
modified in Meyers (2014) were applied to evaluate lithological cycles as a possible record of
139
astronomically forced sedimentation following the LOWSPEC approach (Meyers, 2012). The
140
significance levels were then calculated assuming a chi-square distribution of the spectral
141
background. We used the time-frequency weighted fast Fourier transforms (T-F WFFT;
142
Martinez et al., 2015) to characterize the evolution of the periods through the sedimentary
143
series. Taner low-pass and band-pass filters (Taner, 2003) were then applied to isolate each
144
signal interpreted as an orbital forcing and calculate the duration of the Polymorphum Zone by
145
cycle counting. Orbital tuning procedures are then used to anchor the sedimentary cycles to
146
their corresponding orbital periods, allowing depth-time conversions to be done. Durations are
147
then estimated by calculating the difference of relative ages. Error margins of each of the time
7
intervals include the difference between the average and the calculated durations and the
149
uncertainty in the orbital frequencies.
150 151
4. Results
152
4.1. Carbonate carbon isotopes
153
The carbon-isotope profile of the Issouka section shows relatively high values in the
154
Pliensbachian part of the section, ranging from +1.7‰ to +2.7‰ (Fig. 3A). From 5 m to 5.6 m,
155
the 13C decreases from 2.5‰ to -0.6‰. This abrupt decrease of 3‰ in the 13C observed at
156
the base of the Toarcian is related to the Pliensbachian-Toarcian event (P-To event; Suan et al.,
157
2008a; Ait-Itto et al., 2017). The 13C values then remain low from 5 m to 23 m. In this interval,
158
the values show gentle fluctuations from 5 to 17 m. At 17 m, the 13C abruptly increase by 1‰
159
before they gently decrease until 23 m to -2‰. The values then progressively increase from 23
160
m to 30 m, changing from -2‰ to 1‰. Above 30 m to the top of the section, the values slightly
161
increase from 1 to 2‰.
162
4.2. Magnetic susceptibility
163
The magnetic susceptibility curve (Fig. 3E) firstly shows from the base of the series to level 5.1
164
m low values, ranging from 9.65x10⁻⁹ to 3.15x10⁻⁸ m3.kg-1. This interval corresponds to the
165
limestone-dominated part of the formation of Pliensbachian age. From 5.2 m to the top of the
166
series, MS values increase with an average value 1.04x10⁻⁷ m3.kg-1. The interval from 27 m to
167
35 m shows lower values of the MS in a more carbonated interval. Calcium carbonate content
168
and MS values display a strong inverse correlation (r = -0.91, Fig. 4), indicating that the
169
lithology mainly controls the MS variations.
170
4.3. Calcium carbonate content
171
The carbonate content series (Fig. 3D) firstly show high values (>80% on average) from the
172
base of the series to 5.1 m, in the interval of the limestone beds of the Pliensbachian. From 5.2
8
m to 8.4 m, the values rapidly decrease from 91% to 8.6%. From 5.2 m to 18 m, the CaCO3
174
values remain low with average values around 22%. The transition between the first to the
175
second interval is more progressive than observed in the δ13C series (Fig. 3A). From 18 m to
176
42.9 m CaCO3 series show high-amplitude cycles and high-frequency fluctuations from 60%
177
and 20% linked to the limestone-marl alternations (Fig. 3D).
178
4.4. Spectral analyses
179
4.4.1. Carbon-isotope signal
180
The 13C shows a rapid decrease at 5.2 m, and a rapid increase at 16.6 m (Fig. 3A). The series
181
was stationarized using a best-fit linear trend from 0 to 5.1 m, a LOWESS regression with a
182
coefficient of 0.6 from 5.2 to 16.5 m and a LOWESS regression with a coefficient of 0.3 from
183
16.6 to 42.9 m. The LOWESS coefficients have been chosen in such a way that they
184
approximatively cover the same length of the section (i.e. ~7 m on average), which represents
185
ca. 20% of the Toarcian part. This choice decreased the high powers at frequencies near 0,
186
while not creating spurious spectral peaks in the low frequencies (Vaughan et al., 2015). The
187
three subseries were then standardized (average = 0, standard deviation = 1) and stacked. Two
188
points at 11.7 m and 12 m showing outstandingly low values when detrending may bias the
189
spectrum in the high frequencies and have been removed from the series before detrending. The
190
evolutive spectrum of the 13C series shows a high-power spectral band in the low frequencies
191
evolving having a period of 4.1 to 4.2 m from the base of the series to level 24 m (Fig. 3C). The
192
period of this band then decreases to 3 m, from level 24 m to level 31 m, and stabilizes at 3 m
193
from level 31 m to the top of the series. These changes in the period of the ~4-m peak likely
194
reflects variations in the sedimentation rate. These distort the sedimentary record of the orbital
195
cycles by decreasing the p-value of the low frequency and flattening the spectrum at high
196
frequencies (Weedon, 2003; Kemp, 2016; Martinez et al., 2016). We thus decided to analyze
197
the frequency content of two sub-intervals of the series in which variations in the sedimentation
9
rate are limited. The range of each of the sub-intervals is given in Fig. 3C. We compared the
199
frequencies of the carbon isotopes in each interval with the orbital frequencies calculated for
200
the Toarcian (Waltham, 2015), using the average spectral misfit (ASM; Meyers and Sageman,
201
2007). The ASM method compares the sedimentary frequencies converted into time to the
202
orbital frequencies and provides a quantitative assessment on the most likely sedimentation rate
203
in each sub-interval (see supplementary materials).
204
Spectra of Interval 1, from levels 0 to 31 m, show significant periods above the 99%
205
confidence level (CL) at 4.2 m (frequency: 0.2404 cycles.m-1), and above the 95% CL at 1.2 m
206
(frequency: 0.8013 cycles.m-1), 0.83 m (frequency: 1.202 cycles.m-1), and 0.31 m (Fig. 5A, C).
207
Spectra of Interval 2, from levels 24 m to the top of the series show significant peaks above the
208
95% CL at 3.2 m (frequency: 0.3158 cycles.m-1), 0.63 m (1.579 cycles.m-1) and 0.33 m (Fig.
209
5B, D).
210
As noted above, various astrochronological frameworks estimate the duration of the
211
Polymorphum Zone from 0.09 myr to 1.15 myr (Mattioli and Pittet, 2004; Suan et al., 2008b;
212
Huang and Hesselbo, 2014; Boulila et al., 2014; Martinez et al., 2017; Boulila and Hinnov,
213
2017), implying a sedimentation rate varying from 400 m/myr to 31 m/myr. When converting
214
m-cycles to time-cycles, the peaks at ~0.3 m have periods below the Milankovitch band
215
whatever the sedimentation rate considered, so were excluded from the ASM analysis. Testing
216
ASM over 500 sedimentation rates ranging from 0.4 cm/kyr to 40 cm/kyr leads to a most likely
217
sedimentation rate of 3.9 cm/kyr (39 m/myr) in Interval 1, and to a most likely sedimentation
218
rate of 3.2 cm/kyr (32 m/myr) in Interval 2 (Fig. 5E, F). The H0-significance level at the most
219
likely sedimentation rate is below the critical significance level below which we can consider
220
without ambiguity these spectra reflect an orbital forcing. In Interval 1, peaks at 4.2 m, 1.2 m
221
and 0.83 m are respectively due to the 100-kyr eccentricity, the obliquity and the precession
222
cycles. Notice than the peak of 1.2 m leads to an obliquity period which is shorter than expected
10
in the theory (here 29.4 kyr vs. 37.5 kyr in Waltham, 2015). In Interval 2, peaks at 3.2 m and
224
0.63 m are respectively due to the 100-kyr eccentricity and the precession cycles. In addition,
225
the peak at 0.33 m has a mean period of 10 kyr, which corresponds to the semi-precession, the
226
first harmonic of the precession (Berger et al., 2006).
227
The evolutive spectral analysis indicates the 100-kyr cycle is the most continuous
228
throughout the studied series (Fig. 3C). We filtered the 100-kyr eccentricity recorded in the
229
13C series and used it as target cycle for calibrating the series in time. We filtered the 100-kyr
230
cycle using a Taner low-pass filter with a frequency cut of 0.3953 cycles.m-1 and a roll-off rate
231
of 1036. The output filter indicates that the Polymorphum Zone contains 10 repetitions of the
232
100-kyr eccentricity cycle (Fig. 3B).
233 234
4.4.2. Magnetic susceptibility
235
The MS series is marked by a rapid increase of values from 5.0 m to 6.8 m. The trend of the
236
series is then gentler. The series was stationarized using a best-fit linear regression from 0 to
237
5.2 m and a LOWESS smoothing with a coefficient of 0.2 in the remainder of the series, which
238
represents 7.5 m of the section. The two subseries were then standardized (average = 0, standard
239
deviation = 1) and stacked. The evolutive spectrum of the MS series shows a band in the low
240
frequencies evolving from 3.1 m to 3.7 m in the lower part of the series, from the base of the
241
series to level 20 m (Fig. 3G). Then, this period decreases to 2.9 m from level 26 m to the top
242
of the series. 2π-MTM spectra have been generated from Interval 1 (from the base of the series
243
to level 26 m), and from Interval 2 (from 21 m to the top of the series) (Fig. 6). Spectra of
244
Interval 1 show spectral peaks over the 99% CL at 3.3 m and 0.38 m, and peaks over the 95%
245
CL at 0.81 m and 0.23 m (Fig. 6A, C). Spectra of Interval 2 show peaks over the 99% CL at 2.9
246
m, 2.0 m, 0.27 m and 0.22 m, and a peak exceeding the 95% CL at 1.0 m (Fig. 6B, D).
11
Assuming from ASM applied on the 13C spectra that Interval 1 has a mean
248
sedimentation rate of 39 m/myr, the peaks of 3.3 m, 0.81 m and 0.38 m are attributed to the
249
100-kyr eccentricity, the precession and the semi-precession, respectively. Assuming from
250
ASM that Interval 2 has a mean sedimentation rate of 32 m/myr, the peak of 2.9 m, 1.0 m and
251
0.27 m are respectively attributed to the 100-kyr eccentricity, the obliquity and the
semi-252
precession (Fig. 6).
253
In Interval 1, the period of the 100-kyr cycle is lower in the MS series than in the 13C.
254
On the evolutive spectral analyses, this is particularly obvious in the first 10 m of the series,
255
when the lithology evolves from the limestones of the Pliensbachian to the marls of the Toarcian
256
(Fig. 3). The 100-kyr eccentricity recorded in the MS series was isolated using a Taner
low-257
pass filter with a frequency cut of 0.4070 cycles.m-1 and a roll-off rate of 1036 (Fig. 3). The
258
output filter indicates that the Polymorphum Zone clearly contains ~10.5 repetitions of the
100-259
kyr eccentricity cycle compared to the 10 repetitions observed in the 13C (Fig. 3).
260 261
5. Discussion
262
5.1. Astrochronology of the the Polymorphum Zone
263
The 13C and the MS signals both display 12 complete short eccentricity cycles along the
264
studied section. In the astronomical models computed for the last 20 myr (Laskar et al., 2004),
265
the average duration of 12 consecutive short eccentricity cycles is 1149 ± 63 kyr (2), so that
266
the average duration of a short eccentricity cycle 95.8 ± 5.2 kyr (2). Assuming a constant
267
sedimentation rate between two successive anchor points of the 100-kyr cycle obtained from
268
the filters of the 13C and the MS signals, the durations calculated of the Polymorphum Zone
269
range from 0.97 myr with the 13C signal, to 1.02 myr with the MS signal. In the spectra of the
270
untuned series, the period of the 100-kyr cycle is longer in the 13C than in the MS (Figs. 3, 5,
271
6). The difference is particularly noticeable in the first 10 m (Fig. 3). Below level 5 m, the filter
12
of 100-kyr cycle in the 13C is inversely correlated to the filter of the 100-kyr in the MS signal.
273
After 5 m, i.e. after the start of the P-To event, the two filters are in phase. The limestone beds
274
in the Pliensbachian of the atlasic basins originate from exports from the neritic environments,
275
in which the 13C was higher than in pelagic environments (Wilmsen and Neuweiler, 2008). In
276
the Pliensbachian, the 13C is higher in limestone beds. The P-To Event corresponds to a demise
277
in the neritic carbonate production. Fluctuations in the 13C thus correspond to fluctuations in
278
the pelagic production, which is usually higher during the deposit of marlier intervals, when
279
detrital and nutrient increased the primary productivity (Mutterlose and Ruffell, 1999; Mattioli
280
and Pittet, 2004). The demise of the carbonate platforms thus changed the phasing between the
281
MS and the 13C, which is a source of uncertainty in the calculation of the durations. Another
282
change of phasing occurs at 28 m, where the 13C and the CaCO
3 content increase. As the
283
phasing between the orbital configuration and the proxies is still unclear, we choose to retain
284
the average duration of 1.00 ± 0.08 myr for the Polymorphum Zone (the uncertainty includes
285
the age model and the duration of a short eccentricity period, see supplementary materials).
286
The spectrum of the calibrated 13C shows a high power at 96 kyr (expected when
287
calibrated to the short eccentricity), 32.4 kyr (main obliquity), 24.1 and 19.7 kyr (precession),
288
and 13.2 to 11.0 kyr (half-precession) (Fig. 7A). In addition, a peak exceeding the 95%
289
confidence level appears at 400 kyr, which corresponds to the long-eccentricity cycle. The
290
spectrum of the calibrated MS shows a high power at 95.7 kyr (expected), 65.5 kyr, 31.9 kyr
291
(main obliquity), from 24.4 to 19.1 kyr (precession), and from 12.1 to 10.6 kyr (half precession)
292
(Fig. 7B). In the 13C and MS signals, the precession cycle has slightly longer periods than
293
expected in the theory (Waltham, 2015). This may be the consequence of a precession cycle
294
missing per short eccentricity. In the astronomical solutions, the amplitude of the precession
295
band is modulated by the 405-kyr and the 100-kyr eccentricity cycles, while the amplitude of
296
the 100-kyr cycle is modulated by the 400-kyr cycle (Laskar et al., 2004). The Taner band-pass
13
filter of the precession cycle in the 13C series was performed with frequency cuts of 3.583 x
298
10-2 cycles/kyr and 5.417 x 10⁻² cycles/kyr, and a roll-off rate of 1036 (Fig. 8B, E). We calculated
299
the amplitude modulation (AM) of the precession cycles using a Hilbert transform. The
300
spectrum of the AM of the precession filter shows cycles at 340 kyr (near the 405-kyr
301
eccentricity), and at 123 and 82.8 kyr (near the periods of 124 and 95 kyr of the short
302
eccentricity) (Fig. 8F). We filtered the 100-kyr band of the AM of the precession filter using a
303
Taner band-pass filter with frequency cuts of 6.250 x 10⁻³ cycles/kyr and 1.558 x 10⁻² cycles/kyr
304
and a roll-off rate of 1036 (Fig. 8F). The AM of this filter shows a cycle at 340 kyr (Fig. 8G).
305
Similarly, the spectrum of the AM calculated on the direct filter of the 100-kyr band shows a
306
cycle at 436 kyr (Fig. 8H). Thus, the AM of the precession and the 100-kyr eccentricity show
307
similar patterns as expected in the astronomical models. The filters of the two bands shows 11
308
cycles of short eccentricity within the Polymorphum Zone (Fig. 8C), while the various filters
309
of the 405-kyr cycles in the AM of the precession and the 100-kyr cycles show from 3 to 4
310
repetitions of the 405-kyr cycle (Fig. 8A, C, D). The difference between the direct filter and the
311
filter of the AM is explained by the residence time of carbon in the ocean, which creates a delay
312
in the response of the 13C to the orbital forcing (Laurin et al., 2017). In this context of
313
hemipelagic sediments, with the limestone beds originating from exports from neritic
314
environments, the difference may also be due to the change of the carbonate source.
315
The duration of the Polymorphum Zone from this study is longer than the duration of
316
~0.8 myr assessed in the Peniche section (Suan et al., 2008b; Huang and Hesselbo, 2014) and
317
the Foum Tillicht section (Martinez et al., 2017). The correlation of these sections led to a
318
duration of a composite Polymorphum Zone of 0.9-1.0 myr, which agrees with the duration
319
calculated here. In addition, the duration calculated here is in close agreement with the duration
320
estimated from Central Italy, in which 11 bundles of marl-limestone alternations have been
321
related to the 100-kyr eccentricity cycle (Mattioli and Pittet, 2004).
14
The series of condensation affecting the Pliensbachian-Toarcian transition strongly
323
affects the duration assessments in the Northern Tethyan margin. For instance, in the Paris
324
Basin, the duration of the Tenuicostatum Zone (equivalent to Polymorphum) varies from 0.09
325
myr to 0.5 myr (Boulila et al., 2014; Ruebsam et al., 2014). Correlations of 13C curves indicate
326
that these sections are affected by a series of condensation events, leading to an underestimation
327
of the duration of the Tenuicostatum Zone (Pittet et al., 2014). Recently, Boulila and Hinnov
328
(2017) suggested that the 100-kyr eccentricity cycles identified in Suan et al. (2008b) and
329
Huang and Hesselbo (2014) are the record of the obliquity cycle. However, this would imply a
330
hiatus of ~800 kyr in the middle of the Tenuicostatum Zone, which is not indicated in the 13C
331
data (Pittet et al., 2014). In addition, detailed observations of the sedimentological pattern of
332
Peniche indicate than these cycles correspond to bundles of 4-6 marl-limestone alternations,
333
which is related to the hierarchy in between the short eccentricity and precession (Suan et al.,
334
2008b). We thus retain here for the Peniche section the astrochronological models from Suan
335
et al. (2008b) and Huang and Hesselbo (2014).
336 337
5.2 Duration of the P-To Event
338
The duration of the P-To event varies from ~50 kyr to 0.27 myr from various astrochronological
339
models (Suan et al., 2008b; Huang and Hesselbo, 2014; Martinez et al., 2017). Uncertainties
340
are due to the condensation event often observed at the Pliensbachian-Toarcian boundary (Pittet
341
et al., 2014) and to the difficulty in defining the upper boundary of the P-To event (Martinez et
342
al., 2017). The P-To event indeed starts with an abrupt decrease of 2 to 3‰ the 13C and change
343
in lithology from carbonated to detrital sediment (Suan et al., 2008a; Bodin et al., 2010). Then,
344
the 13C values gently increase, making the definition of an upper limit of the P-To event
345
problematic. Martinez et al. (2017) defined two options to define the upper boundary of the
P-346
To event: (i) the end of the decrease of the 13C and CaCO3 values; (ii) the local increase of the
15
13C values in the lower part of the Polymorphum Zone, corresponding to a maximum of the
348
filter of the 405-kyr band in the 13C. In the Issouka section, the filter of the 405-kyr band was
349
calculated on the calibrated series (high frequency cut: 0.005833 cycles/kyr; roll-off rate: 1036)
350
and converted into depths shows that this maximum is at 13.1 m (Fig. 9). We suggest using this
351
marker as the end of the P-To event, as it can be observed both in the Central High Atlas and
352
the Middle Atlas. From the 13C and the MS age models, the duration of the P-To event as
353
defined here varies from 0.23 to 0.25 myr, with an average duration of 0.24 ± 0.02 myr (this
354
uncertainty takes into account the uncertainty of the age model and the uncertainty of the period
355
of the eccentricity, see supplementary materials). These durations are in agreement with Option
356
1 from the Foum Tillicht section, which vary from 0.25 to 0.29 myr, with an average duration
357
of 0.27 myr (Martinez et al., 2017). This duration of the P-To event appears stable in Moroccan
358
sections, ranging from 0.23 to 0.29 myr.
359 360
5.3. A synthetic astrochronology for the Tethyan area in the Early Toarcian
361
The Polymorphum Zone at Issouka shows 10 to 10.5 repetitions of the 100-kyr eccentricity
362
cycles. In comparison, the sedimentary records of Foum Tillicht and Peniche show a total of
363
eight 100-kyr eccentricity cycles for the Polymorphum Zone. Lithological patterns in the
364
Umbria-Marche Basin tend to indicate that the Polymorphum Zone contains ten to eleven
365
repetitions of 100-kyr cycle (Mattioli and Pittet, 2004). Four discontinuities identified in the
366
Pliensbachian-Toarcian transition have affected the completeness of the sedimentary record in
367
the Foum Tillicht and the Peniche sections. In particular, at Peniche, the Pliensbachian-Toarcian
368
transition appears condensed, while in Foum Tillicht the top of Polymorphum is missing
369
(Martinez et al., 2017). In Issouka, Foum Tillicht and Peniche, 13C has been measured at a
370
high resolution and astrochronologies have been produced, making it possible to correlate the
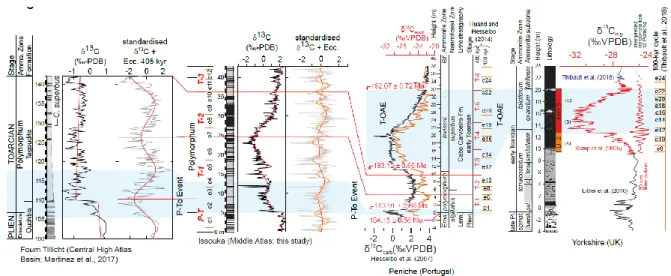
371
sections at a Milankovitch scale.
16
Based on the astrochronological frameworks produced in this study and in Huang and
373
Hesselbo (2014) and Martinez et al. (2017), we can correlate these three sections at the
374
eccentricity scale (Fig. 9). Radiometric ages have been anchored on stratigraphic ages at the
375
Triassic-Jurassic boundary, in the Hettangian and the Sinemurian (Ruhl et al., 2016). A U-Pb
376
age has been proposed for the uppermost part of the Tenuicostatum Zone at 183.22 ± 0.26 Ma
377
in Southern Peru (Sell et al., 2014). The lack of intercalibration with astrochronology makes it
378
difficult to anchor it on our time scale. Conversely, the Triassic-Jurassic boundary have been
379
bracketed at 201.36 ± 0.17 Ma with U-Pb ages from the Pucara Basin (Peru) and the New York
380
Canyon (Nevada, USA), recalibrated applying version 3.0 of EARTHTIME tracer (Wotzlaw et
381
al., 2014). The duration of the interval from the base of the Jurassic to the base of the Toarcian
382
have been assessed at 17.21 myr (Ikeda and Tada, 2014), which matches with the time scale
383
suggested in Ruhl et al. (2016) with an uncertainty of ± one 405-kyr cycle. It positions the base
384
of the Toarcian at 184.15 ± 0.58 Ma. The uncertainty retained here corresponds to the sum of
385
uncertainties of astrochronology and radiochronology.
386
Other ages are as follows (see also supplementary materials for details of the
387
calculations):
388
- The average duration of the P-To event is 0.24 ± 0.02 myr, positioning the top of the P-To
389
event at 183.91 ± 0.60 myr,
390
- The average duration of the Tenuicostatum/Polymorphum Zone is 1.00 ± 0.08 myr,
391
positioning the top of Tenuicostatum/Polymorphum at 183.15 ± 0.66 Ma. Notice that this age
392
fits with the age of Sell et al. (2014) of 183.22 ± 0.26 Ma for the uppermost part of the
393
Tenuicostatum Zone,
394
- The base of the T-OAE occurs 0.03 myr after the end of the Polymorphum Zone (Huang and
395
Hesselbo, 2014; Fig. 9), i.e. 183.12 ± 0.66 Ma,
17
- The T-OAE encompasses 11 short-eccentricity cycles (Suan et al., 2008b; Huang and
397
Hesselbo, 2014; Thibault et al., 2018), corresponding to a duration of 1.05 ± 0.06 myr (Fig. 9).
398
The top of the T-OAE is thus dated here at 182.07 ± 0.72 Ma,
399 400
5.4. Origins of P-To and T-OAE disturbances
401
The large negative CIEs observed in the Early Toarcian, the P-To event and the T-OAE, imply
402
the injection of large amount of light carbon in the oceanic system (Suan et al., 2015). This has
403
been interpreted as dissociation of methane hydrate, maybe orbitally paced (Kemp et al., 2005),
404
or production of thermogenic methane due to volcanic intrusion during the Karoo-Ferrar
405
activity (Svensen et al., 2007). The long duration of the T-OAE (Suan et al., 2008b; Huang and
406
Hesselbo, 2014) implies that the amount of methane needed to maintain the negative excursion
407
for such a long time would exceed the volume of gas hydrate reservoir (Suan et al., 2008b). In
408
addition, the interval of the T-OAE display a positive excursion in Hg/TOC, associated with a
409
volcanic activity (Percival et al., 2015). CA-ID-TIMS U-Pb ages indicate that the Ferrar
410
province activity occurred from 182.779 ± 0.033 Ma and lasted 349 ± 49 kyr (Burgess et al.,
411
2015). These ages fall in the range of the ages assessed here for the T-OAE (183.12 ± 0.66 Ma
412
to 182.07 ± 0.72 Ma; Fig. 9). All these observations tend to favour the crucial role of the
Karoo-413
Ferrar activity on the inception of the T-OAE. Hg/TOC data from Yorkshire and the Peniche
414
sections show a positive excursion within the P-To event, which tend to indicate the
415
concomitance between the P-To event and volcanic activity. The P-To event started 184.15 ±
416
0.58 Ma and ended at 183.91 ± 0.60 Ma (Fig. 9), so that the P-To event appears significantly
417
older than the activity of the Ferrar province. Dating of the early phase of the Karoo province
418
tends to indicate that the Karoo province started earlier than the Ferrar (Burgess et al., 2015;
419
Moulin et al., 2017). Notably the oldest 40Ar/39Ar ages of the Karoo activity have been found
420
in the southern part of the Barkly East Formation (South Africa), within the Omega and the
18
Moshesh’s Ford units (Moulin et al., 2017 and references therein). Other ages older than 183
422
Ma have been reported in the Northern part of the Chonke Aike LIP (South America) in the Rio
423
Negro Province and in the eastern part of the Chubut Province (Féraud et al., 1999). The
424
location and the thicknesses of the formations in which these older 40Ar/39Ar and and U/Pb ages
425
have been provided are, to our knowledge, much more limited than that of the main phase of
426
the Karoo-Ferrar activity (~183 Ma). While this main phase is likely to be responsible for the
427
inception of the T-OAE, limited volcanic activities in the early phase of the Karoo and Chonke
428
Aike LIP may have affected the environmental and ecological perturbations recorded at the
429 Pliensbachian-Toarcian boundary. 430 431 6. Conclusions 432
The carbon isotope and MS variations in the Late Pliensbachian-Early Toarcian, performed in
433
the expanded hemipelagic in Issouka section from the Middle Atlas Basin, Morocco, reveal
434
superposed frequencies consistent with Milankovitch forcing (eccentricity, obliquity, and
435
precession). The Polymorphum Zone contains 10 to 10.5 repetitions of the 100-kyr eccentricity
436
cycle, so that its duration is assessed here at 1.00 ± 0.08 myr. The duration of the P-To event is
437
in addition assessed at 0.24 ± 0.02 myr. The recognition of the 100-kyr and the 405-kyr
438
eccentricity enabled us to establish a stratigraphic framework between the Northern and the
439
Southern Tethyan margins. Anchoring this framework on published radiometric ages and
440
astrochronological time scales, we could estimate the age of the base of the Toarcian as 184.15
441
± 0.58 Ma, the top of the P-To event as 183.91 ± 0.60 Ma, the base of the Toarcian OAE as
442
183.12 ± 0.66 Ma, and the top of the Toarcian OAE as 182.07 ± 0.72 Ma. The age of the
443
Toarcian OAE fits with the ages published for the Ferrar volcanic activity. Conversely, the age
444
of the P-To event seems to correspond with early phase of the Karoo and Chonke Aike activity.
445
Thus, the successive and short phases of the volcanic activity of the Chonke Aike, Karoo and
19
Ferrar provinces may have been the smoking gun of the successive phases of the mass
447
extinction observed in marine biotas in the Pliensbachian and Toarcian times.
448 449
Acknowledgements
450
This paper benefitted considerably from 3 constructive reviews. We would like to thank also
451
the IAS Postgraduate Grant Scheme for the financial support that Fatima-Zahra Ait-Itto
452
received in 2016 for making the isotopic analyses at Plymouth University. Mathieu Martinez
453
was supported by ERC Consolidator Grant Earthsequencing.
454 455
References
456
Ait Addi, A., Chafiki, D., 2013. Sedimentary evolution and palaeogeography of mid Jurassic
457
deposits of the Central High Atlas, Morocco. J. Afr. Earth Sci. 84, 54–69.
458
https://doi.org/10.1016/j.jafrearsci.2013.04.002.
459
Ait-Itto, F.-Z., Price, G.D., Ait Addi, A., Chafiki, D., Mannani, I., 2017. Bulk-carbonate and
460
belemnite carbon-isotope records across the Pliensbachian-Toarcian boundary on the
461
northern margin of Gondwana (Issouka, Middle Atlas, Morocco). Palaeogeogr.
462
Palaeoclim. Palaeoecol. 466, 128–136. https://doi.org/10.1016/j.palaeo.2016.11.014.
463
Bassoullet, J.P., Baudin, F., 1994. Le Toarcien inférieur : une période de crise dans les bassins
464
et sur les plate-formes carbonatées de l’Europe du Nord-Ouest et de la Téthys. Geobios.
465
17, 645–654. https://doi.org/10.1016/S0016-6995(94)80227-0.
466
Bassoulet, J., Elmi, S., Poisson, F., Cecca, F., Belion, Y., Guiraud, R., Baudin, F., 1993. Mid
467
Toarcian. In: Dercourt, J., Ricou, L.E., Vrielynck, B. (Eds.), Atlas Tethys,
468
Paleoenvironmental Maps: Becip–Franlab, Rueil–Malmaison, France, 63–80.
469
Bejjaji, Z., Chakiri, S., Reolid, M., Boutakiout, M., 2010. Foraminiferal biostratigraphy of the
470
Toarcian deposits (Lower Jurassic) from the Middle Atlas (Morocco). Comparison with
20
western Tethyan areas. J. Afr. Earth Sci. 57, 154–162.
472
https://doi.org/10.1016/j.jafrearsci.2009.08.002.
473
Berger, A., Loutre, M.F., Melice, J.L., 2006. Equatorial insolation: from precession harmonics
474
to eccentricity frequencies. Clim. Past 2, 131–136.
https://doi.org/10.5194/cp-2-131-475
2006.
476
Bodin, S., Mattioli, E., Fröhlich, S., Marshall, J.D., Boutib, L., Lahsini, S., Redfern, J., 2010.
477
Toarcian carbon isotope shifts and nutrient changes from the Northern margin of
478
Gondwana (High Atlas, Morocco, Jurassic): Palaeoenvironmental implications.
479
Palaeogeogr. Palaeocl. 297, 377–390. https://doi.org/10.1016/j.palaeo.2010.08.018.
480
Boulila, S., Galbrun, B., Huret, E., Hinnov, L.A., Rouget, I., Gardin, S., Bartolini, A., 2014.
481
Astronomical calibration of the Toarcian Stage: Implications for sequence stratigraphy
482
and duration of the early Toarcian OAE. Earth and Planet. Sci. Lett. 386, 98–111.
483
https://doi.org/10.1016/j.epsl.2013.10.047.
484
Boulila, S., Hinnov L.A., 2017. A review of tempo and scale of the early Jurassic Toarcian
485
OAE: implications for carbon cycle and sea level variations. Newsl. Stratigr. In press.
486
https://doi.org/10.1127/nos/2017/0374.
487
Burgess, S.D., Bowring, S.A., Fleming, T.H., Elliot, D.H., 2015. High-precision geochronology
488
links the Ferrar large igneous province with early-Jurassic ocean anoxia and biotic crisis.
489
Earth Planet. Sci. Lett. 415, 90–99. https://doi.org/10.1016/j.epsl.2015.01.037.
490
Cleveland, W.S., 1979. Robust Locally Weighted Regression and Smoothing Scatterplots.
491
Journal of the American Statistical Association 74, 829-836.
492
Dera, G., Brigaud, B., Monna, F., Laffont R., Pucéat, E., Deconinck, J.-F., Pellenard, P.,
493
Joachimski, M.M., Durlet, C., 2011. Climatic ups and downs in a disturbed Jurassic
494
world. Geology 39, 215–218. http://dx.doi.org/10.1130/G31579.1.
21
Du Dresnay, R., 1971. Extension et développement des phénomènes récifaux Jurassique dans
496
le domaine Atlasique Marocain, particulièrement au Lias moyen. Bull. Soc. Geol. Fr.
497
13, 46–56. http://dx.doi.org/10.2113/gssgfbull.S7-XIII.1-2.46.
498
El Hammichi, F., Benshili, K., Elmi, S., 2008. Les faunes d'Ammonites du Toarcien-Aalénien
499
du Moyen Atlas sud-occidental (Maroc). Rev. Paléobiol. 27, 429–447.
500
Féraud, G., Alric, V., Fornari, M., Bertrand, H., Haller, M., 1999. 40Ar/39Ar dating of the
501
Jurassic volcanic province of Patagonia: migrating magmatism related to Gondwana
502
break-up and subduction. Earth Planet. Sci. Lett. 172, 83–96.
503
https://doi.org/10.1016/S0012-821X(99)00190-9.
504
Hallam, A., 1997. Estimates of the amount and rate of the of sea level change across the
505
Rhaetian–Hettangian and Pliensbachian–Toarcian boundary (latest Triassic to Early
506
Jurassic). J. Geol. Soc. Lond. 154, 773–779.
507
http://dx.doi.org/10.1144/gsjgs.154.5.0773.
508
Hesselbo, S.P., Jenkyns, H.C., Duarte, L.V., Oliveira, L.C.V., 2007. Carbon–isotope record of
509
the Early Jurassic (Toarcian) Oceanic Anoxic Event from fossil wood and marine
510
carbonate (Lusitanian Basin, Portugal). Earth Planet. Sci. Lett. 253, 455–470.
511
https://doi.org/10.1016/j.epsl.2006.11.009.
512
Huang, C., Hesselbo, S.P., 2014. Pacing of the Toarcian Oceanic Anoxic Event (Early Jurassic)
513
from astronomical correlation of marine sections. Gondwana Res. 25, 1348–1356.
514
https://doi.org/10.1016/j.gr.2013.06.023.
515
Ikeda, M., Tada, R., 2014. A 70 million year astronomical time scale for the deep-sea bedded
516
chert sequence (Inuyama, Japan): Implications for Triassic–Jurassic geochronology.
517
Earth Planet. Sci. Lett. 399, 30–43. https://doi.org/10.1016/j.epsl.2014.04.031.
518
Jenkyns, H.C., 1988. The Early Toarcian anoxic event: stratigraphic, sedimentary and
519
geochemical evidence. Am. J. Sci. 288, 101–151.
22
Kemp, D.B., Coe, A.L., Cohen, A.S., Schwark, L., 2005. Astronomical pacing of methane
521
release in the Early Jurassic period. Nature 437, 396–399.
522
http://dx.doi.org/10.1038/nature04037.
523
Lachkar, N., Guiraud, M., El Harfi, A., Dommergues, J. L., Dera, G., Durlet, C., 2009. Early
524
Jurassic normal faulting in a carbonate extensional basin: characterization of
525
tectonically driven platform drowning (High Atlas rift, Morocco). J. Geol. Soc. Lond.
526
166, 413–430. http://dx.doi.org/10.1144/0016-76492008-084.
527
Lamas, F., Irigaray, C., Oteo, C., Chacón, J., 2005. Selection of the most appropriate method
528
to determine the carbonate content for engineering purposes with particular regard to
529
marls. Eng. Geol. 81, 32–41. https://doi.org/10.1016/j.enggeo.2005.07.005.
530
Laskar, J., Robutel, P., Joutel, F., Gastineau, M., Correia, A.C.M., Levrard, M., 2004. A
long-531
term numerical solution for the insolation quantities of the Earth. Astronom. Astrophys.
532
428, 261-285. https://doi.org/10.1051/0004-6361:20041335.
533
Laurin, J., Růžek, B., Giorgioni, M., 2017. Orbital Signals in Carbon Isotopes: Phase Distortion
534
as a Signature of the Carbon Cycle. Paleoceanography 32, 1236–1255.
535
http://dx.doi.org/10.1002/2017PA003143.
536
Little, C.T.S., Benton, M.J., 1995. Early Jurassic mass extinction: a global long–term event.
537
Geology 23, 495–498.
538
http://dx.doi.org/10.1130/0091-7613(1995)023<0495:EJMEAG>2.3.CO;2.
539
Littler, K., Hesselbo, S.P., Jenkyns, H.C., 2010. A carbon-isotope perturbation at the
540
Pliensbachian–Toarcian boundary: evidence from the Lias Group, NE England.
541
Geological Magazine 147, 181–192. https://doi.org/10.1017/S0016756809990458.
542
Kemp, D.B., 2016. Optimizing significance testing of astronomical forcing in
543
cyclostratigraphy. Paleoceanography 31, https://doi.org/10.1002/2016PA002963.
23
Mann, M.E., Lees, J.M., 1996. Robust estimation of background noise and signal detection in
545
climatic time series. Climatic Change 33, 409–445.
546
http://dx.doi.org/10.1007/BF00142586.
547
Martinez, M., Deconinck, J.-F., Pellenard, P., Riquier, L., Company, M., Reboulet, S., Moiroud,
548
M., 2015. Astrochronology of the Valanginian-Hauterivian stages (Early Cretaceous):
549
chronological relationships between the Paraná–Etendeka large igneous province, the
550
Weissert and the Faraoni events. Global Planet. Change 131, 158–173.
551
https://doi.org/10.1016/j.gloplacha.2015.06.001.
552
Martinez, M., Kotov, S., De Vleeschouwer, D., Pas, D., Pälike, H., 2016. Testing the impact of
553
stratigraphic uncertainty on spectral analyses of sedimentary series. Clim. Past 12,
554
1765–1783. https://doi.org/10.5194/cp-12-1765-2016.
555
Martinez, M., Krencker, F.N., Mattioli E., Bodin, S., 2017. Orbital chronology of the
556
Pliensbachian–Toarcian transition from the Central High Atlas Basin (Morocco).
557
Newsletters on Stratigraphy 50, 47–69. https://doi.org/10.1127/nos/2016/0311.
558
Mattioli, E., Pittet, B., 2004. Spatial and temporal distribution of calcareous nannofossils along
559
a proximal–distal transect in the Lower Jurassic of the Umbria–Marche Basin (central
560
Italy). Palaeogeogr. Palaeoclim. Palaeoecol. 205, 295–316.
561
https://doi.org/10.1016/j.palaeo.2003.12.013.
562
Meyers, S.R., Sageman, B.B., 2007. Quantification of deep-time orbital forcing by average
563
spectral misfit. Am. J. Sci. 307, 773–792. http://dx.doi.org/10.2475/05.2007.01.
564
Meyers, S.R., 2012. Seeing red in cyclic stratigraphy: Spectral noise estimation for
565
astrochronology. Paleoceanography 27, PA 3228.
566
http://dx.doi.org/10.1029/2012PA002307.
567
Meyers, S.R., 2014. Astrochron: An R Package for Astrochronology. [Available at
http://cran.r-568
project.org/package=astrochron.] 569
24
Michard, A., 1976. Eléments de géologie Marocaine. Notes et Mémoires du Service Géologique
570
252, 408.
571
Moulin, M., Fluteau, F., Courtillot, V., Marsh. J., Delpech, G., Quidelleur, X., and Gérard, M.,
572
2017. Eruptive history of the Karoo lava flows and their impact on early Jurassic
573
environmental change. J. Geophys. Res. Solid Earth. 122, 738–772.
574
http://dx.doi.org/10.1029/2011JB008210.
575
Mutterlose, J., Ruffell, A., 1999. Milankovtich-scale palaeoclimate changes in pale–dark
576
bedding rhythms from the Early Cretaceous (Hauterivian and Barremian) of eastern
577
England and northern Germany. Palaeogeogr. Palaeoclim. Palaeoecol. 154, 133–160.
578
https://doi.org/10.1016/S0031-0182(99)00107-8.
579
Percival, L.M.E., Witt, M.L.I., Mather, T.A., Hermoso, M., Jenkyns, H.C., Hesselbo, S.P.,
Al-580
Suwaidi, A.H., Storm, M.S., Xu, W., Ruhl, M., 2015. Globally enhanced mercury
581
deposition during the end-Pliensbachian extinction and Toarcian OAE: a link to the
582
Karoo–Ferrar Large Igneous Province. Earth Planet. Sci. Lett. 428, 267–280.
583
https://doi.org/10.1016/j.epsl.2015.06.064.
584
Pittet, B., Suan, G., Lenoir, F., Duarte, L.V., Mattioli E., 2014. Carbon isotope evidence for
585
sedimentary discontinuities in the lower Toarcian of the Lusitanian Basin (Portugal):
586
Sea level change at the onset of the Oceanic Anoxic Event. Sediment. Geol. 303, 1–14.
587
https://doi.org/10.1016/j.sedgeo.2014.01.001.
588
Ruebsam, W., Münzberger, P. and Schwark, L., 2014. Chronology of the Early Toarcian
589
environmental crisis in the Lorraine Sub-Basin (NE Paris Basin). Earth Planet. Sci. Lett.
590
404, 273–282. https://doi.org/10.1016/j.epsl.2014.08.005.
591
Ruhl, M., Hesselbo, S.P., Hinnov, L., Jenkyns, H.C., Xu, W., Riding, J.B., Storm, M., Minisini,
592
D., Ullmann,C.V., Leng, M.J., 2016. Astronomical constraints on the duration of the
25
Early Jurassic Pliensbachian Stage and global climatic fluctuations. Earth Planet. Sci.
594
Lett. 455, 149–165. https://doi.org/10.1016/j.epsl.2016.08.038.
595
Sell, B., Ovtcharova, M., Guex, J., Bartolini, A., Jourdan, F., Spangenberg, J.E., Vicente, J.,
596
Schaltegger, U., 2014. Evaluating the temporal link between the Karoo LIP and
597
climatic–biologic events of the Toarcian Stage with high-precision U–Pb
598
geochronology. Earth Planet. Sci. Lett. 408, 48–56.
599
https://doi.org/10.1016/j.epsl.2014.10.008.
600
Studer, M., Du Dresnay, R., 1980. Déformations synsédimentaires en compression pendant le
601
Lias supérieur et le Dogger, au Tizi n'lrhil (Haut Atlas central de Midelt, Maroc). Bull.
602
Soc. Geol. Fr. 22, 391–397. http://dx.doi.org/10.2113/gssgfbull.S7-XXII.3.391.
603
Suan, G., Mattioli, E., Pittet, B., Mailliot, S. and Lécuyer, C., 2008a. Evidence for major
604
environmental perturbation prior to and during the Toarcian (Early Jurassic) oceanic
605
anoxic event from the Lusitanian Basin, Portugal. Paleoceanography. 23, PA1202.
606
http://dx.doi.org/10.1029/2007PA001459.
607
Suan, G., Pittet, B., Bour, I., Mattioli, E., Duarte, L. and Mailliot, S., 2008b. Duration of the
608
Early Toarcian carbon isotope excursion deduced from spectral analysis: Consequence
609
for its possible causes. Earth Planet. Sci. Lett. 267, 666–679.
610
https://doi.org/10.1016/j.epsl.2007.12.017.
611
Suan, G., van de Schootbrugge, B., Adatte, T., Fiebig, J., Oschmann, W., 2015. Calibrating the
612
magnitude of the Toarcian carbon cycle perturbation. Paleoceanography. 30,
613
PA002758. http://dx.doi.org/10.1002/2014PA002758.
614
Svensen, H., Planke, S., Chevallier, L., Malthe-Sorenssen, A., Corfu, F., Jamtveit, B., 2007.
615
Hydrothermal venting of greenhouse gases triggering Early Jurassic global warming.
616
Earth Planet. Sci. Lett. 256, 554–566. https://doi.org/10.1016/j.epsl.2007.02.013.
26
Taner, M.T., 2003. Attributes Revisited, Technical Publication. Rock Solid Images, Inc.,
618
Houston, TX (URL: rocksolidimages.com/pdf/attrib_revisited.htm.).
619
Thibault, N., Rhul, M., Ullmann, C.V., Korte, C., Kemp, D.B., Gröcke, D.R., Hesselbo, S.P.,
620
2018. The wider context of the Lower Jurassic Toarcian oceanic anoxic event in
621
Yorkshire coastal outcrops, UK. Proceedings of the Geologists’ Association, in press.
622
https://doi.org/10.1016/j.pgeola.2017.10.007.
623
Vaughan, S., Bailey, R.J., Smith, D.G., 2015. Cyclostratigraphy: data filtering as a source of
624
spurious spectral peaks. Geological Society, London, Special Publications 404,
151-625
156. https://doi.org/10.1144/SP404.11.
626
Weedon, G.P., 2003. Time-Series Analysis and Cyclostratigraphy: Examining stratigraphic
627
records of environmental cycles. Cambridge University Press, Cambridge.
628
Waltham. D., 2015. Milankovitch Period Uncertainties and Their Impact on Cyclostratigraphy.
629
J. Sediment. Res. 85, 990–998. http://dx.doi.org/10.2110/jsr.2015.66.
630
Wilmsen, M. and Neuweiler, F., 2008. Biosedimentology of the Early Jurassic post-extinction
631
carbonate depositional system, central High Atlas rift basin, Morocco. Sedimentology
632
55, 773–807. http://dx.doi.org/10.1111/j.1365-3091.2007.00921.x.
633
Wotzlaw, J.-F., Guex, J., Bartolini, A., Gallet, Y., Krystyn, L., McRoberts, C.A., Taylor, D.,
634
Schoene, B., Schaltegger, U., 2014. Towards accurate numerical calibration of the Late
635
Triassic: high-precision U–Pb geochronology constraints on the duration of the
636
Rhaetian. Geology. 42, 571–574. http://dx.doi.org/10.1130/G35612.1.
637 638
27 639 640
Fig. 1. Geological setting of the Issouka section. A. Palaeogeographic map of the western Tethys during 641
the Early Jurassic. The red dash rectangle shows the limit of the second map. Label “1” indicates the 642
location of the Peniche section. Label “2” indicates the location of Yorkshire area. B. Geographical map 643
of Morocco and western Algeria showing the main geological provinces and the location of the Issouka 644
section within the Middle Atlas. Label “3” indicates the location of the Foum Tillicht section (maps 645
from Bodin et al., 2010). 646
28 647
Fig. 2. The different facies in the Issouka section. A. Limestone of the late Pliensbachian with
648
fauna (belemnites, sponges and brachiopods). B. The Lower Toarcian, characterized by grey
649
marls and limestone intercalations.
29 651
Fig. 3. Raw data, spectrograms and filters of the 100-kyr eccentricity band of the carbon isotope (13C) 652
and magnetic susceptibility (MS) signals. A. Raw 13C signal (in black) with long-term trend (in red). 653
B. Standardised 13C signal (in grey) with the filter of the 100-kyr eccentricity (in orange). C. 654
Spectrogram of the 13C signal performed with 15-m-width windows. D. Raw CaCO
3 signal (in black) 655
with long-term trend (in red). E. Raw MS signal (in black) with long-term trend (in red). F. Standardised 656
MS signal (in grey) with the filter of the 100-kyr eccentricity (in orange). G. Spectrogram of the MS 657
signal performed with 15-m-width windows. 658
30 659
Fig. 4. Cross-plot of the magnetic susceptibility (MS) versus calcium carbonate content
660
(CaCO3). The full red line is the best-fit linear regression, while dash lines are the 95%
661
confidence intervals of the linear regression. r indicates the coefficient correlation, and p is the
662
p-value of the correlation.
31 664
Fig. 5. 2-MTM spectra and ASM results of the 13C series. A. and B. Spectra of intervals 1
665
and 2 with confidence levels calculated with the Mann and Lees (1996) method (ML96) with a
666
Tukey’s endpoint rule (Meyers, 2014). C. and D. Spectra of intervals 1 and 2 with confidence
667
levels calculated with the LOWSPEC method (Meyers, 2012). E. and F. H0 significance levels
668
from the ASM applied on intervals 1 and 2. The red dashed line indicates the sedimentation
669
rate for which the sedimentary frequencies fit the best with the orbital frequencies.
32 671
Fig. 6. 2-MTM spectra of the magnetic susceptibility. A. and B. Spectra of intervals 1 and 2
672
with confidence levels calculated with the Mann and Lees (1996) method (ML96) with a
673
Tukey’s endpoint rule (Meyers, 2014). C. and D. Spectra of intervals 1 and 2 with confidence
674
levels calculated with the LOWSPEC method (Meyers, 2012).
33 676
Fig. 7. 2π-MTM spectra of the (A.) calibrated 13C series, and (B.) calibrated MS series. The
677
main periods are labeled in kyr. The theoretical period of the corresponding astronomical cycle
678
is displayed in brackets. Abbreviations: E: 400-kyr eccentricity; e: 100-kyr eccentricity; O:
679
obliquity.
680 681
34 682 Fig. 8. 683 684 685 686 687 688
35
Fig. 8. Comparison between the direct filters of the eccentricity on the calibrated 13C signal
689
and the amplitude modulation of the precession in the calibrated 13C. A. Filter of the 405-kyr
690
eccentricity (in red) and the 100-kyr eccentricity (in orange) of the calibrated 13C signal (in
691
grey). B. Filter of the precession (in blue) and its amplitude modulation (in red) of the calibrate
692
13C signal (in grey). C. Filter of the 100-kyr cycle (in orange) and the 405-kyr cycle (in red)
693
obtained from the amplitude modulation of the precession cycle (in grey). In dashed brown:
694
Filter of the 405-kyr cycle obtained from the 100-kyr band of the amplitude modulation of the
695
precession. D. Filter of the 405-kyr cycle obtained from the amplitude modulation of the direct
696
filter of the 100-kyr cycle (in grey). E. Spectrum of the calibrated 13C series, with the filters
697
used for the 405-kyr cycle (in red; frequency cut: 0.005833 cycles/kyr; roll-off rate: 1036), the
698
100-kyr cycle (in orange; frequency cuts: 0.006667 – 0.01250 cycles/kyr; roll-off rate: 1036)
699
and the precession cycle (in blue; frequency cuts: 0.03583 – 0.05417 cycles/kyr; roll-off rate:
700
1036). F. 2-MTM spectrum of the amplitude modulation of the precession cycles. The red and
701
orange curves represent the filter of the 405-kyr and 100-kyr eccentricity, respectively. The
702
405-kyr cycle is filtered with a Taner low-pass filter (frequency cut: 0.004833 cycles/kyr;
roll-703
off rate: 1036). The 100-kyr cycle is filtered with a Taner band-pass filter (frequency cuts:
704
0.006250 – 0.01558 cycles/kyr; roll-off rate: 1036). G. 2-MTM spectrum of the amplitude
705
modulation of the 100-kyr cycle filtered from the amplitude modulation of the precession
706
cycles. The 405-kyr cycle (in red) is filtered using a Taner low-pass filter (frequency cut:
707
0.005417 cycles/kyr; roll-off rate: 1036). H. 2-MTM spectrum of the amplitude modulation of
708
the 100-kyr cycle filtered from the calibrated series. The 405-kyr cycle (in red) is filtered using
709
a Taner low-pass filter (frequency cut: 0.004583 cycles/kyr; roll-off rate: 1036). Note that
710
spectra of panels F to H are obtained with a padding factor of 2.
711 712
36 713
Fig. 9. Correlations of astronomical time scales in between the Central High Atlas Basin
714
(Martinez et al., 2017), the Middle Atlas Basin (present study), the Peniche section (Suan et
715
al., 2008b; Huang and Hesselbo, 2014) and the Yorkshire area (Thibault et al., 2018).