HAL Id: hal-03198026
https://hal.archives-ouvertes.fr/hal-03198026
Submitted on 14 Apr 2021
HAL is a multi-disciplinary open access
archive for the deposit and dissemination of
sci-entific research documents, whether they are
pub-lished or not. The documents may come from
teaching and research institutions in France or
abroad, or from public or private research centers.
L’archive ouverte pluridisciplinaire HAL, est
destinée au dépôt et à la diffusion de documents
scientifiques de niveau recherche, publiés ou non,
émanant des établissements d’enseignement et de
recherche français ou étrangers, des laboratoires
publics ou privés.
How to create a very-low-cost, very-low-power,
credit-card-sized and real-time-ready datalogger
M. Bès de Berc, M. Grunberg, F. Engels
To cite this version:
M. Bès de Berc, M. Grunberg, F. Engels. How to create a very-low-cost, very-low-power,
credit-card-sized and real-time-ready datalogger. Advances in Geosciences, European Geosciences Union, 2015,
40, pp.37-41. �10.5194/adgeo-40-37-2015�. �hal-03198026�
www.adv-geosci.net/40/37/2015/ doi:10.5194/adgeo-40-37-2015
© Author(s) 2015. CC Attribution 3.0 License.
How to create a very-low-cost, very-low-power, credit-card-sized
and real-time-ready datalogger
M. Bès de Berc1, M. Grunberg2, and F. Engels2
1Institut de Physique du Globe, UMR7516, Université de Strasbourg/EOST, CNRS, 5 rue René Descartes,
67084 Strasbourg, France
2Réseau National de Surveillance Sismique, UMS830, Université de Strasbourg/EOST, CNRS, 5 rue René Descartes,
67084 Strasbourg, France
Correspondence to: M. Bès de Berc (mbesdeberc@unistra.fr)
Received: 3 October 2014 – Revised: 25 February 2015 – Accepted: 4 March 2015 – Published: 31 March 2015
Abstract. In order to improve an existing network, a field
seismologist would have to add some extra sensors to a re-mote station. However, additional ADCs (analogue-to-digital converters) are not always implemented on commercial dat-aloggers, or, if they are, they may already be used. Installing additional ADCs often implies an expensive development, or the purchase of a new datalogger. We present here a sim-ple method to take advantage of the ADCs of an embedded computer in order to create data in a seismological standard format and integrate them within the real-time data stream from the station.
Our first goal is to plug temperature and pressure sensors on the ADCs, read data and record them in mini-seed for-mat (seed stands for Standard for the Exchange of the Earth-quake Data), and eventually transfer them to a central server together with the seismic data, by using seedlink, since mini-seed and mini-seedlink are standard for seismology.
1 Motivations
Inside and outside vault temperatures, outside vault atmo-spheric pressure (Beauduin et al., 1996), wind speed, or, as shown recently, geomagnetic pulsations for high-latitude sta-tions (Kozlovskaya and Kozlovsky, 2012), have a strong in-fluence on broadband seismic signals. Therefore, environ-mental measurements represent valuable data as well as the seismic signals which should be stored, ideally by the seis-mic datalogger, in order to take advantage of the same trans-mission protocol. This implies that the number of auxiliary ADCs (analogue-to-digital converters) needed by the
data-logger increases since main ADCs (24/26 bits) are designed for sampling seismometer analogue outputs. This motivated our study and we specifically work around the auxiliary channels. Several commercial dataloggers offer additional channels, but often not enough or at a prohibitive price. Ta-ble 1 presents the availability of auxiliary channels and the sampling environmental parameters for a series of commer-cial dataloggers that are currently used in French seismic net-works.
2 Datalogger
According to our criteria, a reliable datalogger for environ-mental data includes the following features:
– at least four ADCs, 100 dB dynamic range at a 1 Hz
sampling rate;
– a real-time transmission protocol, with an adjustable
buffer (1 to 24 h);
– a local data archive, recorded in mini-seed, keeping the
last 3 months;
– a robust and efficient delayed-time transmission
proto-col;
– synchronisation with GPS;
– sampling of all ADCs synchronised together; – weak power consumption; and
38 M. Bès de Berc et al.: How to create a datalogger
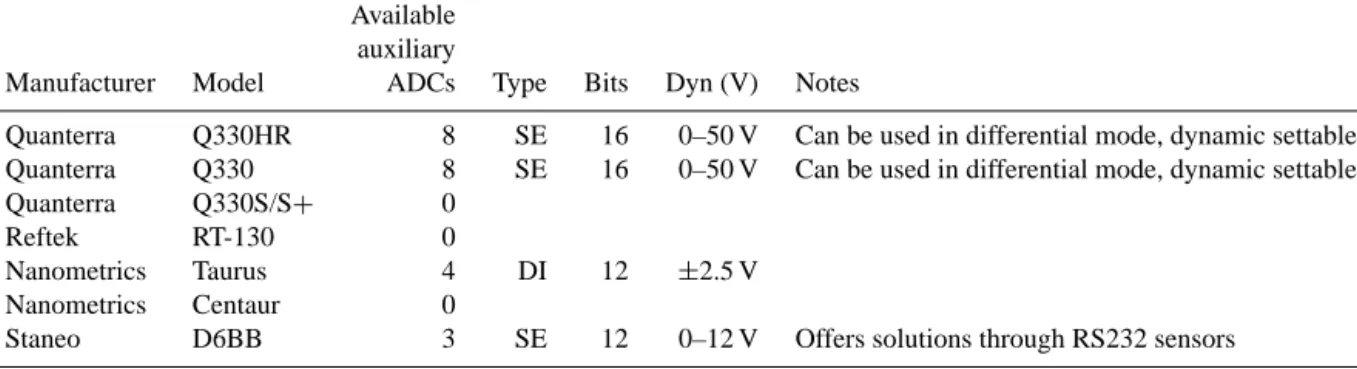
Table 1. Comparison of common dataloggers used at EOST. ADCs mentioned here are the auxiliary ADCs, available for sampling
environ-mental parameters. SE means single-ended and DI means differential. Some dataloggers offer extra options like Q330/Q330HR, allowing a total configuration of type and dynamic of its auxiliary ADCs, or Staneo offering solutions through RS232 probes.
Available auxiliary
Manufacturer Model ADCs Type Bits Dyn (V) Notes
Quanterra Q330HR 8 SE 16 0–50 V Can be used in differential mode, dynamic settable Quanterra Q330 8 SE 16 0–50 V Can be used in differential mode, dynamic settable Quanterra Q330S/S+ 0
Reftek RT-130 0
Nanometrics Taurus 4 DI 12 ±2.5 V Nanometrics Centaur 0
Staneo D6BB 3 SE 12 0–12 V Offers solutions through RS232 sensors
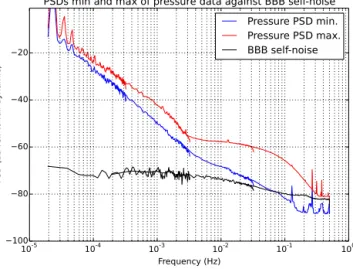
Sampling those data at a frequency higher than 1 Hz may not be necessary, since we are only interested in improving the long-period noise. In order to estimate the needed dynamic range, we used temperature and pressure data from the Geo-scope network during the year 2012. We first calculated the power spectrum density (PSD) of all signals, and then ex-tracted the maximum and minimum PSD shown in Figs. 1 and 2. The Geoscope network includes broadband stations installed over the world, covering a large range of climate conditions. According to Figs. 1 and 2, a dynamic range of about 100 dB is the best performance at a frequency range of 1e-5 to 5e-1 Hz. Those data have to be both sent through the same transmission protocol and locally recorded in the same format as the seismological data, i.e. using seedlink and mini-seed, commonly used in seismology. A robust delayed-time protocol has to be implemented in case of loss of transmis-sion, allowing the recovery of the missing data, only, with an optimised algorithm.
3 Choice of software and hardware
We specifically use standard and robust toolkits: a Linux dis-tribution, running gpsd and ntpd for synchronisation with an Usb GPS receiver (XBU-353 from UsGlobalSat), rsync for delayed-time transmission protocol and seiscomp3 for real-time acquisition and transmission through its seedlink proto-col (Gempa GmbH, 2014), and finally local archive capacity through its slarchive plugin. In order to study the possibili-ties of using a commercial embedded computer, more often used in robotics, we used a BeagleBone Black (BBB) Rev C.1. Its main features are an ARM Cortex A8 (32 bit) pro-cessor at 1 Ghz, 512 MB of DDR3 Ram, 4 GB onboard flash, eight ADCs of 12 bits and a dynamic of 0–1.8 V, and 1 W of power consumption. Other industrial embedded comput-ers are probably better suited for our purpose, but we se-lected this one on the criteria of price and ease of use, but also because the BeagleBone Black is provided with a De-bian 7 operating system, and an active community maintains
Figure 1. Maximum and minimum values of power spectral
densi-ties relative to the full dynamic of temperature, calculated from 10 stations of the Geoscope network. Those values are compared to the self-noise of a BBB’s ADC at the optimal sampling frequency.
the needed documentation and libraries. The main first issue was the determination of the exact dynamics of its ADCs, because only few manufacturers communicate the real dy-namic range, since it is not a crucial parameter in robotics. Therefore, we looked at the three-channel coherence analy-sis (Sleeman et al., 2006). Figures 1 and 2 show the actual dynamic range of ADCs by calculating their self-noise com-pared to both minimum and maximum PSD values of tem-perature and pressure, respectively. Compared to the Geo-scope stations, a loss of performance occurs between 0.003 and 0.5 Hz (up to 15 dB at 0.4 Hz) for temperature and be-tween 0.08 and 0.5 Hz (up to 5 dB) for pressure, due to the lower quality of BBB’s ADC against Geoscope’s auxiliary channels.
Figure 2. Maximum and minimum values of power spectral
den-sities relative to the full dynamic of pressure, calculated from five stations of the Geoscope network. Those values are compared to the self-noise of a BBB’s ADC at the optimal sampling frequency.
4 Setting up BBB
4.1 Loading Linux and softwares on board
The board is provided with an already installed Debian 7 system and beagleboard.org provides the latest ready-to-load system image. The methods for loading a Linux operating system are well documented (BeagleBoard.org Foundation, 2014a). We choose to keep this Debian distribution, mainly because it is a well-known robust operating system and be-cause rsync, gpsd and ntpd are packaged, making them easy to install through Debian’s utility aptitude.
4.2 Compiling and configuring seiscomp3 on the BBB
The sources of the packages are available on the seiscomp3 download site (http://www.seiscomp3.org/downloader). The compilation is long, and several dependencies need to be in-stalled. We installed the gui system in addition to the base package, because BBB includes a graphic processor and therefore the configuration of seiscomp3 is possible through its graphic menu scconfig. For a non-negligible gain of time, a BBB system can be emulated on a work station with qemu, and seiscomp3 can be compiled on it.
5 Sampling ADCs through seiscomp3: bbb_plugin
In the standard distribution, the ADCs are readable in a sim-ple system file. However, standard drivers are not able to han-dle a continuous analogue application at a high sample rate (1 kHz maximum). Moreover, one of the advantages of the BeagleBone Black is a sub-module of its processor (AM335x from TI) called PRU, supporting that kind of “fast” analogue
Figure 3. Seiscomp3 acquisition process scheme. If StreamMonitor
is not enabled (by default), the mini-seed data are sent from file descriptor 63 directly to the transmission buffer, and raw data are ignored. Running bbb_plugin implies activating this module within seiscomp3.
application. We then wrote a seedlink acquisition plugin fill-ing those roles:
1. drive the PRU to launch sampling; 2. copy data in a buffer; and
3. send buffer to seiscomp server.
Each library necessary to write this program is available on the Internet. We used the libpruio library, specifically writ-ten to manage the PRU on BBB (BeagleBoard.org Founda-tion, 2014b), and the development file provided with the seis-comp3 package. We called this simple plugin bbb_plugin. Since seiscomp3 is able to manage the mini-seed conver-sion and the numerical decimation/filtering (see Sect. 7) through its StreamMonitor (Gempa GmbH, 2014), we used the send_raw_depoch() function in bbb_plugin in order to avoid the coding of the mini-seed conversion. Our code is available at https://github.com/mbdb/bbb_plugin. Figure 3 shows a diagram of the seedlink acquisition.
6 Analogue considerations
Before sampling any data, an analogue anti-aliasing fil-ter per ADC has been designed in order to respect the Shannon–Nyquist theorem. Furthermore, our sensors have an output voltage range non-compatible with the input range of the BBB (0–1.8): we wanted to use a hybrid temper-ature/humidity sensor (EE08 from EplusE, output 0–10 V) and a pressure sensor (HD9408T Baro from DeltaOhm, out-put 0–5 V), commonly used in our networks. We applied the common strategy to use a simple first-order RC filter/voltage divider. We designed it to cut frequencies larger than the up-per usable frequency (0.5 Hz) of decimated data, but much
40 M. Bès de Berc et al.: How to create a datalogger
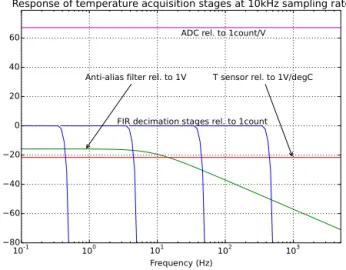
Figure 4. Response over frequency of every stage at a 10 kHz
sam-pling rate for a EE08 (from epluse) temperature sensor. The overall response in dB is the sum of all stages; therefore, for data recorded at 1 Hz, the gain is equal to the addition of the T sensor gain, the anti-alias filter’s optimal gain, and ADC’s gain. Only frequencies between 0.4 and 0.5 Hz (i.e. just before the Nyquist frequency) could be attenuated by the last FIR (Finite Impulse Response) filter stage.
lower than the Nyquist frequency (5 kHz). This analogue stage uses only two resistors and one capacitor per ADC. Figure 4 shows simulations of acquisition stages, and par-ticularly the response of that anti-alias filter in the case study of temperature acquisition. This specific filter gives an atten-uation of ∼ 70 dB at the Nyquist frequency.
7 Digital considerations
A basic concept of analogue–digital conversion is related to the data oversampled at the highest possible frequency, and then digitally decimated to the usable frequencies (Asch, 2003). The quantisation noise of a datalogger is uniformly distributed between DC and the Nyquist frequency and is in-dependent of the sampling rate. Therefore the effective noise power density due to the quantisation at the band of interest is lower at the highest frequency rates.
Since it is difficult to estimate the noise reduction (a new filter design would be required at each sampling rate and a large number of data needed), we used the decimation op-tion within the seiscomp3 StreamMonitor module and mea-sured the highest frequency acceptable in terms of resource consumption. We therefore chose a sampling rate at 10 kHz. Figure 4 shows the response of the FIR decimation stages in the case study of temperature acquisition.
8 Conclusions and discussions
Our first tests were conclusive for using a commercial em-bedded computer (BeagleBone Black) to sample environ-mental data. Its characteristics give a loss of performance in the range 0.001–0.5 Hz for temperature and 0.1–0.5 Hz for pressure, compared to the instrumentation used in the Geoscope network. Except for its standard box, which is not sealed and not suitable for harsh environments, this kind of instrumentation seems to be appropriate for field operations. It is compelling to note that our prototype instrument has been in the field for 3 months, and did not show any signs of deficiency. Other more ambitious projects exist for using a BeagleBone Black and its optional capes, as a real seismo-logical station (Mertl and Lettenbichler, 2014), with associ-ated constraints (135–140 dB dynamic range, good synchro-nisation, etc.). These tests suggest as well that this instrumen-tation could fulfill a central role in a sinstrumen-tation. Up to now, the BBB has only been considered as a secondary source of data at a station, which presents a problem, because the data cen-tre receives two distinct sources of data, and has to associate different streams for each station. To overcome this limita-tion, another strategy has been tested: (1) we loaded a BBB with a seiscomp3 server and set up the acquisition of the seis-mological datalogger on it; and (2) we also installed our own software (bbb_plugin) for the acquisition of its ADCs, and set up the server to mix the streams. This latter configuration has advantages:
– the data centre communicates with a unique source of
data per station; and
– the unique model of the source permits a total
abstrac-tion of the local instrumentaabstrac-tion, allowing a standardis-ation of transmission protocols and local archive struc-ture for every station.
Acknowledgements. The authors would to thank Cécile Doubre
and the anonymous reviewers for their suggestions, which were useful in improving the paper.
Edited by: D. Pesaresi
Reviewed by: two anonymous referees
References
Asch, G. D. (Ed.): Acquisition de données, du capteur à l’ordinateur, 2nd Edn., Dunod, Saint-Jean-de-Braye, France, Chap. 16, 278–279, 2003.
BeagleBoard.org Foundation: Getting started with BeagleBone & BeagleBone Black, available at: http://beagleboard.org/ getting-started, last access 22 September 2014a.
BeagleBoard.org Foundation: libpruio (fast and easy D/A -I/O), available at: http://beagleboard.org/project/libpruio, last access: 1 October 2014b.
Beauduin, R., Lognonné, P., Montagner, J. P., Cacho, S., Kar-czewski, J. F., and Morand, M..: The effects of the atmospheric pressure on seismic signals or How to improve the quality of a station, B. Seismol. Soc. Am., 86, 1760–1769, 1996.
Gempa GmbH: Seedlink, A realtime waveform server implement-ing the Seedlink protocol, available at: http://www.seiscomp3. org/wiki/doc/applications/seedlink, last access: 22 September 2014.
Kozlovskaya, E. and Kozlovsky, A.: Influence of high-latitude ge-omagnetic pulsations, Geoscientific Instrumentation, Methods Data Syst., 1, 85–101, 2012.
Mertl, S. and Lettenbichler, A.: Towards a com-munity environmental observation network, avail-able at: http://www.mertl-research.at/ceon/2014/05/ poster-presentation-at-the-egu-general-assembly-2014, last access: 30 March 2015.
Sleeman, R., van Wettum, A., and Trampert, J.: Three-channel cor-relation analysis: A new technique to measure instrumental noise of digitizers and seismic sensors, B. Seismol. Soc. Am., 96, 258– 271, 2006.