HAL Id: hal-00317102
https://hal.archives-ouvertes.fr/hal-00317102
Submitted on 1 Jan 2002
HAL is a multi-disciplinary open access
archive for the deposit and dissemination of
sci-entific research documents, whether they are
pub-lished or not. The documents may come from
teaching and research institutions in France or
abroad, or from public or private research centers.
L’archive ouverte pluridisciplinaire HAL, est
destinée au dépôt et à la diffusion de documents
scientifiques de niveau recherche, publiés ou non,
émanant des établissements d’enseignement et de
recherche français ou étrangers, des laboratoires
publics ou privés.
Does the magnetosphere behave differently on
weekends?
A. Karinen, K. Mursula, Th. Ulich, J. Manninen
To cite this version:
A. Karinen, K. Mursula, Th. Ulich, J. Manninen. Does the magnetosphere behave differently on
weekends?. Annales Geophysicae, European Geosciences Union, 2002, 20 (8), pp.1137-1142.
�hal-00317102�
Annales
Geophysicae
Does the magnetosphere behave differently on weekends?
A. Karinen1, K. Mursula1, Th. Ulich2, and J. Manninen21Department of Physical Sciences, P.O. Box 3000, University of Oulu, FIN-90014 Oulu, Finland 2Sodankyl¨a Geophysical Observatory, T¨ahtel¨antie 62, FIN-99600 Sodankyl¨a, Finland
Received: 19 November 2001 – Revised: 27 February 2002 – Accepted: 18 March 2002
Abstract. Global geomagnetic activity has been suggested to be enhanced during weekends above the weekly average after 1930. Before the 1930s, weekends and weekdays were found to be equally active. This so-called “weekend effect” was suggested to be due to power line harmonic radiation (PLHR) in the VLF range emitted by electric power lines. Since the consumption of electric power is different on weekends and weekdays, leading to different PLHR intensities, this could possibly cause the “weekend effect” in global geomagnetic activity.
In the present paper, we reanalyse the suggested “week-end effect” in global geomagnetic activity using the 69-year planetary geomagnetic Apindex and the 131-year antipodal aa index. We conclude that there is no statistically significant
“weekend effect” during the interval covered by these geo-magnetic activity indices. Although global geogeo-magnetic ac-tivity is slightly enhanced on weekends from the 1930s to the 1980s, the more recent data show rather a relative decrease in global geomagnetic activity on weekends, contrary to the expected increase in the “weekend effect”, due to increas-ing power consumption. Moreover, the weekly distribution is fairly similar in solar wind speed and global geomagnetic activity during the last 35 years, further supporting the view that the “weekend effect” is only a statistical fluctuation. Key words. Geomagnetism and paleomagnetism (time vari-ations, diurnal to secular) – Magnetospheric physics (plane-tary magnetospheres; storms and substorms)
1 Introduction
Electrical power lines radiate waves in the VLF (very low frequency, 300 Hz – 30 kHz) range at harmonics of their fun-damental frequency, which is usually 50 or 60 Hz. This so-called power line harmonic radiation (PLHR) may, in prin-ciple, have effects on the behaviour of the magnetosphere.
Correspondence to: A. Karinen ([email protected])
On the ground, the propagation of PLHR through the mag-netosphere was first observed by Helliwell and Katsufrakis (1974). Subsequent studies verified that man-made VLF waves can propagate from the ground into the magnetosphere (Helliwell et al., 1975; Park, 1977; Park and Helliwell, 1978). During the past decade, low-altitude satellites have been used to study the anthropogenic PLHR in space. The AUREOL 3 satellite was the first to observe PLHR at mid-latitudes (Par-rot, 1994).
Fraser-Smith (1979) reported that global geomagnetic ac-tivity had increased during weekends since the 1930s. He studied global geomagnetic activity by the 7-day superposed epoch analysis using the daily values of the Ap and aa
in-dices in the 46.5-year (1 January 1932 – 6 June 1978) and 110-year (1 January 1868 – 31 December 1977) intervals, respectively. For the aa index, separate analyses were con-ducted in the 63-year (1868–1930) and 42-year (1931–1972) time intervals. No increase was observed before the 1930s, but thereafter activity on weekends was enhanced. Fraser-Smith (1979) suggested that this so-called “weekend effect” is due to the consumption of electrical power, which is larger on weekdays than on weekends, and which has greatly in-creased since the 1930s. According to Fraser-Smith (1979), global geomagnetic activity is smaller on weekdays because the strong PLHR affects the magnetospheric processes so that natural disturbances are suppressed. On weekends, the activity would be higher because the smaller level of PLHR would have a smaller suppressing effect.
In this paper, we reanalyse the study of Fraser-Smith (1979) and extend it using 22.5 years of additional and more recent data on global geomagnetic activity. With an ever in-creasing power consumption, one could expect the “weekend effect” to be strengthened during this time. We examine the “weekend effect” in the Ap index in Sect. 2 by the
super-posed epoch method and in Sect. 3, by spectral methods. In Sect. 4, we present a detailed time profile for the “weekend effect” using the 131-year aa index. Section 5 presents our conclusions.
1138 A. Karinen et al.: Does the magnetosphere behave differently on weekends?
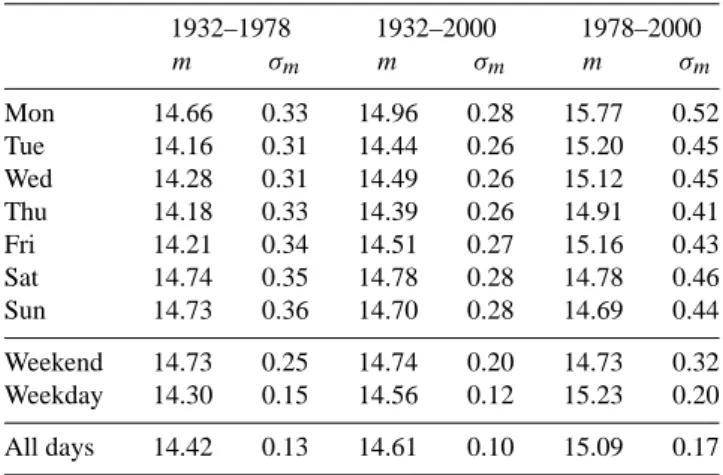
Table 1. Mean values (m) and standard errors (σm) of the Apindex
for each day of the week in 1932–1978, 1932–2000 and 1978–2000 1932–1978 1932–2000 1978–2000 m σm m σm m σm Mon 14.66 0.33 14.96 0.28 15.77 0.52 Tue 14.16 0.31 14.44 0.26 15.20 0.45 Wed 14.28 0.31 14.49 0.26 15.12 0.45 Thu 14.18 0.33 14.39 0.26 14.91 0.41 Fri 14.21 0.34 14.51 0.27 15.16 0.43 Sat 14.74 0.35 14.78 0.28 14.78 0.46 Sun 14.73 0.36 14.70 0.28 14.69 0.44 Weekend 14.73 0.25 14.74 0.20 14.73 0.32 Weekday 14.30 0.15 14.56 0.12 15.23 0.20 All days 14.42 0.13 14.61 0.10 15.09 0.17
2 Superposed epoch analysis of the Apindex
We have calculated the weekly variation by the superposed epoch method from the daily Ap indices for the time
inter-val 1 January 1932 – 6 June 1978 (the interinter-val studied by Fraser-Smith, 1979) and for two other time intervals: 1 Jan-uary 1932 – 31 December 2000 (the whole Apinterval until
2000) and 1 January 1978 – 31 December 2000. Table 1 lists the average Apvalues and their standard errors for each day
of the week for these three time intervals, and Fig. 1 depicts them visually. Our results for the years 1932–1978 are the same as those reported by Fraser-Smith (1979).
The average all-day Ap value for the years 1978–2000
(see Table 1) is larger than for the years 1932–1978, re-flecting the increasing trend of global geomagnetic activity (see, e.g. Clilverd et al., 1998; Lockwood et al., 1999). How-ever, this increase has mainly taken place on weekdays, while the weekend mean value in 1932–2000 and also in 1978– 2000 has been roughly the same as in 1932–1978. Actually, while the interval studied by Fraser-Smith (1979) depicts roughly a 2 σm signal of enhanced weekend activity, there
has been roughly a 2 σmsignal of suppressed weekend
activ-ity in 1978–2000. Accordingly, global geomagnetic activactiv-ity is smaller on weekends than on weekdays since the 1980s, indicating that the “weekend effect” was reversed during this time.
Consequently, the significance of the “weekend effect” during the more recent and larger Ap interval has decreased
considerably since Fraser-Smith (1979) published his stud-ies, and is now only within a 1 σm level. This development
is contrary to the idea that the “weekend effect” would be further enhanced during the last 20 years due to enhanced consumption of electric power. The small overall level of the “weekend effect” between 1932–2000 and the variation of the “weekend effect” above and below the weekly aver-age strongly suggest that the “weekend effect” is only due to statistical fluctuation.
3 Spectral analysis of the Apindex
Fraser-Smith (1979) noted pertinently that the spectral anal-ysis of lengthy intervals of the Ap(e.g. Fraser-Smith, 1972)
and aa indices (e.g. Delouis and Mayaud, 1975) do not show a well-defined 7-day spectral line. He suggested that this could be reconciled with the results of the superposed epoch method if the weekend increase only occurs intermittently in time.
We have studied the temporal occurrence of spectral power and the “weekend effect” in Fig. 2. The top panel depicts the dynamic FFT spectrum of the Ap index for periods from 6
to 8 days. The Ap data were split into successive annual
sections, detrended and zero-padded, and the average FFT power spectral density was calculated for each annual sec-tion. The 6–8 day period part of the resulting annual spectra has been depicted along the vertical axis in a monochrome (black and white) intensity scale. The plot verifies that there are isolated enhancements of geomagnetic activity within the 6–8 day period range, but no continuous 7-day variation. Most of the variation at 6–8 days occurs during the declining phase of the solar cycle, where recurrent activity at 27–28 days dominates.
The bottom panel of Fig. 2 depicts the intensity and also the phase of the weekly variation. The daily Ap series was
first band-pass filtered within the cutoff periods of 6 and 8 days. Then the annual means for each day of the week were calculated. These values are then depicted in a monochrome (black and white) intensity scale along the vertical axis so as to demonstrate the intensity and phase of the 7-day variation within each annual section.
Figure 2 shows that in the years 1939–1942, 1946–1952 and 1957–1962, there were large variations in global geo-magnetic activity at the periods from 6 to 8 days. The phase of these variations favoured weekends, as can be seen in the bottom panel. For instance, in 1953, a strong spectral line at the period of 7 days is seen in the upper panel, increas-ing geomagnetic activity primarily on Sundays and also on Mondays. We note that most of these do not have a period of exactly 7 days and that spectral power is fairly evenly dis-tributed over the depicted period range. However, some of the enhancements have a period close to 7 days (see Fig. 2).
Overall, the power of geomagnetic activity variations be-tween 6 and 8 days has become weaker after the early 1960s. The power in the 6–8 day period range was especially weak from the early 1960s to the late 1970s. During the years be-tween 1979–1983, a few enhancements appeared primarily close to the period of 8 days. Also some weak variations at a period of about 7 days occurred during those years. In 1992–1993, strong spectral lines occurred with periods be-tween 6 and 7 days. In 1999, there was a clear 7-day spectral line which increased geomagnetic activity during the work-ing week.
It is interesting to note that Rodger et al. (2000) studied the so-called magnetic line radiation (MLR) for signs of an-thropogenic effects. Contrary to the “weekend effect”, their Fig. 4 shows a pronounced peak of MLR activity on
Thurs-Mon Tue Wed Thu Fri Sat Sun 13.5 14 14.5 15 15.5 16 16.5 Average Ap 1932−1978 1932−2000 1978−2000
Fig. 1. Mean values and standard errors of the Apindex for each day of the week in 1932–1978, 1932–2000 and 1978–2000.
6 7 8 Period (days) 1935 1940 1945 1950 1955 1960 1965 1970 1975 1980 1985 1990 1995 2000 Mon Tue Wed Thu Fri Sat Sun
Fig. 2. (top) Dynamic FFT spectrum for the daily Ap series in 1932–2000. Black colour represents large intensities. (bottom) Phase
presentation for the weekly variation of Apin 1932–2000. Black (white) colour represents large, positive (negative) variations and grey
colour represents the zero level.
days in the four months of VLF data of June, July, September and December 1995. We studied the same period using the
Apindex, but found neither a weekend increase nor a
Thurs-day maximum in geomagnetic activity (see also Fig. 2).
4 Long-term evolution of the “weekend effect”
Long-term variations and trends can greatly affect a super-posed epoch analysis. Since global geomagnetic activity is known to have increased fairly systematically during the last 100 years, this might have led to the “weekend effect” when
weekly averages are compared with the values of the subse-quent weekends.
In order to avoid the effect of long-term variations and trends, we have subtracted the running 13-day mean from the daily aa index series to form a high-pass filtered aa se-ries. All periods longer than 13 days (e.g. solar cycle changes and 27-day variations) are thereby effectively removed from the aa index.
Also, in order to avoid the artifact of the weekend being at the end of the week, we have compared the (filtered) aa values for the weekend with the average level of the two ad-jacent working weeks. We subtracted the mean of the 10
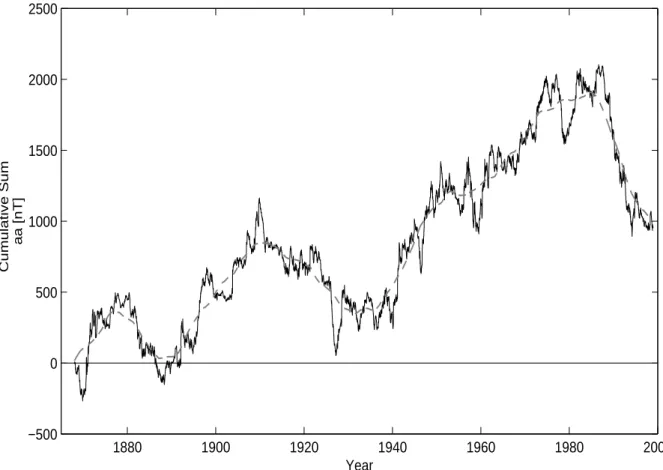
1140 A. Karinen et al.: Does the magnetosphere behave differently on weekends? 1880 1900 1920 1940 1960 1980 2000 −500 0 500 1000 1500 2000 2500 Year aa [nT] Cumulative Sum
Fig. 3. Cumulative sum of weekend-weekday differences calculated from the aa indices (solid curve). Running 10-year mean is depicted as
a dashed curve. Horizontal line depicts the zero level of cumulative sum.
weekdays around each weekend (Saturday and Sunday) from the mean of the weekend, to form the series representing the weekend-weekday difference. In order to study the de-tailed time evolution of the “weekend effect”, we have com-puted the cumulative sum of the weekend-weekday differ-ences from the aa indices for the years 1868–1998 (1 January 1868 – 31 December 1998), and plotted this curve in Fig. 3. The cumulative sum can directly depict the time evolution of any possible weekend enhancements.
Figure 3 shows that the cumulative sum has experienced three major, increasingly large and primarily positive fluc-tuations during the 131-year interval. The first fluctuation (1870–1890) lasted only 20 years and returned the sum to a zero level. The second, longer fluctuation (1890–1935) stopped with the cumulative sum retaining a small positive value. The third fluctuation started in the 1940s and is obvi-ously not yet finished.
The first two fluctuations in the cumulative sum coin-cide with the time interval 1868–1930, which Fraser-Smith (1979) reported only a little difference between the average weekday and weekend values. The major increase in the cu-mulative sum from about 1940 to about 1980 corresponds to enhanced geomagnetic activity on weekends, as found by Fraser-Smith (1979) for his second time interval 1931–1972 using the superposed epoch method. Accordingly, this
in-crease forms the basis of his evidence in favour of the “week-end effect”. However, as seen in Fig. 3, the subsequent evo-lution of the cumulative sum is completely different, decreas-ing from the 1980s until today. This implies that global ge-omagnetic activity has been even weaker on weekends than on weekdays since the 1980s.
The small size of the fluctuations is below statistical sig-nificance, as concluded earlier. Moreover, the fluctuating na-ture of the weekend-weekday difference, in particular the de-creasing sections in 1910–1940 and from 1985 until now, is against a persistent “weekend effect” and the idea that the effect would be due to PLHR. Note that the decrease since 1985 also excludes the possibility that the “weekend effect” due to PLHR was active only in 1940–1985. Such a sce-nario could be envisioned if the weekly variation of power consumption was reduced recently, for example, due to in-creased automation (supporting a 7-day work week). Au-tomation leads to indistinguishable weekend and weekday activity, but not to less active weekends.
Some detailed features that were found in the dynamic spectrum of the Ap index (see Fig. 2) are also seen in the
cumulative sum for aa. For instance, within the years 1939– 1942, 1960–1962 and 1979–1982, the cumulative curve has rapidly increasing sections, corresponding to simultaneous spectral enhancements.
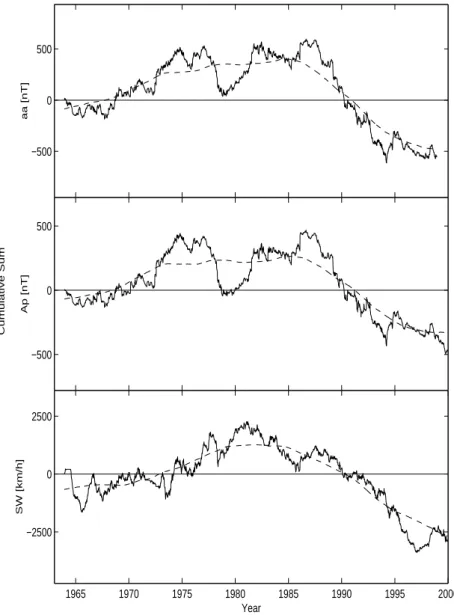
−500 0 500 aa [nT] −500 0 500 Ap [nT] 1965 1970 1975 1980 1985 1990 1995 2000 −2500 0 2500 SW [km/h] Year Cumulative Sum
Fig. 4. Cumulative sum of
weekend-weekday differences for the aa (top) and Ap (center) geomagnetic indices
and for the solar wind speed (bottom). Running 10-year means are depicted as dashed curves. Horizontal lines depict the zero levels of cumulative sums.
We have also studied the weekend-weekday difference in solar wind speed. Figure 4 depicts the cumulative sums of the weekend-weekday differences for the aa and Apindices,
as well as for the daily values of solar wind speed. Figure 4 shows that the weekend enhancement curves for solar wind speed and geomagnetic activity are fairly similar over the 35-year interval covered. All three parameters depict a weak rise from 1965 to a maximum in about 1980–1985 and a rapid decrease thereafter. This similarity is in accordance with the fact that global geomagnetic activity on long time scales is driven by solar wind speed.
5 Conclusions
In this paper, we have reanalysed the suggested evidence for a higher level of global geomagnetic activity on weekends since the 1930s (Fraser-Smith, 1979). The reason for this so-called “weekend effect” was suggested to be the different amount of power line harmonic radiation between weekends and weekdays.
We have calculated the temporal evolution of the weekend-weekday difference during the last 131 years and find no sys-tematic or statistically significant enhancement of geomag-netic activity on weekends, neither during the overall 131-year interval studied, nor during the more recent decades. Instead of a systematically increasing trend, the weekend-weekday difference depicts fluctuations which are, however, below statistical significance. The earlier evidence in favour of the “weekend effect” was based on the rising part of the largest to date statistical fluctuation of the weekend-weekday difference. During the last 15–20 years, the activity has be-come weaker on weekends than weekdays, contrary to the behaviour expected for the “weekend effect”, due to power line harmonic radiation. Moreover, the weekend-weekday difference during the last 35 years is fairly similar in geo-magnetic activity and solar wind speed. This is in accordance with the long-term driving of geomagnetic activity by solar wind speed and the purely statistical nature of the weekend-weekday difference.
1142 A. Karinen et al.: Does the magnetosphere behave differently on weekends? Acknowledgement. We thank J. Kultima of Sodankyl¨a Geophysical
Observatory, Finland, for useful discussions on geomagnetic activ-ity indices. The financial support by Finnish Graduate School in Space Physics of the Academy of Finland is gratefully acknowl-edged.
Topical Editor G. Chanteur thanks A. C. Fraser-Smith and M. A. Clilverd for their help in evaluating this paper.
References
Clilverd, M. A., Clark, T. D. G., Clarke, E., and Rishbeth, H.: In-creased magnetic storm activity from 1868 to 1995, J. Atm. Sol. Terr. Phys., 60, 1047–1056, 1998.
Delouis H. and Mayaud, P.-N.: Spectral analysis of the geomagnetic activity index aa over a 103-year interval, J. Geophys. Res., 80, 4681–4688, 1975.
Fraser-Smith. A. C.: Spectrum of the geomagnetic activity index Ap, J. Geophys. Res., 77, 4209–4219, 1972.
Fraser-Smith, A. C.: A weekend increase in the geomagnetic activ-ity, J. Geophys. Res., 84, 2089–2096, 1979.
Helliwell, R. A. and Katsufrakis, J.-P.: VLF wave injection into the magnetosphere from Siple Station, Antarctica, J. Geophys. Res., 79, 2511–2518, 1974.
Helliwell, R. A., Katsufrakis, J.-P., Bell, T. A., and Raghuram, R.: VLF line radiation in the Earth’s magnetosphere and its associ-ation with power system radiassoci-ation, J. Geophys. Res., 80, 4249– 4258, 1975.
Lockwood M., Stamper, R., and Wild, M. N.: A doubling of the Sun’s coronal magnetic field during the past 100 years, Nature, 399, 437–439, 1999.
Park, C. G.: VLF wave activity during a magnetic storm: a case study of the role of power line radiation, J. Geophys. Res., 82, 3251–3260, 1977.
Park, C. G. and Helliwell, R. A.: Magnetospheric effects of power line radiation, Science, 200, 727–730, 1978.
Parrot, M.: Observations of power line harmonic radiation by the low-altitude AUREOL 3 satellite, J. Geophys. Res., 99, 3961– 3969, 1994.
Rodger, C. J., Clilverd, M. A., Yearby, K. H., and Smith, A. J.: Is magnetospheric line radiation man-made?, J. Geophys. Res., 105, 15981–15990, 2000.